| Param | Original file | Final file |
|---|---|---|
| Filename | modeM0/AS1G07_060T01_9000001200_08551cztM0_level2.evt | modeM0/AS1G07_060T01_9000001200_08551cztM0_level2_quad_clean.evt |
| Size (bytes) | 423,322,560 | 88,464,960 |
| Size | 403.7 MB | 84.4 MB |
| Events in quadrant A | 3,226,817 | 557,021 |
| Events in quadrant B | 3,127,606 | 565,701 |
| Events in quadrant C | 2,928,109 | 560,410 |
| Events in quadrant D | 3,094,317 | 541,205 |
| Mode SS | |||
|---|---|---|---|
| Quadrant | BADHDUFLAG | Total packets | Discarded packets |
| A | 0 | 132 | 0 |
| B | 0 | 132 | 0 |
| C | 0 | 132 | 0 |
| D | 0 | 132 | 0 |
| Mode M0 | |||
|---|---|---|---|
| Quadrant | BADHDUFLAG | Total packets | Discarded packets |
| A | 0 | 14332 | 3 |
| B | 0 | 13780 | 2 |
| C | 0 | 13372 | 2 |
| D | 0 | 14087 | 2 |
| Mode M9 | |||
|---|---|---|---|
| Quadrant | BADHDUFLAG | Total packets | Discarded packets |
| A | 0 | 12 | 0 |
| B | 0 | 12 | 0 |
| C | 0 | 12 | 0 |
| D | 0 | 13 | 0 |
| Quadrant | Total seconds | Saturated seconds | Saturation percentage |
|---|---|---|---|
| A | 6520 | 87 | 1.334356% |
| B | 6520 | 46 | 0.705521% |
| C | 6520 | 23 | 0.352761% |
| D | 6520 | 68 | 1.042945% |
Noise dominated data is calculated using 1-second bins in cleaned event files. If a bin has >2000 counts, and if more than 50% of those come from <1% of pixels, then it is considered to be noise-dominated and hence unusable.
| Quadrant | # 1 sec bins | Bins with >0 counts | Bins with >2000 counts | High rate bins dominated by noise | Noise dominated (total time) | Noise dominated (detector-on time) | Marked lightcurve |
|---|---|---|---|---|---|---|---|
| A | 7610 | 6521 | 32 | 32 | 0.42% | 0.49% | 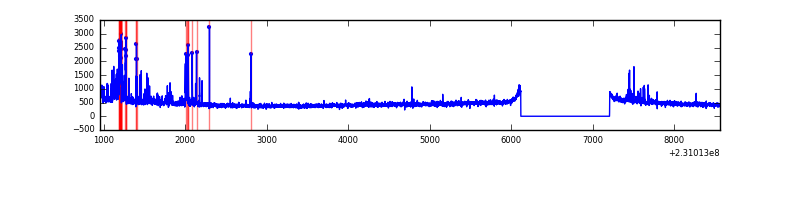 |
| B | 7610 | 6521 | 7 | 7 | 0.09% | 0.11% | 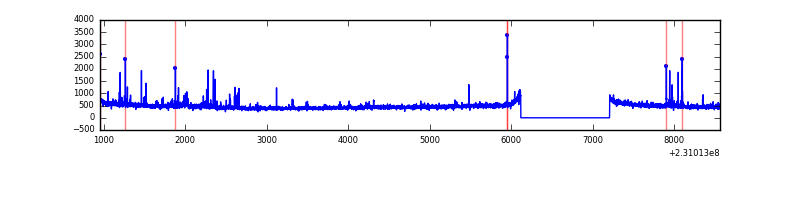 |
| C | 7610 | 6520 | 0 | 0 | 0.00% | 0.00% | 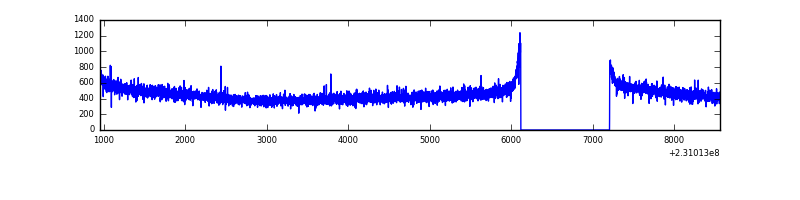 |
| D | 7610 | 6520 | 35 | 35 | 0.46% | 0.54% | 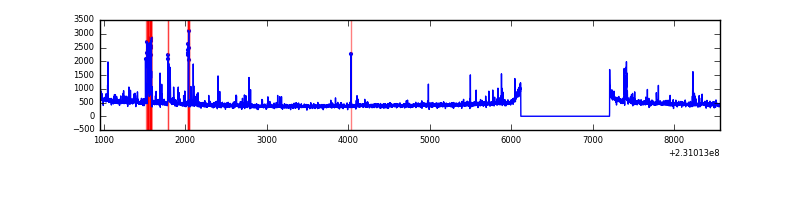 |
Top three noisy pixels from each quadrant. If the there are fewer than three noisy pixels in the level2.evt file, extra rows are filled as -1
| Pixel properties | Quadrant properties | ||||||
|---|---|---|---|---|---|---|---|
| Quadrant | DetID | PixID | Counts | Sigma | Mean | Median | Sigma |
| A | 15 | 223 | 218766 | 1430.13 | 760 | 745 | 152.4 |
| A | 15 | 239 | 73086 | 474.53 | 760 | 745 | 152.4 |
| A | 0 | 226 | 6925 | 40.54 | 760 | 745 | 152.4 |
| B | 10 | 16 | 62650 | 421.45 | 766 | 746 | 146.9 |
| B | 0 | 214 | 26750 | 177.04 | 766 | 746 | 146.9 |
| B | 10 | 246 | 20572 | 134.98 | 766 | 746 | 146.9 |
| C | 13 | 61 | 5527 | 27.72 | 749 | 755 | 172.1 |
| C | 9 | 54 | 4231 | 20.19 | 749 | 755 | 172.1 |
| C | 12 | 4 | 1924 | 6.79 | 749 | 755 | 172.1 |
| D | 7 | 71 | 155311 | 849.9 | 740 | 721 | 181.9 |
| D | 1 | 52 | 28470 | 152.56 | 740 | 721 | 181.9 |
| D | 12 | 233 | 26480 | 141.62 | 740 | 721 | 181.9 |
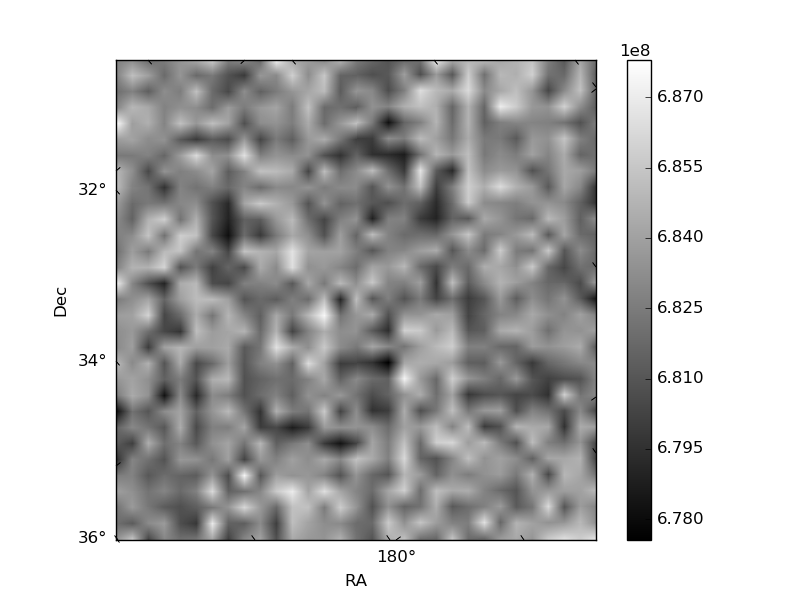
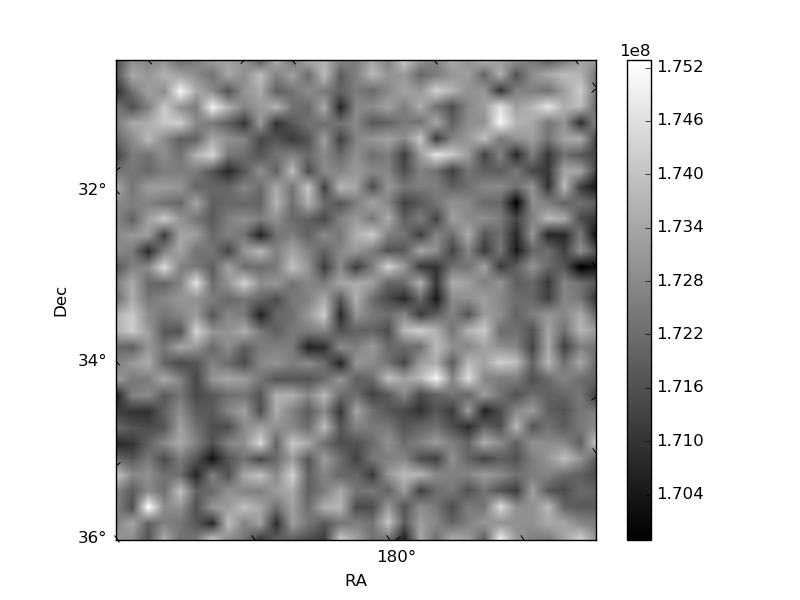
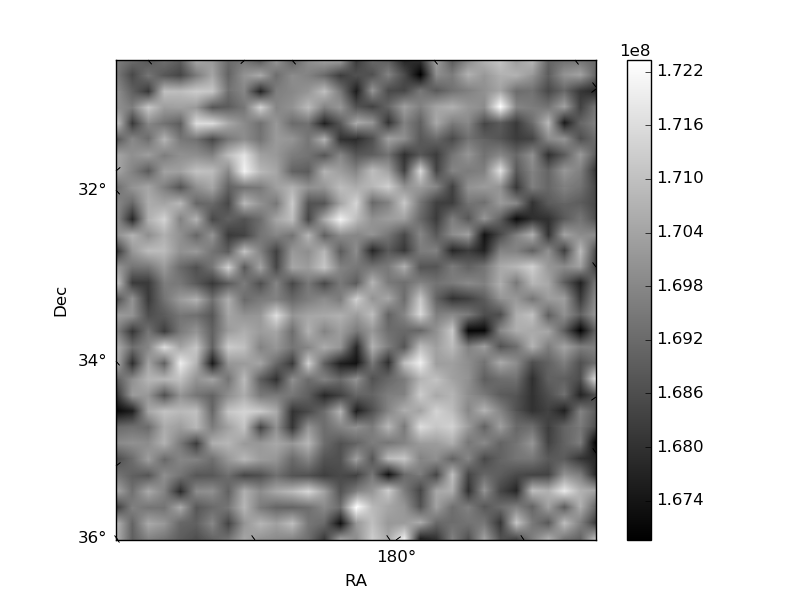
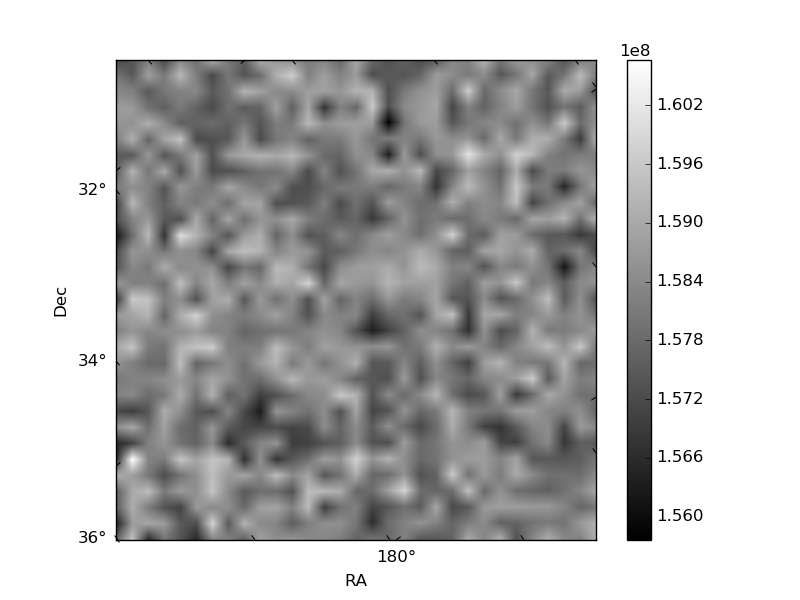
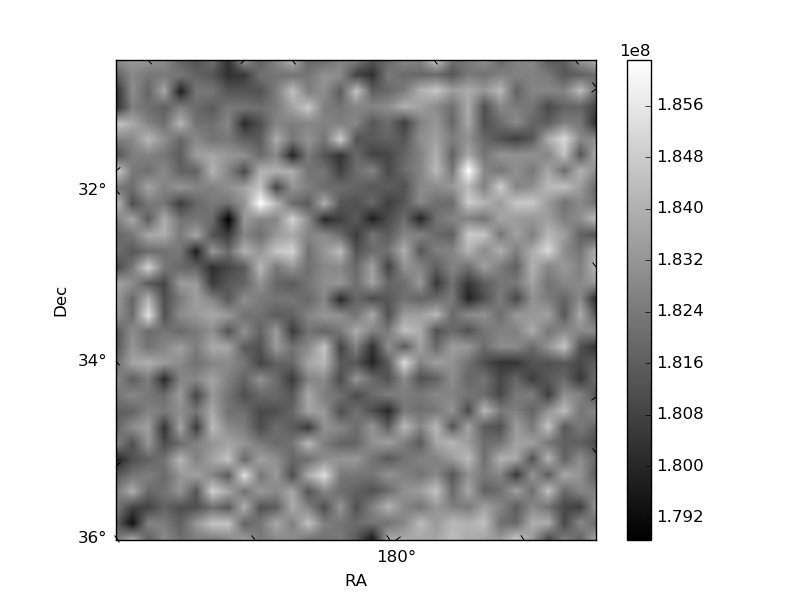
Histogram calculated using DETX and DETY for each event in the final _common_clean file
| Quadrant A | 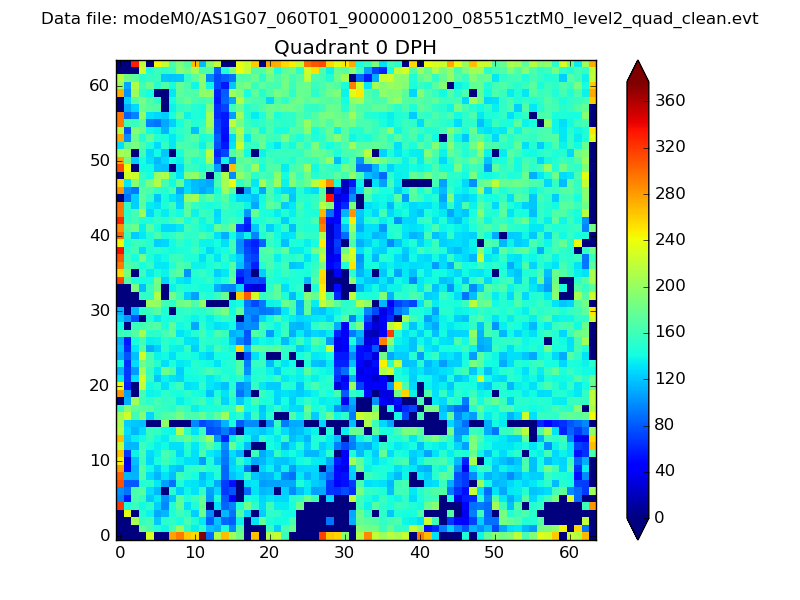 |
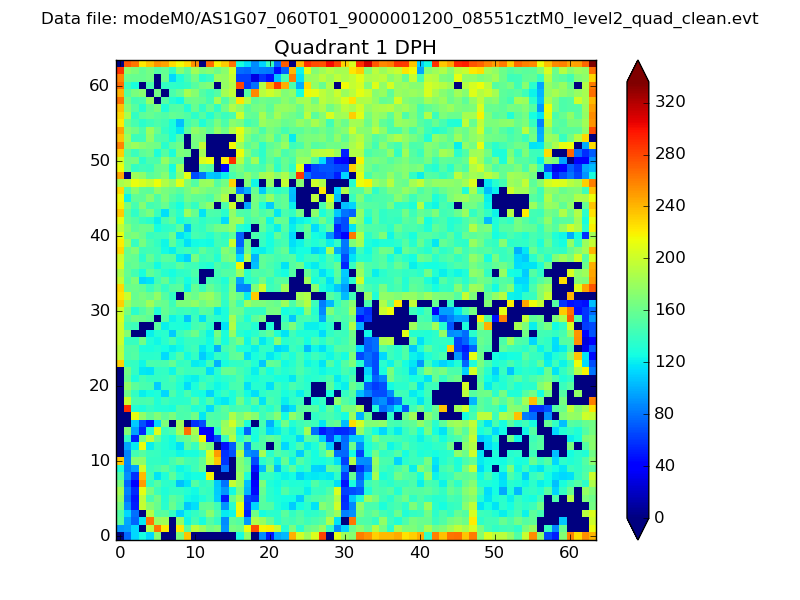 |
Quadrant B |
|---|---|---|---|
| Quadrant D | 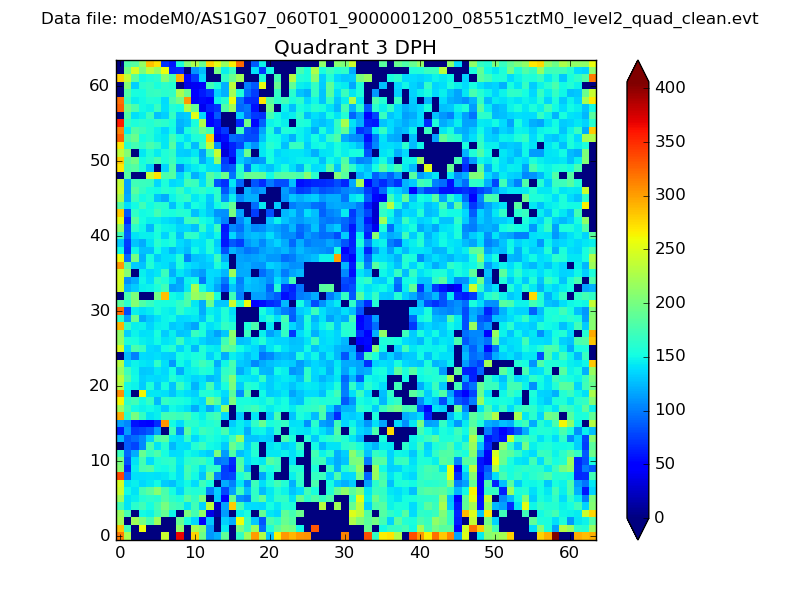 |
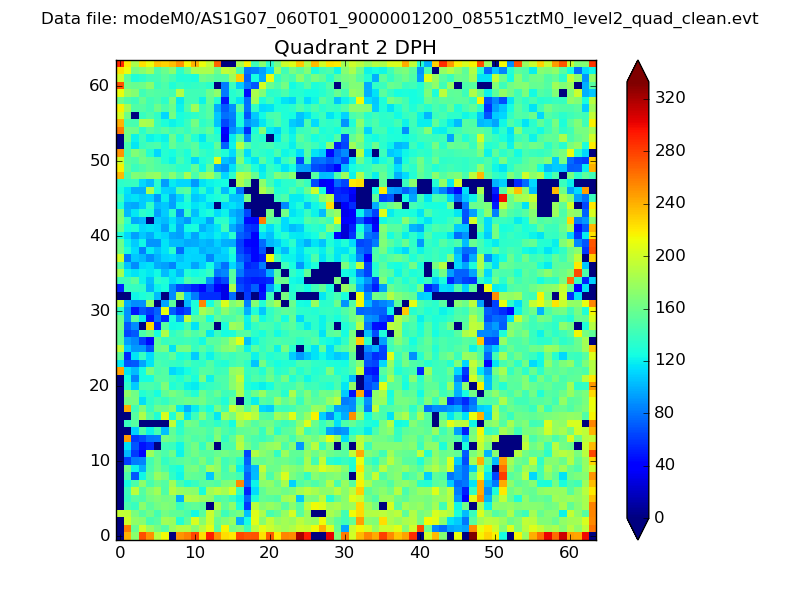 |
Quadrant C |
| Plot type | Count rate plots | Images |
|---|---|---|
| Comparison with Poisson distribution Blue bars denote a histogram of data divided into 1 sec bins. Red curve is a Poisson curve with rate = median count rate of data. |
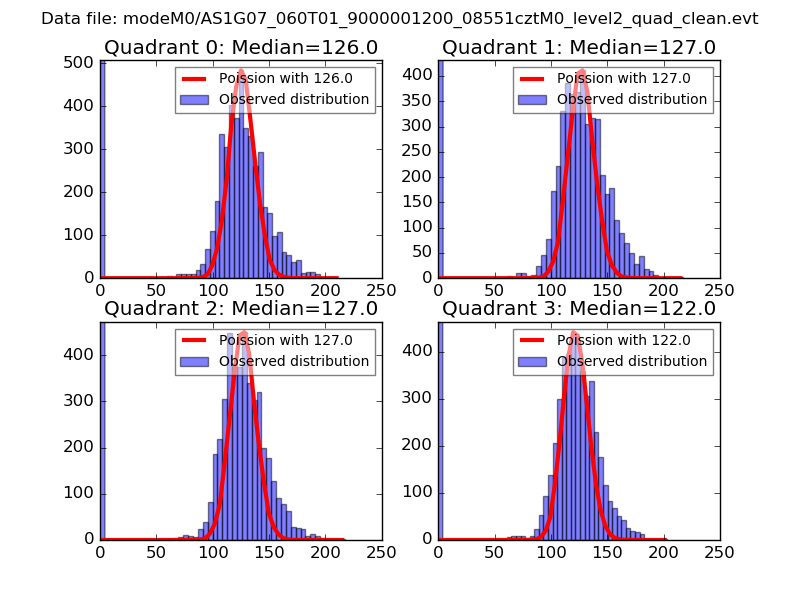 |
 |
| Quadrant-wise count rates Data is divided into 100 sec bins |
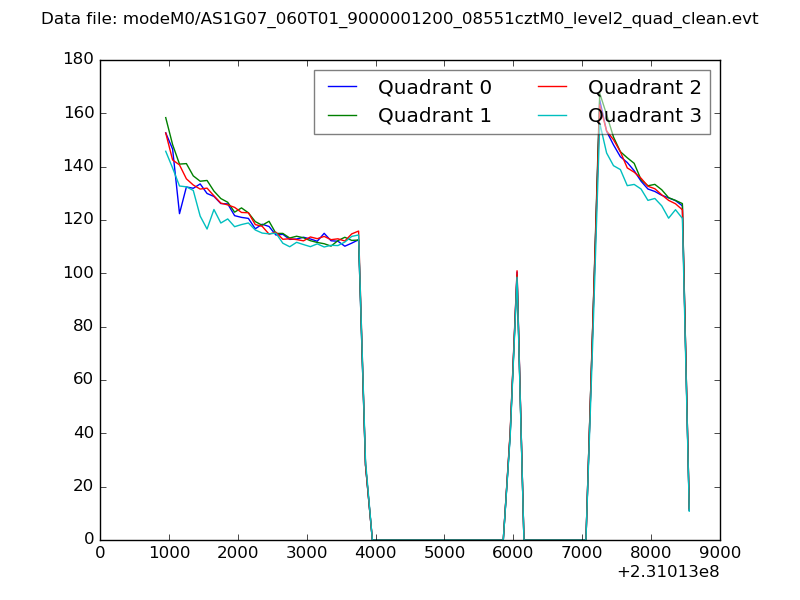 |
|
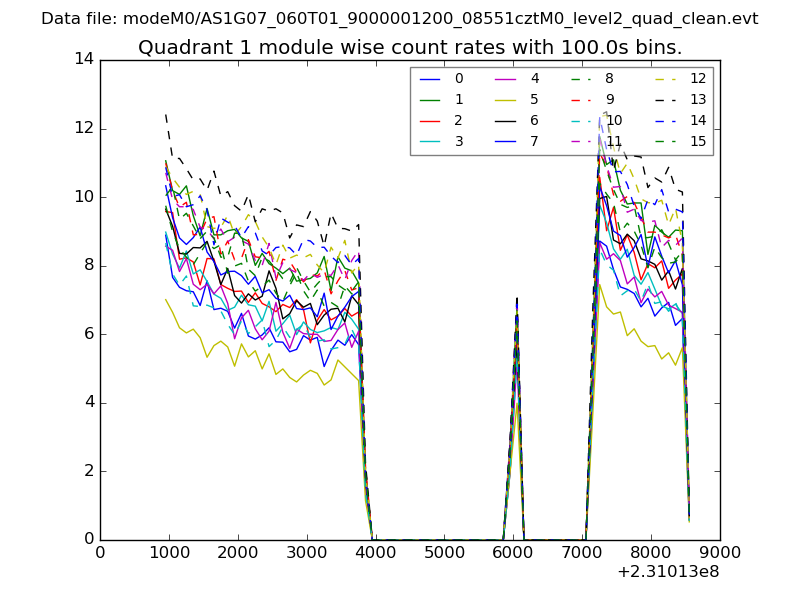
| Module-wise count rates for Quadrant A Data is divided into 100 sec bins |
 |
 |
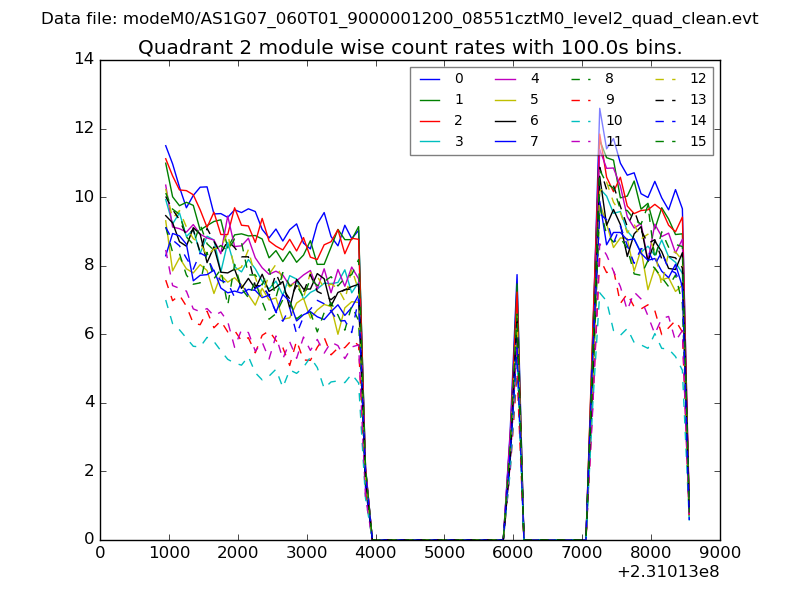
| Module-wise count rates for Quadrant B Data is divided into 100 sec bins |
 |
 |
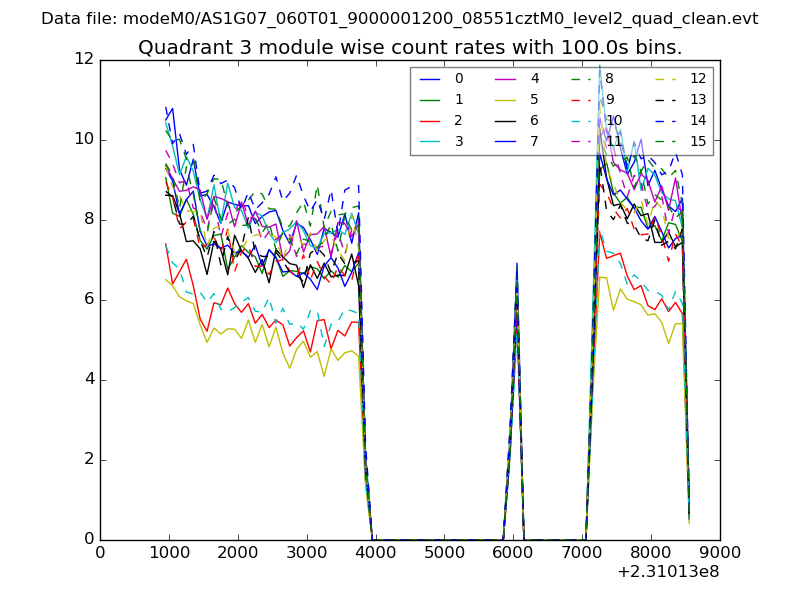
| Module-wise count rates for Quadrant C Data is divided into 100 sec bins |
 |
 |
| Module-wise count rates for Quadrant D Data is divided into 100 sec bins |
 |
 |
| Parameter | Plot |
|---|---|
| CZT HV Monitor | 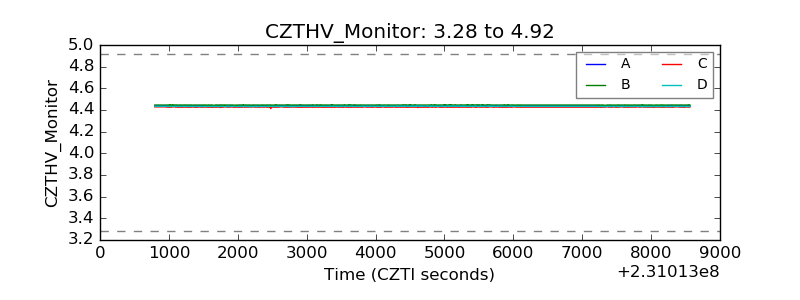 |
| D_VDD | 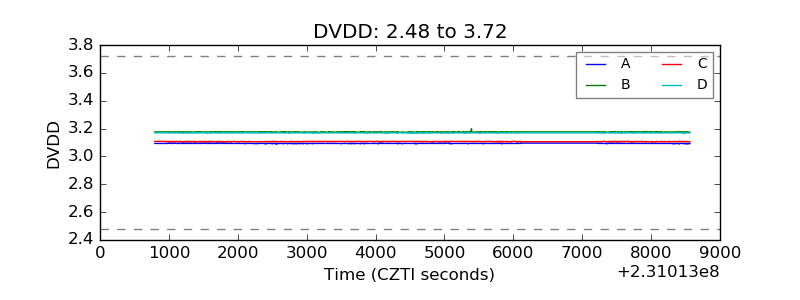 |
| Temperature 1 | 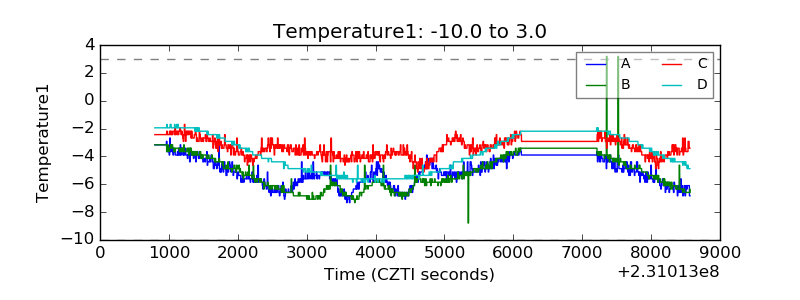 |
| Veto HV Monitor | 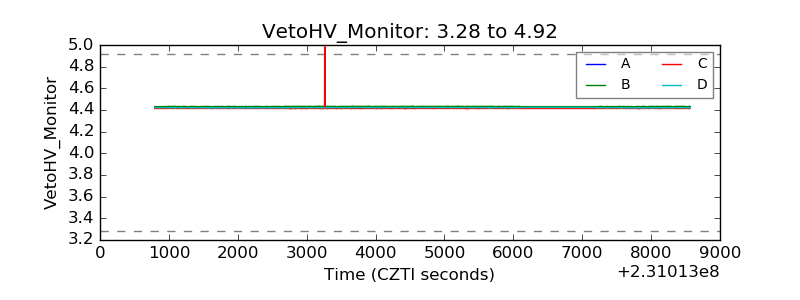 |
| Veto LLD | 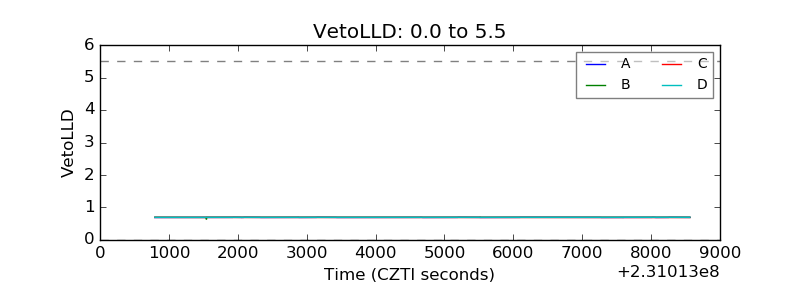 |
| Alpha Counter | 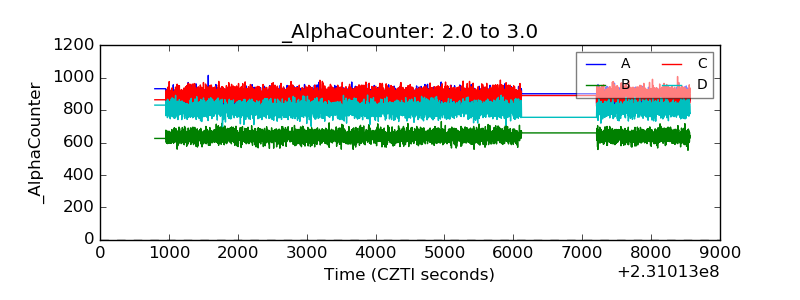 |
| _CPM_Rate | 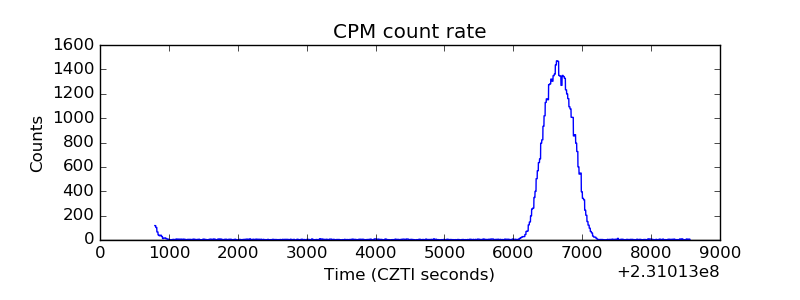 |
| CZT Counter | 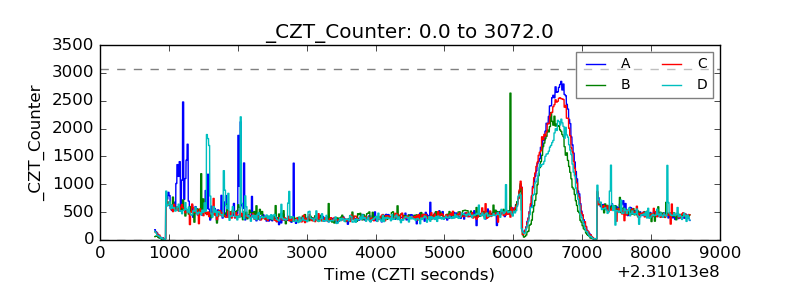 |
| +2.5 Volts monitor |  |
| +5 Volts monitor |  |
| _ROLL_ROT | 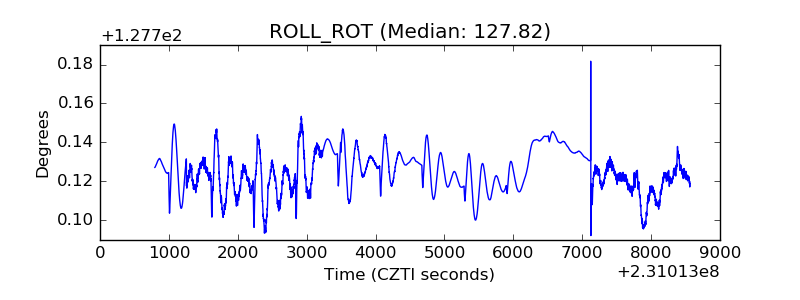 |
| _Roll_DEC | 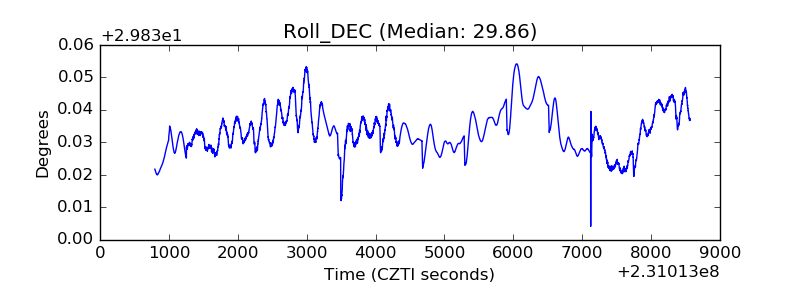 |
| _Roll_RA | 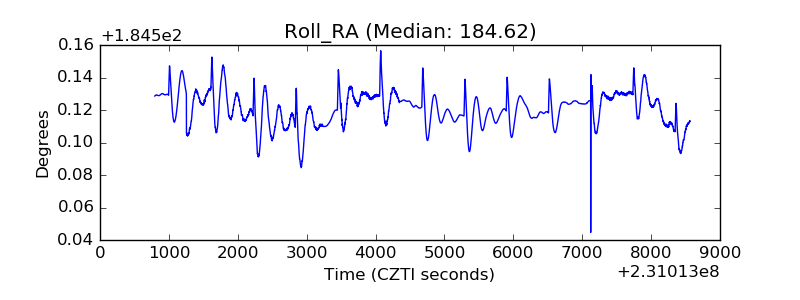 |
| Veto Counter | 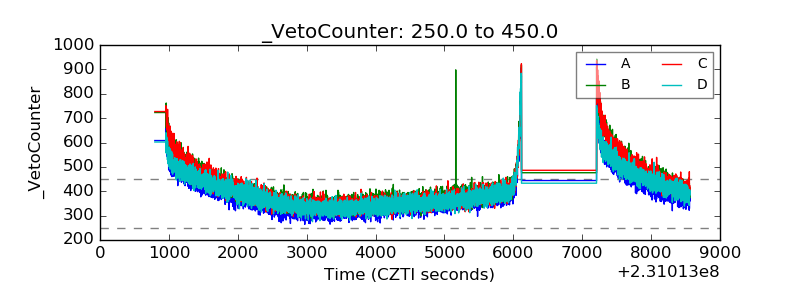 |