| Param | Original file | Final file |
|---|---|---|
| Filename | modeM0/AS1G07_060T01_9000001200_08553cztM0_level2.evt | modeM0/AS1G07_060T01_9000001200_08553cztM0_level2_quad_clean.evt |
| Size (bytes) | 401,765,760 | 87,557,760 |
| Size | 383.2 MB | 83.5 MB |
| Events in quadrant A | 2,891,862 | 558,608 |
| Events in quadrant B | 3,033,015 | 571,814 |
| Events in quadrant C | 2,849,535 | 556,061 |
| Events in quadrant D | 2,969,120 | 530,104 |
| Mode SS | |||
|---|---|---|---|
| Quadrant | BADHDUFLAG | Total packets | Discarded packets |
| A | 0 | 128 | 0 |
| B | 0 | 128 | 0 |
| C | 0 | 128 | 0 |
| D | 0 | 128 | 0 |
| Mode M0 | |||
|---|---|---|---|
| Quadrant | BADHDUFLAG | Total packets | Discarded packets |
| A | 0 | 12812 | 3 |
| B | 0 | 13098 | 2 |
| C | 0 | 12723 | 2 |
| D | 0 | 13400 | 4 |
| Mode M9 | |||
|---|---|---|---|
| Quadrant | BADHDUFLAG | Total packets | Discarded packets |
| A | 0 | 23 | 0 |
| B | 0 | 23 | 0 |
| C | 0 | 23 | 0 |
| D | 0 | 24 | 0 |
| Quadrant | Total seconds | Saturated seconds | Saturation percentage |
|---|---|---|---|
| A | 6225 | 17 | 0.273092% |
| B | 6225 | 41 | 0.658635% |
| C | 6225 | 7 | 0.112450% |
| D | 6224 | 33 | 0.530206% |
Noise dominated data is calculated using 1-second bins in cleaned event files. If a bin has >2000 counts, and if more than 50% of those come from <1% of pixels, then it is considered to be noise-dominated and hence unusable.
| Quadrant | # 1 sec bins | Bins with >0 counts | Bins with >2000 counts | High rate bins dominated by noise | Noise dominated (total time) | Noise dominated (detector-on time) | Marked lightcurve |
|---|---|---|---|---|---|---|---|
| A | 7535 | 6226 | 0 | 0 | 0.00% | 0.00% | 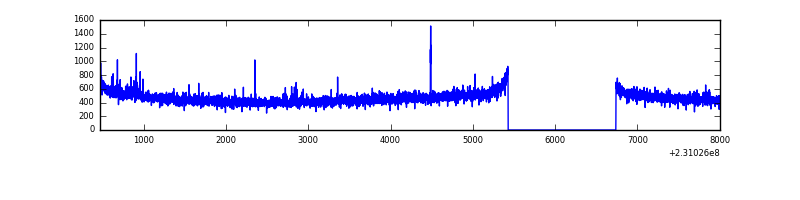 |
| B | 7535 | 6226 | 15 | 15 | 0.20% | 0.24% | 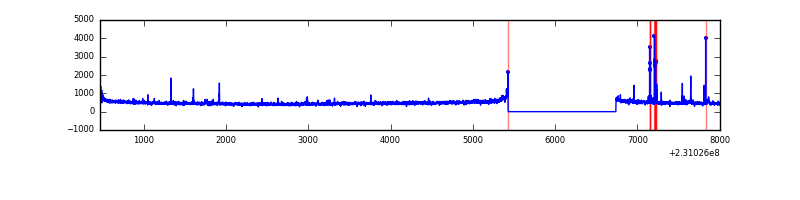 |
| C | 7535 | 6226 | 0 | 0 | 0.00% | 0.00% | 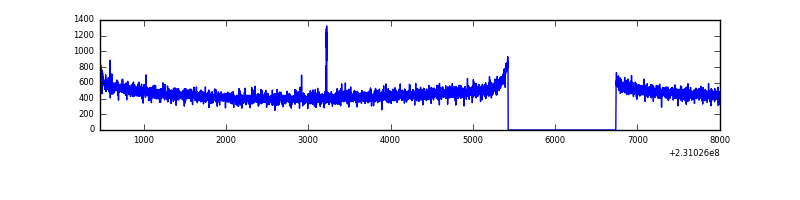 |
| D | 7535 | 6226 | 22 | 22 | 0.29% | 0.35% | 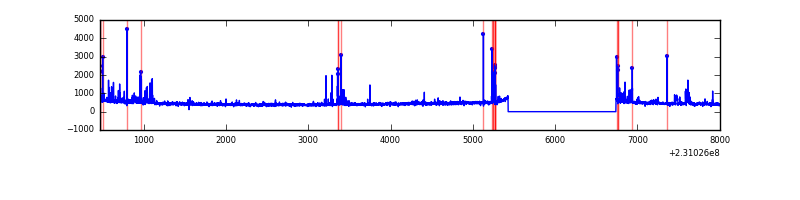 |
Top three noisy pixels from each quadrant. If the there are fewer than three noisy pixels in the level2.evt file, extra rows are filled as -1
| Pixel properties | Quadrant properties | ||||||
|---|---|---|---|---|---|---|---|
| Quadrant | DetID | PixID | Counts | Sigma | Mean | Median | Sigma |
| A | 15 | 223 | 19563 | 125.21 | 743 | 729 | 150.4 |
| A | 14 | 111 | 8191 | 49.61 | 743 | 729 | 150.4 |
| A | 0 | 226 | 6875 | 40.86 | 743 | 729 | 150.4 |
| B | 10 | 16 | 79839 | 553.73 | 749 | 732 | 142.9 |
| B | 0 | 214 | 23308 | 158.03 | 749 | 732 | 142.9 |
| B | 12 | 111 | 15661 | 104.5 | 749 | 732 | 142.9 |
| C | 9 | 54 | 6956 | 37.05 | 726 | 731 | 168.0 |
| C | 13 | 61 | 5565 | 28.77 | 726 | 731 | 168.0 |
| C | 8 | 128 | 4936 | 25.03 | 726 | 731 | 168.0 |
| D | 1 | 52 | 68934 | 391.6 | 711 | 693 | 174.3 |
| D | 4 | 95 | 55257 | 313.12 | 711 | 693 | 174.3 |
| D | 13 | 122 | 36627 | 206.21 | 711 | 693 | 174.3 |
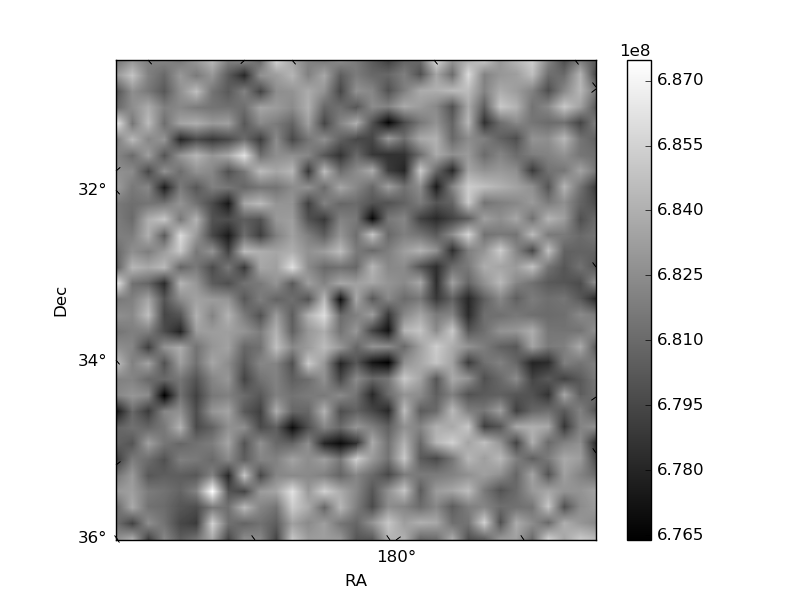
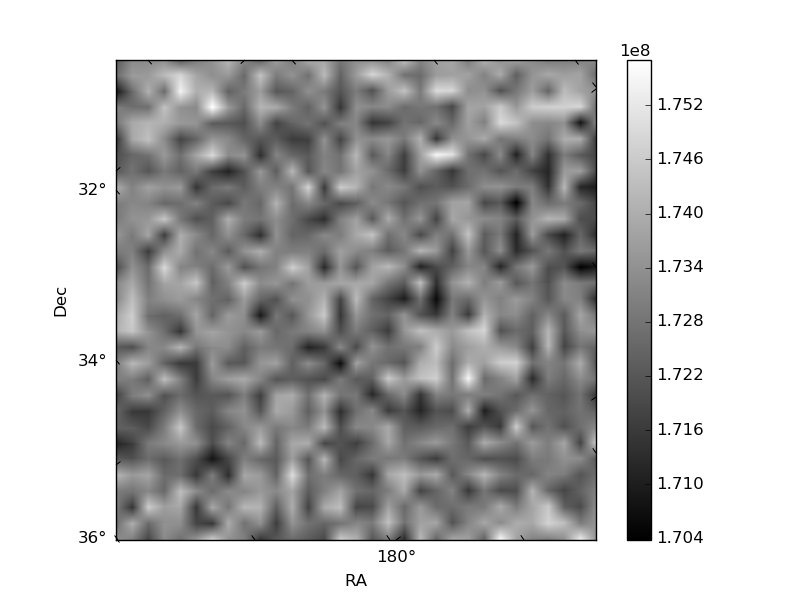
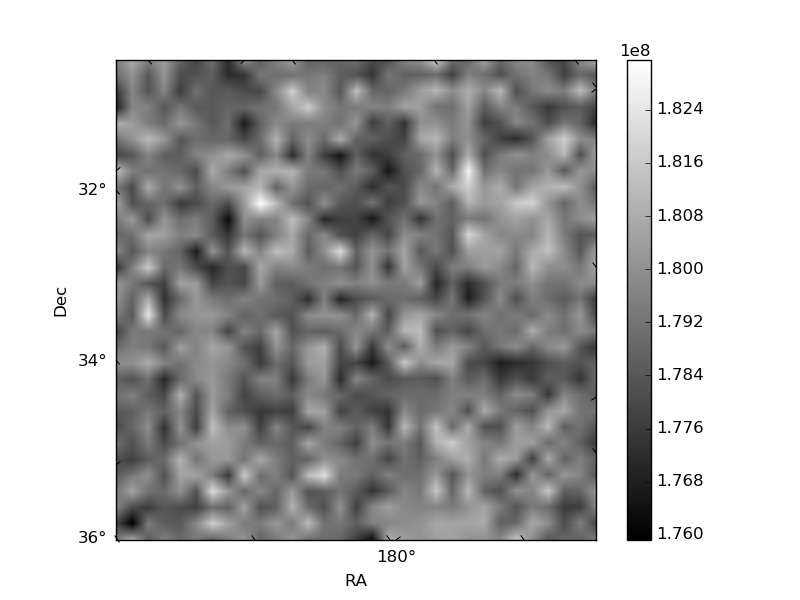
Histogram calculated using DETX and DETY for each event in the final _common_clean file
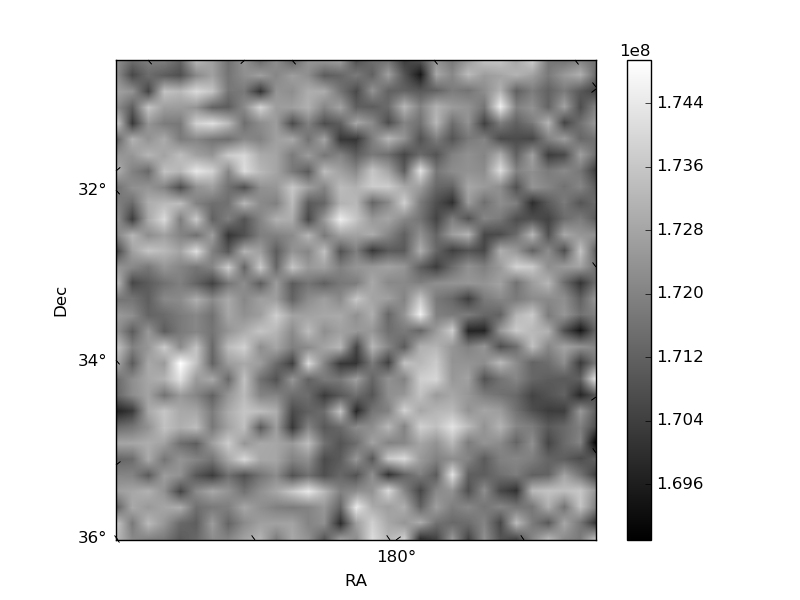
| Quadrant A | 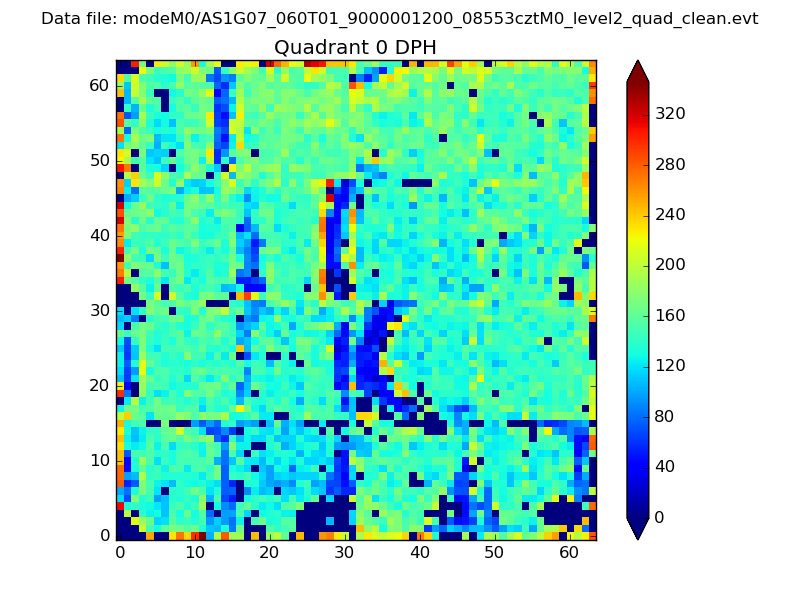 |
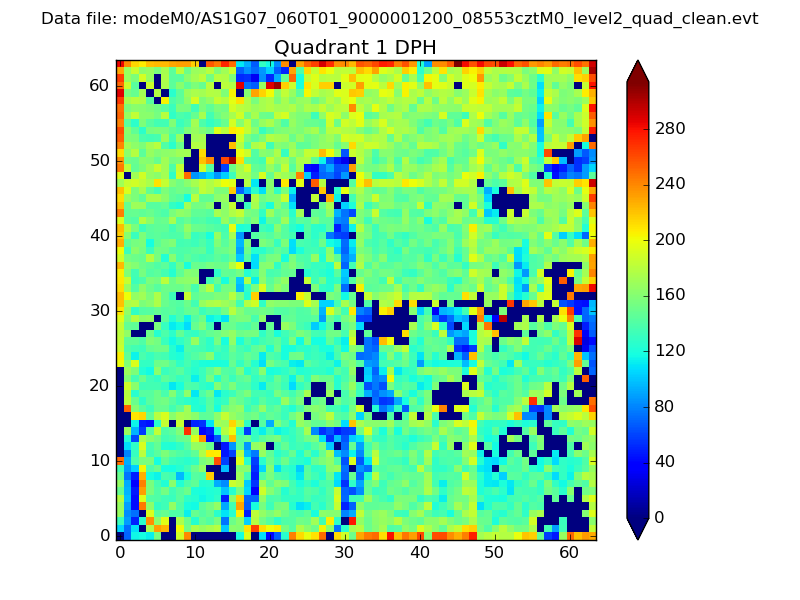 |
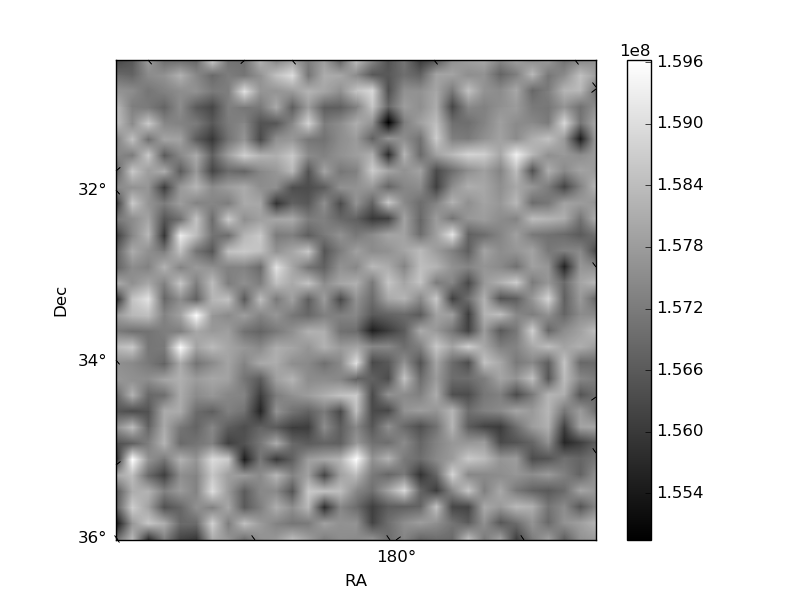
Quadrant B |
|---|---|---|---|
| Quadrant D | 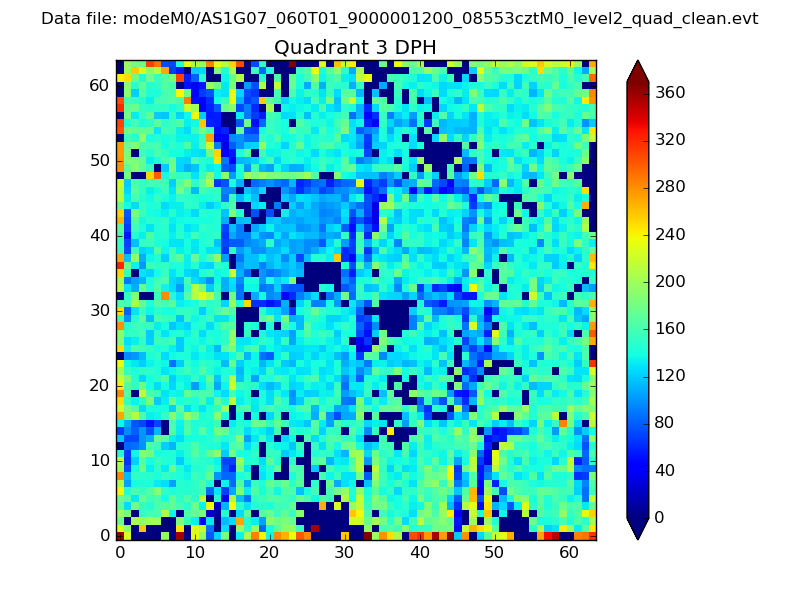 |
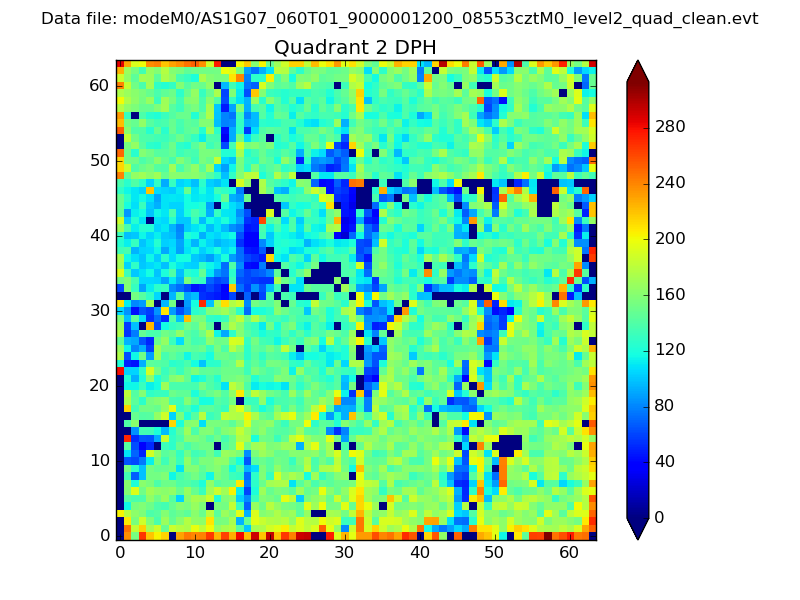 |
Quadrant C |
| Plot type | Count rate plots | Images |
|---|---|---|
| Comparison with Poisson distribution Blue bars denote a histogram of data divided into 1 sec bins. Red curve is a Poisson curve with rate = median count rate of data. |
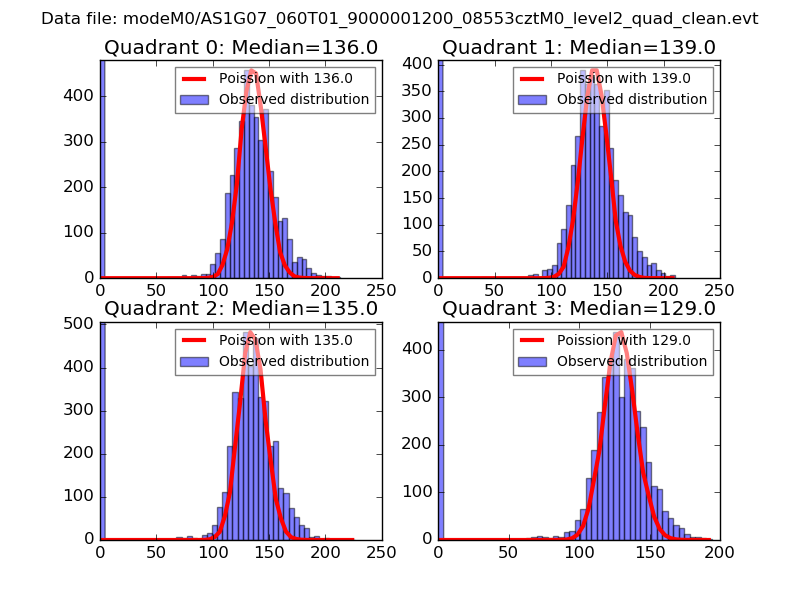 |
 |
| Quadrant-wise count rates Data is divided into 100 sec bins |
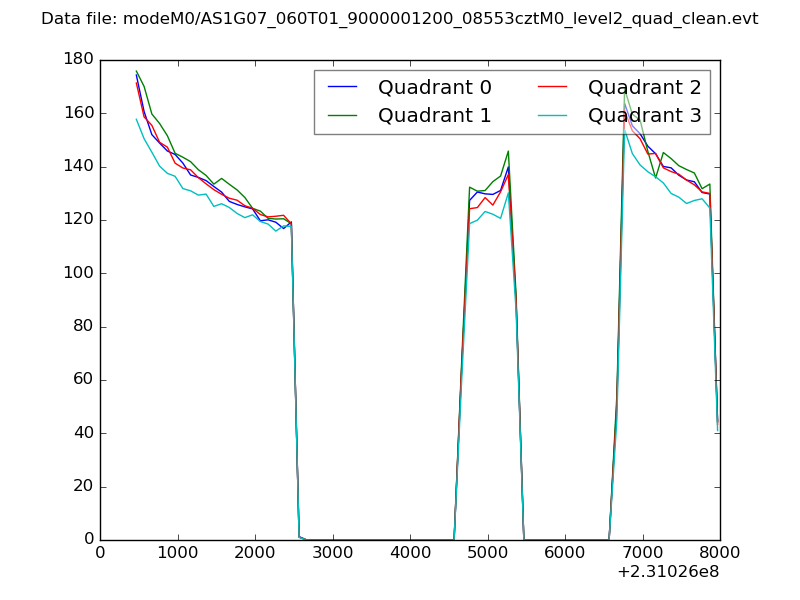 |
|
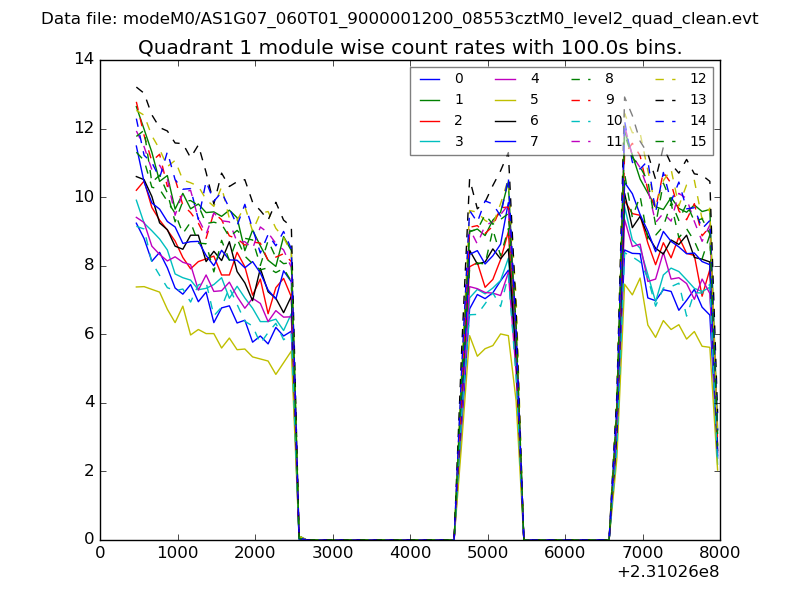
| Module-wise count rates for Quadrant A Data is divided into 100 sec bins |
 |
 |
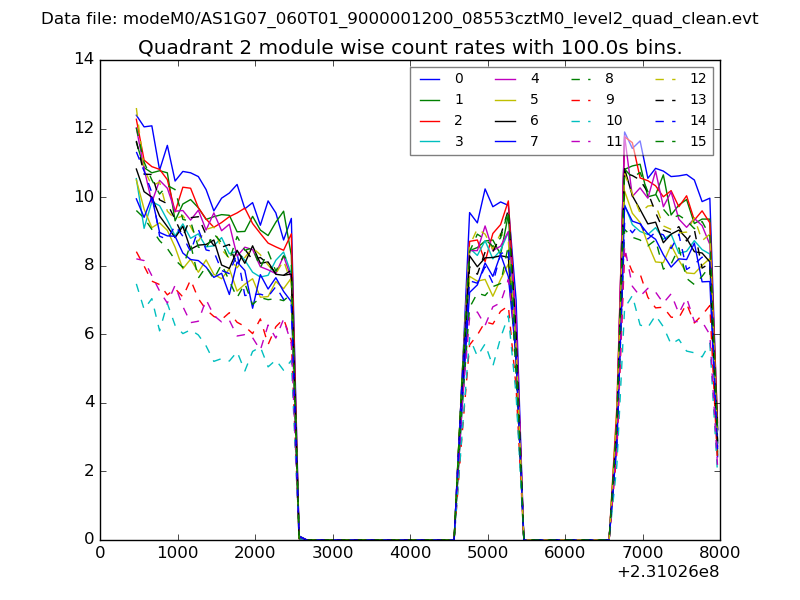
| Module-wise count rates for Quadrant B Data is divided into 100 sec bins |
 |
 |
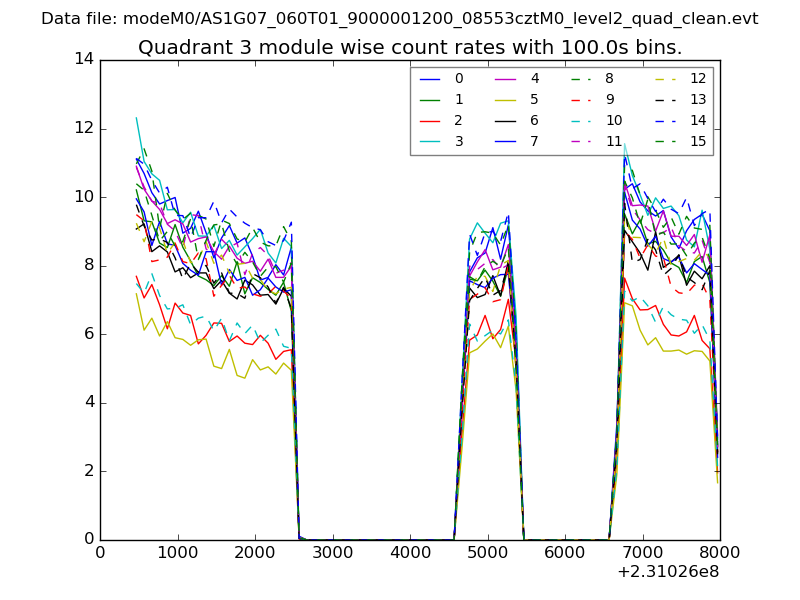
| Module-wise count rates for Quadrant C Data is divided into 100 sec bins |
 |
 |
| Module-wise count rates for Quadrant D Data is divided into 100 sec bins |
 |
 |
| Parameter | Plot |
|---|---|
| CZT HV Monitor | 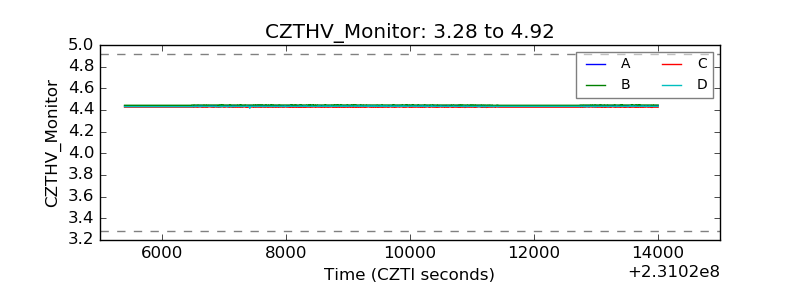 |
| D_VDD | 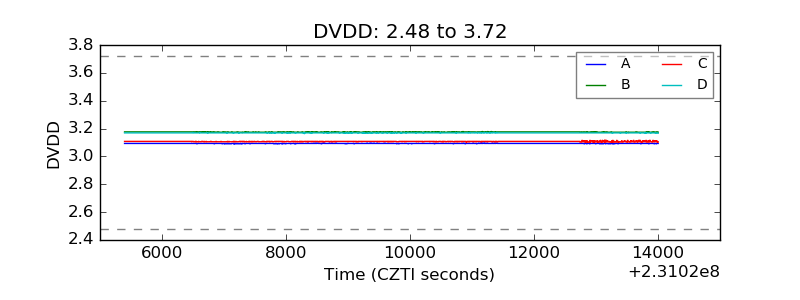 |
| Temperature 1 | 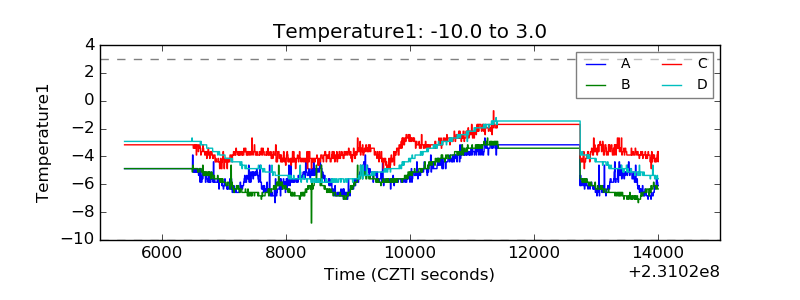 |
| Veto HV Monitor | 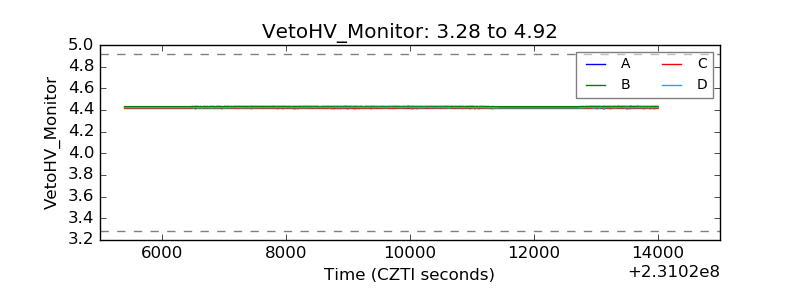 |
| Veto LLD | 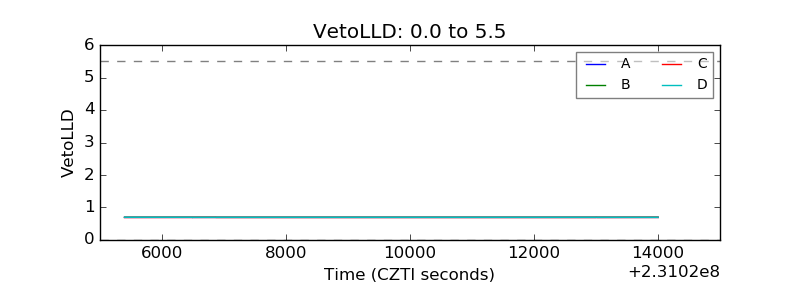 |
| Alpha Counter | 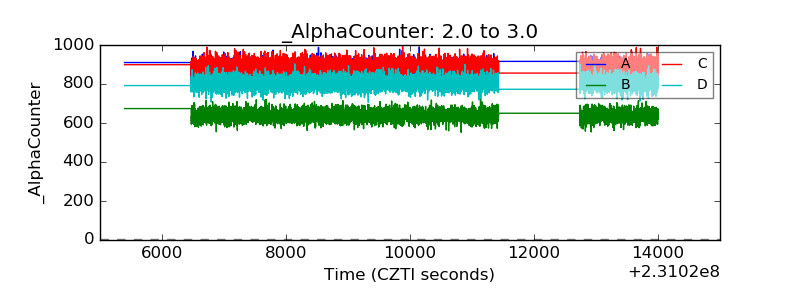 |
| _CPM_Rate | 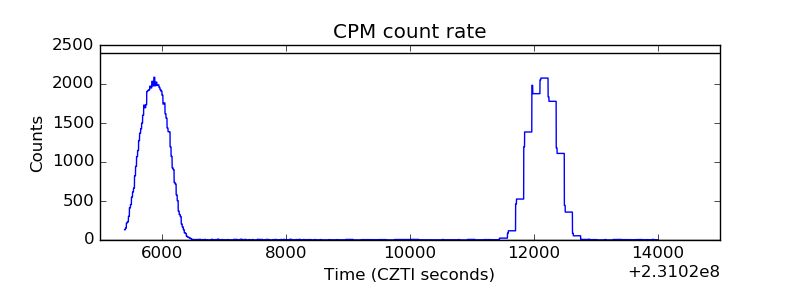 |
| CZT Counter | 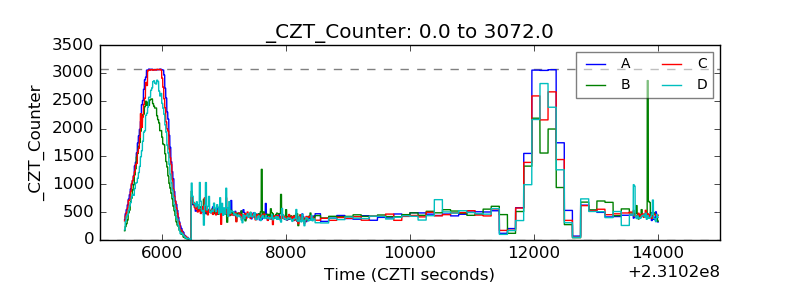 |
| +2.5 Volts monitor |  |
| +5 Volts monitor |  |
| _ROLL_ROT | 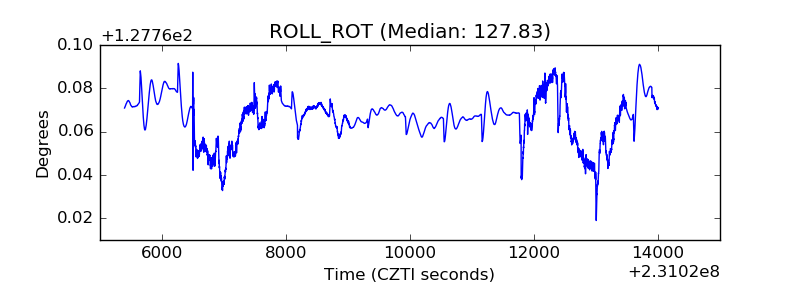 |
| _Roll_DEC | 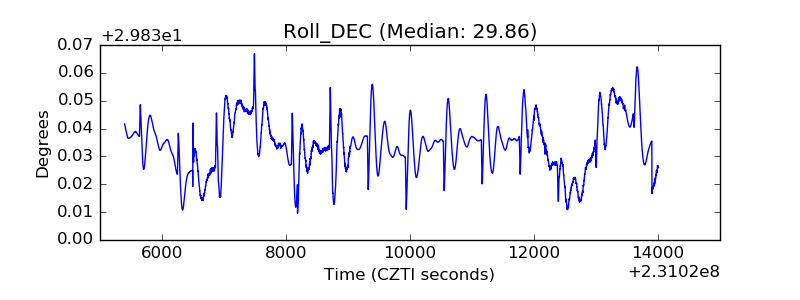 |
| _Roll_RA | 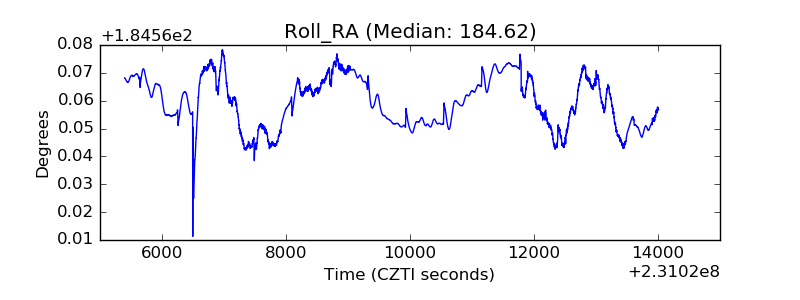 |
| Veto Counter | 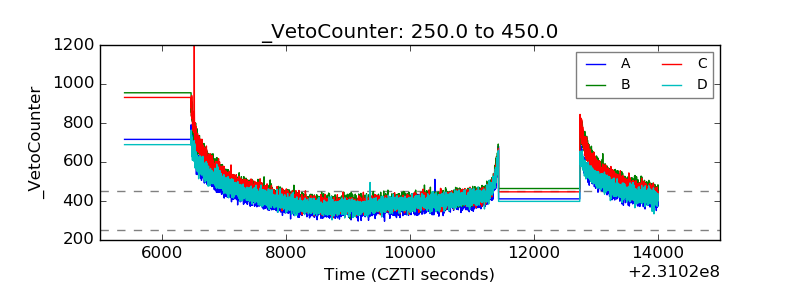 |