| Param | Original file | Final file |
|---|---|---|
| Filename | modeM0/AS1G07_060T01_9000001200_08554cztM0_level2.evt | modeM0/AS1G07_060T01_9000001200_08554cztM0_level2_quad_clean.evt |
| Size (bytes) | 405,495,360 | 86,434,560 |
| Size | 386.7 MB | 82.4 MB |
| Events in quadrant A | 2,999,538 | 552,487 |
| Events in quadrant B | 3,151,086 | 562,290 |
| Events in quadrant C | 2,835,547 | 547,769 |
| Events in quadrant D | 2,873,697 | 523,528 |
| Mode SS | |||
|---|---|---|---|
| Quadrant | BADHDUFLAG | Total packets | Discarded packets |
| A | 0 | 126 | 2 |
| B | 0 | 126 | 0 |
| C | 0 | 126 | 0 |
| D | 0 | 126 | 0 |
| Mode M0 | |||
|---|---|---|---|
| Quadrant | BADHDUFLAG | Total packets | Discarded packets |
| A | 0 | 13084 | 10 |
| B | 0 | 13439 | 28 |
| C | 0 | 12656 | 23 |
| D | 0 | 13122 | 19 |
| Mode M9 | |||
|---|---|---|---|
| Quadrant | BADHDUFLAG | Total packets | Discarded packets |
| A | 0 | 24 | 0 |
| B | 0 | 24 | 0 |
| C | 0 | 24 | 0 |
| D | 0 | 25 | 0 |
| Quadrant | Total seconds | Saturated seconds | Saturation percentage |
|---|---|---|---|
| A | 6189 | 32 | 0.517046% |
| B | 6180 | 66 | 1.067961% |
| C | 6180 | 8 | 0.129450% |
| D | 6182 | 39 | 0.630864% |
Noise dominated data is calculated using 1-second bins in cleaned event files. If a bin has >2000 counts, and if more than 50% of those come from <1% of pixels, then it is considered to be noise-dominated and hence unusable.
| Quadrant | # 1 sec bins | Bins with >0 counts | Bins with >2000 counts | High rate bins dominated by noise | Noise dominated (total time) | Noise dominated (detector-on time) | Marked lightcurve |
|---|---|---|---|---|---|---|---|
| A | 7496 | 6192 | 14 | 14 | 0.19% | 0.23% |  |
| B | 7496 | 6192 | 33 | 33 | 0.44% | 0.53% |  |
| C | 7496 | 6191 | 0 | 0 | 0.00% | 0.00% | 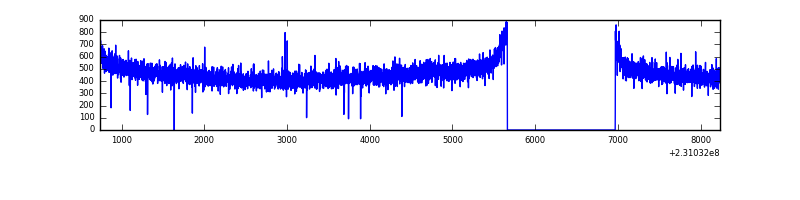 |
| D | 7496 | 6191 | 30 | 30 | 0.40% | 0.48% | 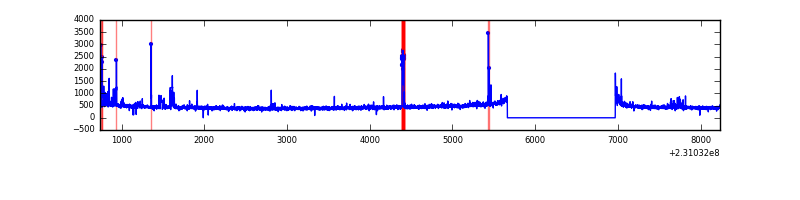 |
Top three noisy pixels from each quadrant. If the there are fewer than three noisy pixels in the level2.evt file, extra rows are filled as -1
| Pixel properties | Quadrant properties | ||||||
|---|---|---|---|---|---|---|---|
| Quadrant | DetID | PixID | Counts | Sigma | Mean | Median | Sigma |
| A | 15 | 223 | 100395 | 664.6 | 740 | 726 | 150.0 |
| A | 15 | 239 | 35687 | 233.12 | 740 | 726 | 150.0 |
| A | 13 | 14 | 7570 | 45.64 | 740 | 726 | 150.0 |
| B | 10 | 16 | 202890 | 1425.24 | 748 | 731 | 141.8 |
| B | 0 | 214 | 21469 | 146.21 | 748 | 731 | 141.8 |
| B | 12 | 111 | 15679 | 105.39 | 748 | 731 | 141.8 |
| C | 8 | 128 | 12339 | 69.6 | 720 | 725 | 166.9 |
| C | 13 | 61 | 5551 | 28.92 | 720 | 725 | 166.9 |
| C | 8 | 112 | 5477 | 28.48 | 720 | 725 | 166.9 |
| D | 4 | 95 | 95077 | 556.12 | 707 | 689 | 169.7 |
| D | 12 | 233 | 23156 | 132.37 | 707 | 689 | 169.7 |
| D | 13 | 105 | 21666 | 123.59 | 707 | 689 | 169.7 |
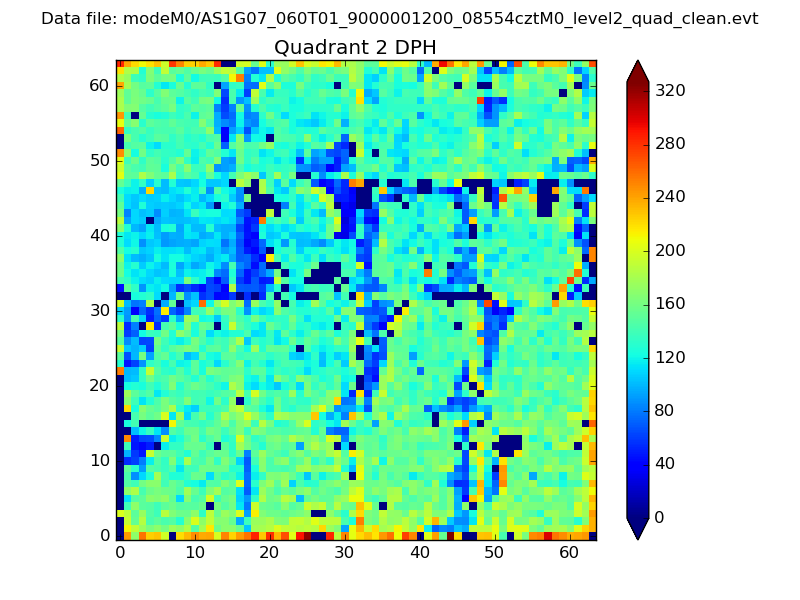
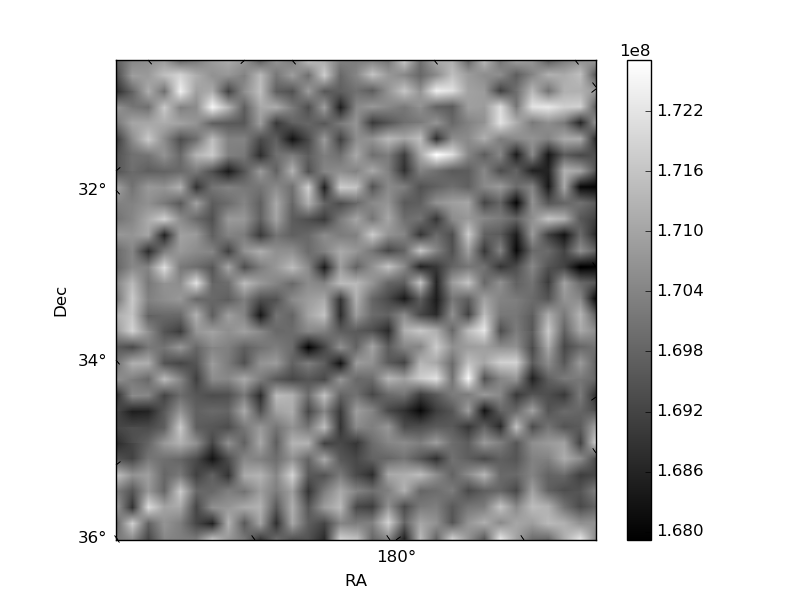
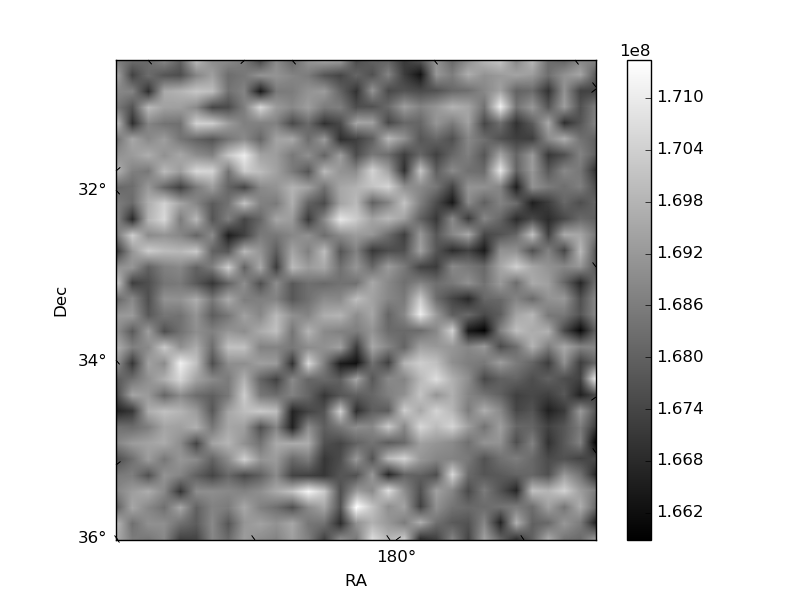
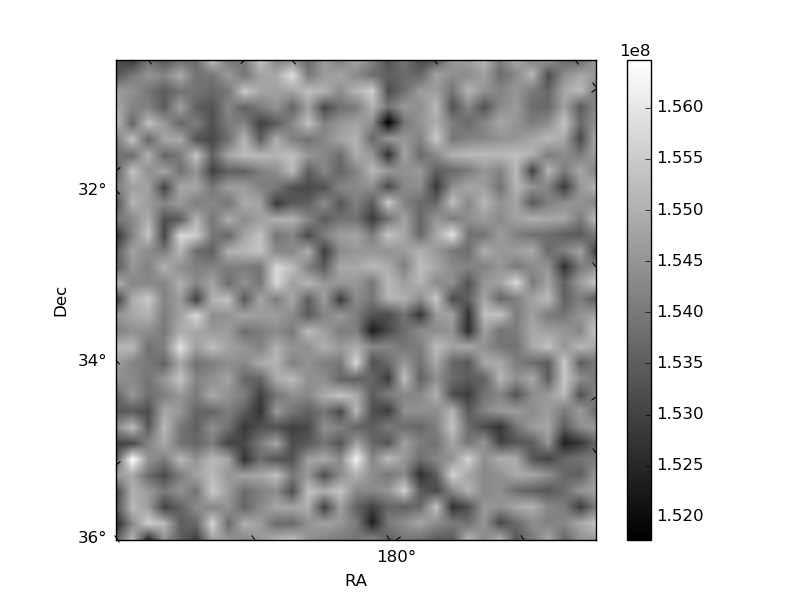
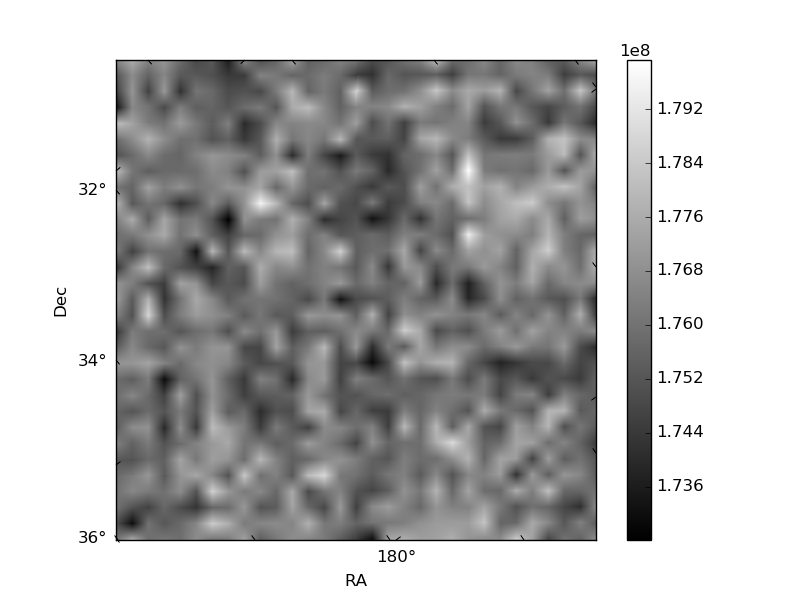
Histogram calculated using DETX and DETY for each event in the final _common_clean file
| Quadrant A | 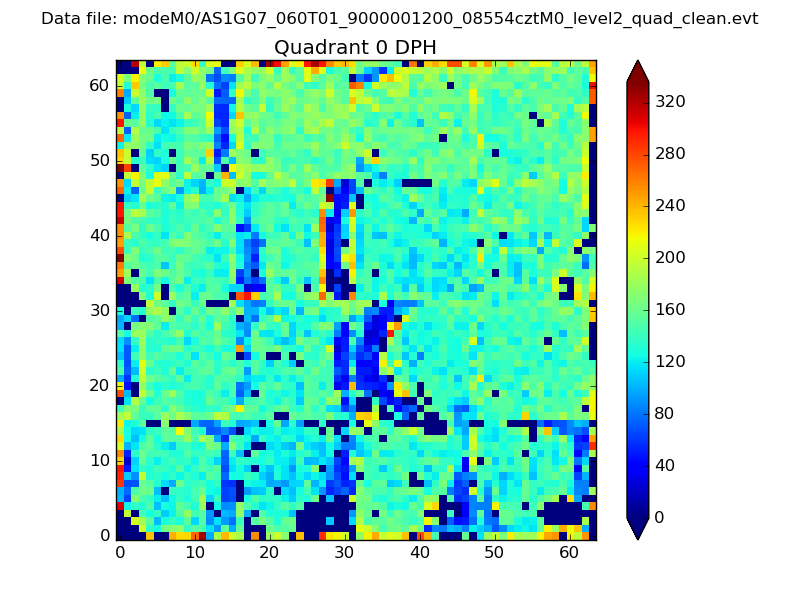 |
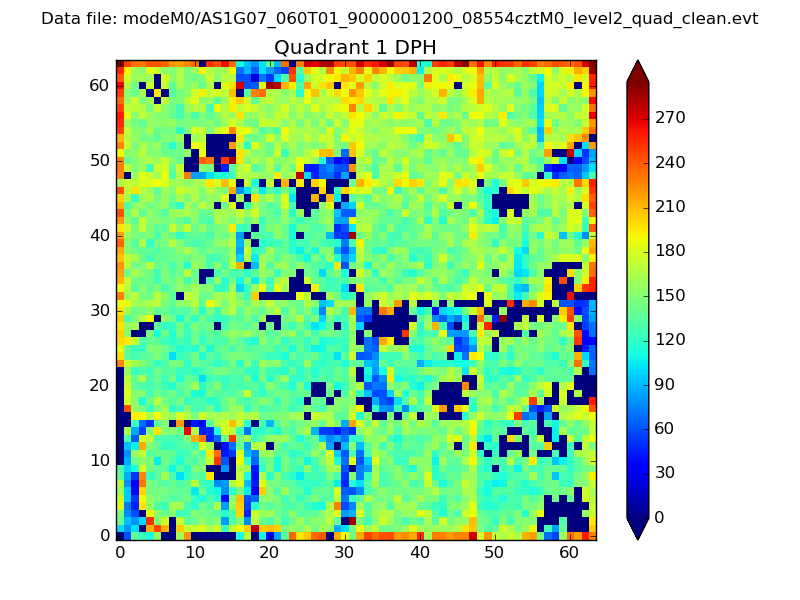 |
Quadrant B |
|---|---|---|---|
| Quadrant D | 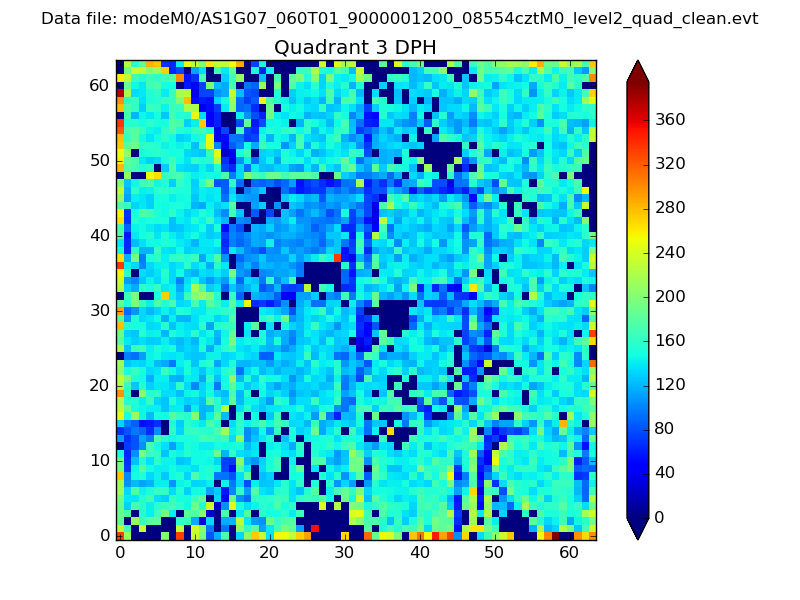 |
 |
Quadrant C |
| Plot type | Count rate plots | Images |
|---|---|---|
| Comparison with Poisson distribution Blue bars denote a histogram of data divided into 1 sec bins. Red curve is a Poisson curve with rate = median count rate of data. |
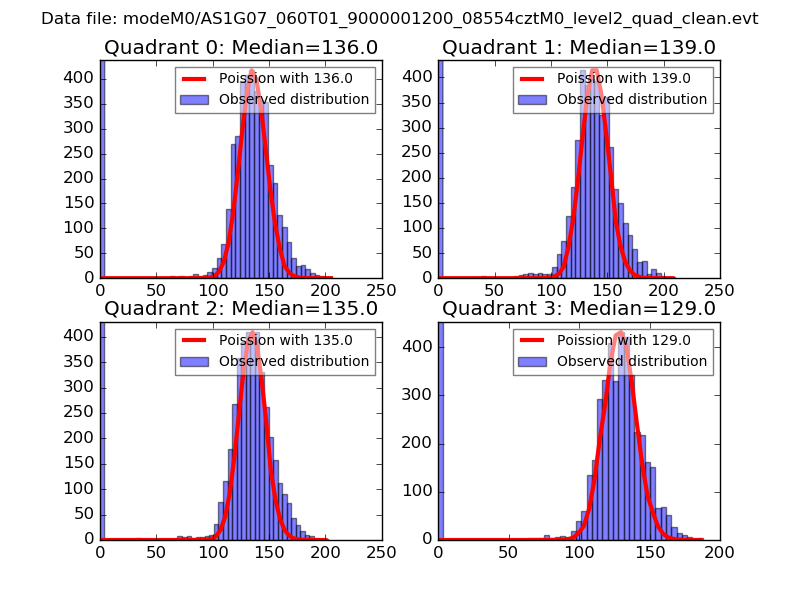 |
 |
| Quadrant-wise count rates Data is divided into 100 sec bins |
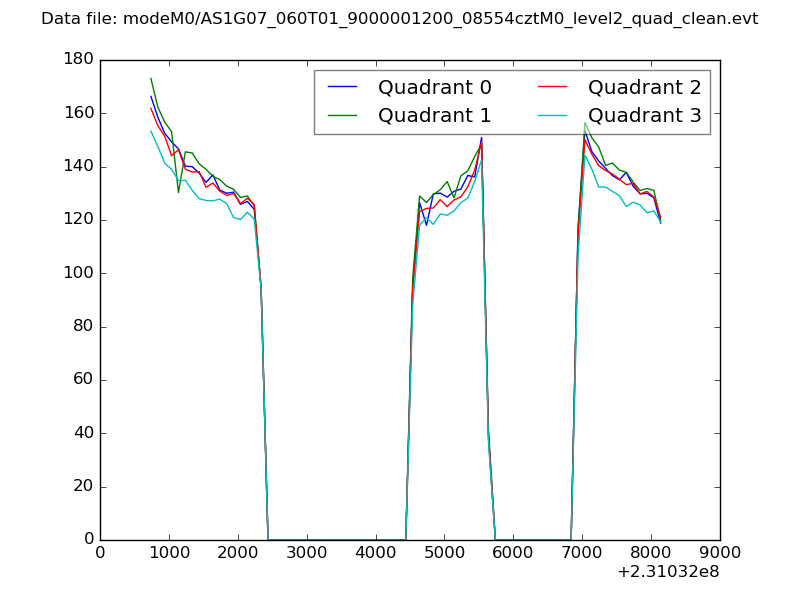 |
|
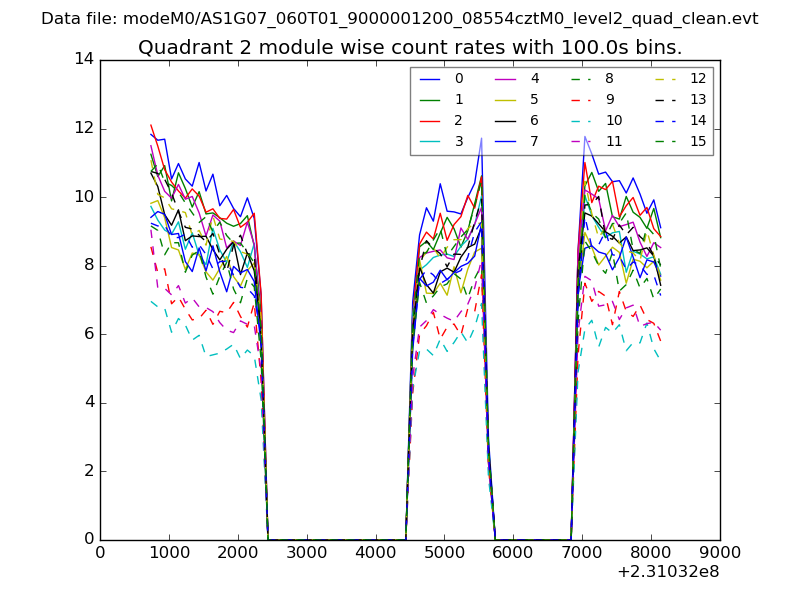
| Module-wise count rates for Quadrant A Data is divided into 100 sec bins |
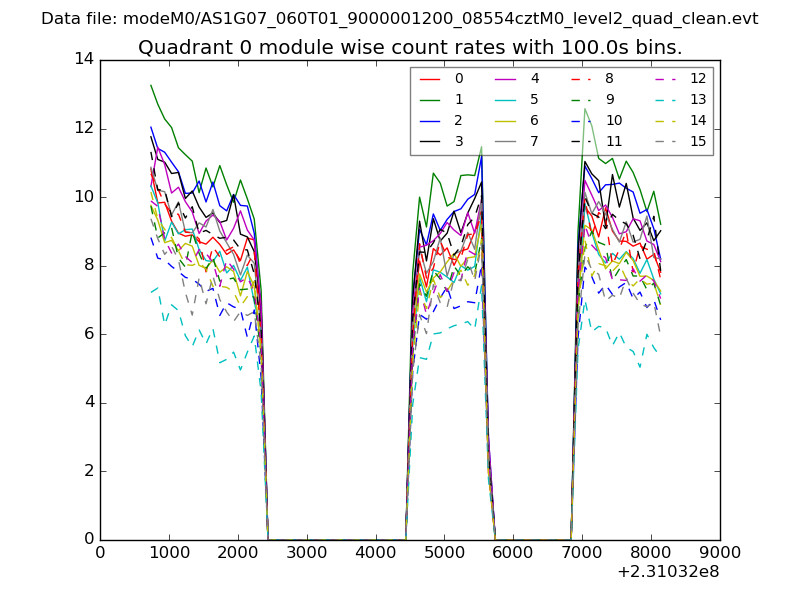 |
 |
| Module-wise count rates for Quadrant B Data is divided into 100 sec bins |
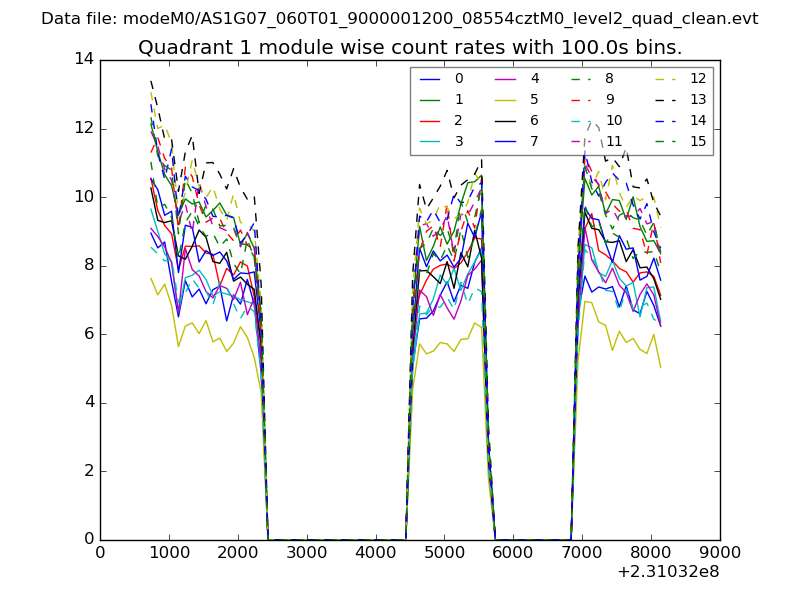 |
 |
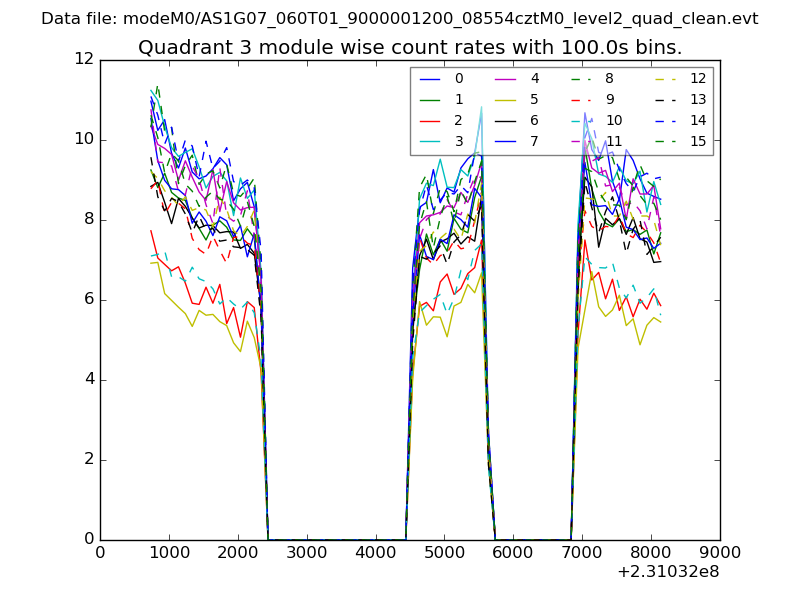
| Module-wise count rates for Quadrant C Data is divided into 100 sec bins |
 |
 |
| Module-wise count rates for Quadrant D Data is divided into 100 sec bins |
 |
 |
| Parameter | Plot |
|---|---|
| CZT HV Monitor | 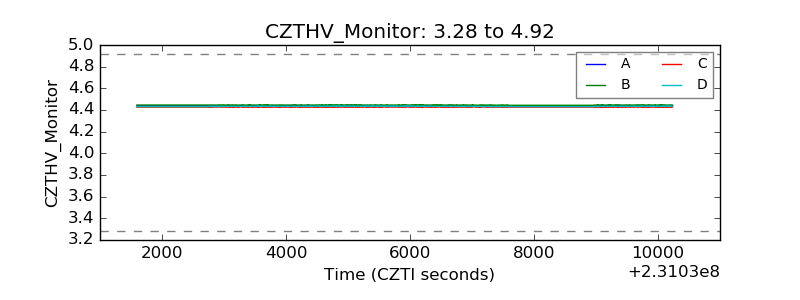 |
| D_VDD |  |
| Temperature 1 | 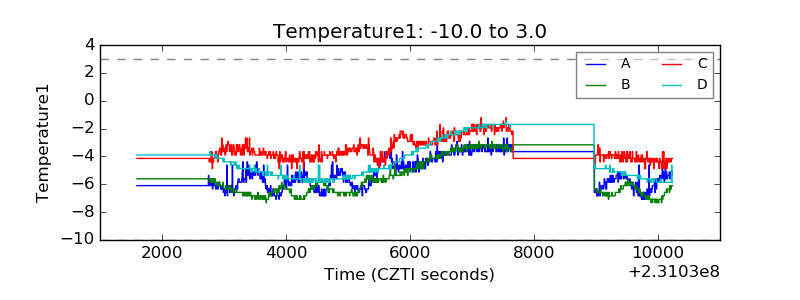 |
| Veto HV Monitor | 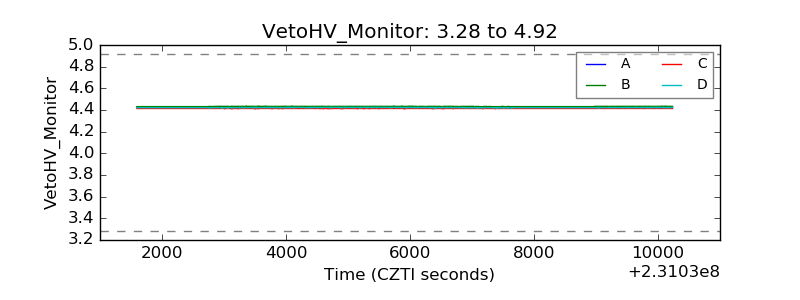 |
| Veto LLD | 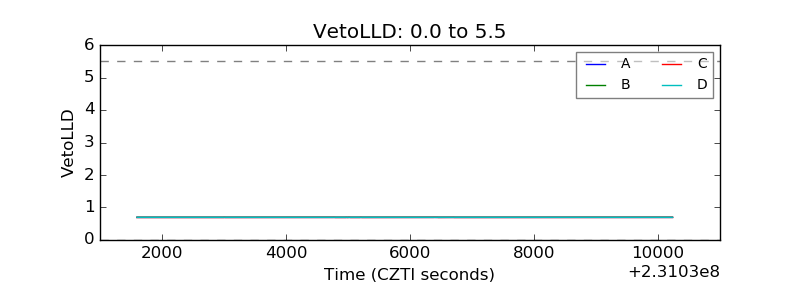 |
| Alpha Counter | 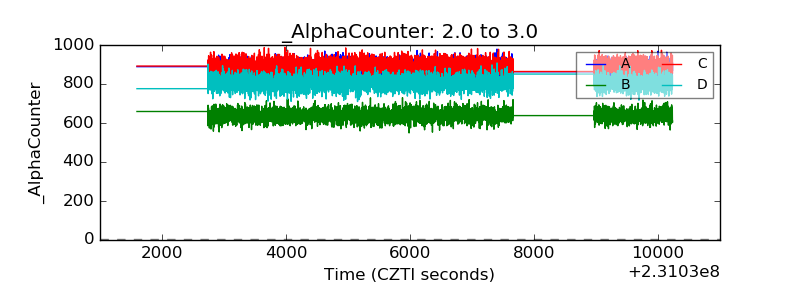 |
| _CPM_Rate | 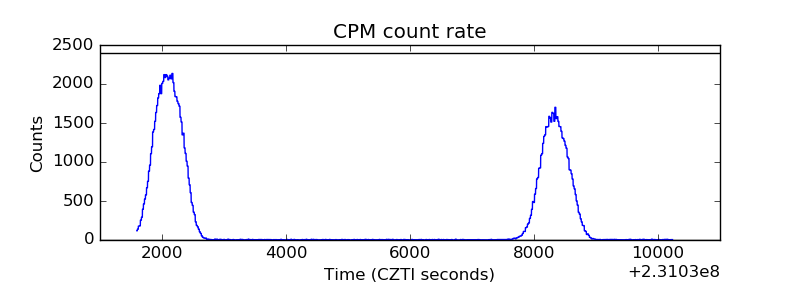 |
| CZT Counter | 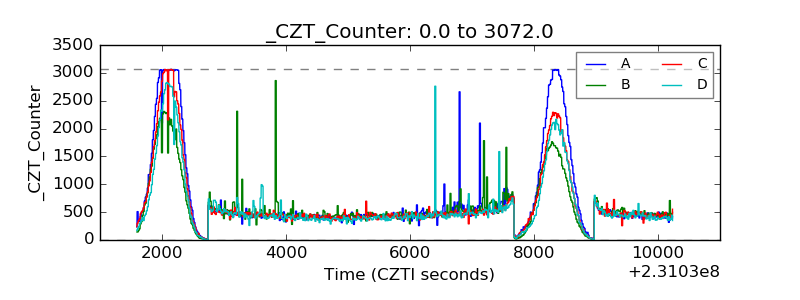 |
| +2.5 Volts monitor |  |
| +5 Volts monitor |  |
| _ROLL_ROT | 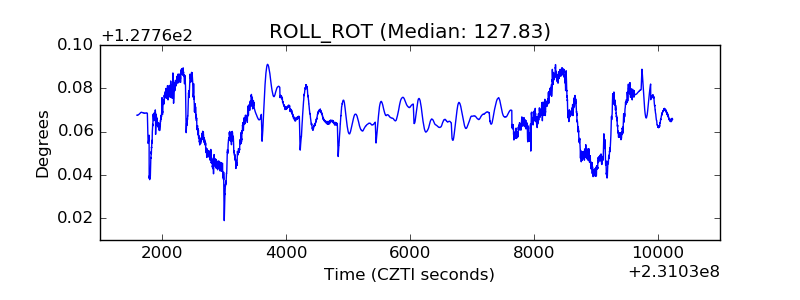 |
| _Roll_DEC | 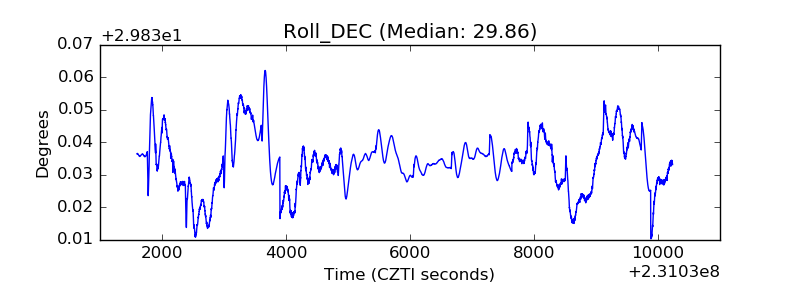 |
| _Roll_RA | 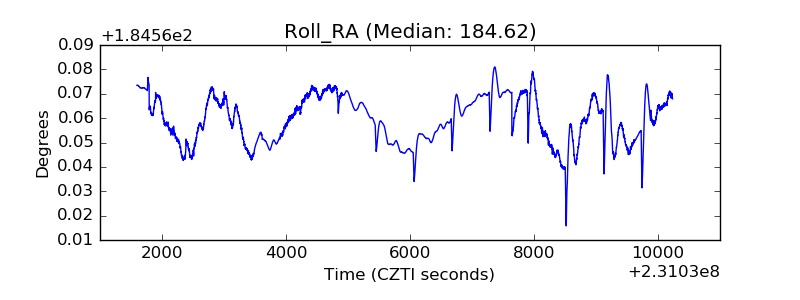 |
| Veto Counter | 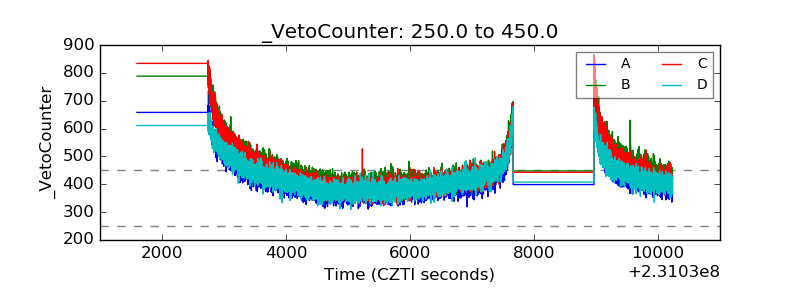 |