| Param | Original file | Final file |
|---|---|---|
| Filename | modeM0/AS1G07_060T01_9000001200_08555cztM0_level2.evt | modeM0/AS1G07_060T01_9000001200_08555cztM0_level2_quad_clean.evt |
| Size (bytes) | 558,849,600 | 81,420,480 |
| Size | 533.0 MB | 77.6 MB |
| Events in quadrant A | 3,096,499 | 533,471 |
| Events in quadrant B | 3,278,217 | 544,272 |
| Events in quadrant C | 3,003,306 | 530,638 |
| Events in quadrant D | 7,102,779 | 400,559 |
| Mode SS | |||
|---|---|---|---|
| Quadrant | BADHDUFLAG | Total packets | Discarded packets |
| A | 0 | 134 | 0 |
| B | 0 | 134 | 0 |
| C | 0 | 134 | 0 |
| D | 0 | 134 | 0 |
| Mode M0 | |||
|---|---|---|---|
| Quadrant | BADHDUFLAG | Total packets | Discarded packets |
| A | 0 | 13699 | 6 |
| B | 0 | 14035 | 2 |
| C | 0 | 13514 | 2 |
| D | 0 | 25828 | 2 |
| Mode M9 | |||
|---|---|---|---|
| Quadrant | BADHDUFLAG | Total packets | Discarded packets |
| A | 0 | 26 | 0 |
| B | 0 | 26 | 0 |
| C | 0 | 26 | 0 |
| D | 0 | 26 | 0 |
| Quadrant | Total seconds | Saturated seconds | Saturation percentage |
|---|---|---|---|
| A | 6540 | 21 | 0.321101% |
| B | 6541 | 57 | 0.871426% |
| C | 6541 | 16 | 0.244611% |
| D | 6541 | 1839 | 28.114967% |
Noise dominated data is calculated using 1-second bins in cleaned event files. If a bin has >2000 counts, and if more than 50% of those come from <1% of pixels, then it is considered to be noise-dominated and hence unusable.
| Quadrant | # 1 sec bins | Bins with >0 counts | Bins with >2000 counts | High rate bins dominated by noise | Noise dominated (total time) | Noise dominated (detector-on time) | Marked lightcurve |
|---|---|---|---|---|---|---|---|
| A | 9086 | 6543 | 3 | 3 | 0.03% | 0.05% | 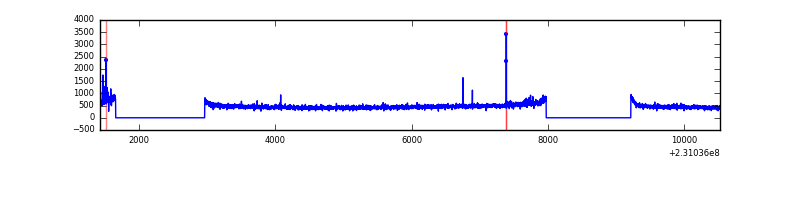 |
| B | 9086 | 6543 | 14 | 14 | 0.15% | 0.21% | 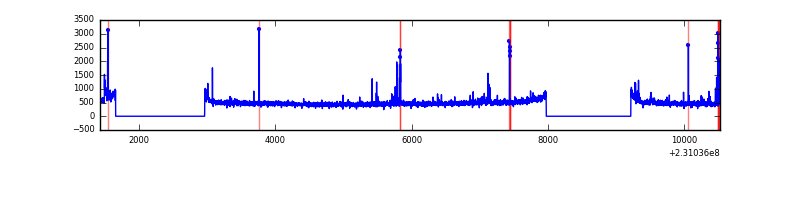 |
| C | 9086 | 6543 | 0 | 0 | 0.00% | 0.00% | 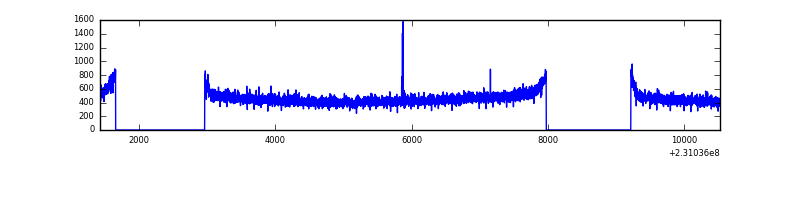 |
| D | 9085 | 6541 | 1615 | 1615 | 17.78% | 24.69% | 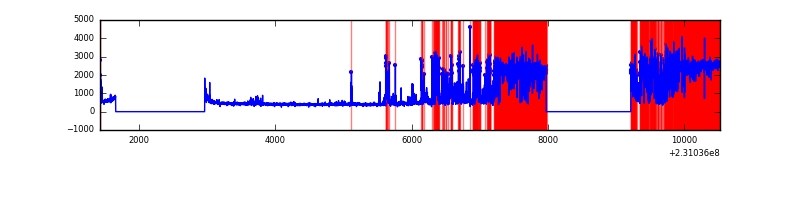 |
Top three noisy pixels from each quadrant. If the there are fewer than three noisy pixels in the level2.evt file, extra rows are filled as -1
| Pixel properties | Quadrant properties | ||||||
|---|---|---|---|---|---|---|---|
| Quadrant | DetID | PixID | Counts | Sigma | Mean | Median | Sigma |
| A | 15 | 223 | 38605 | 235.85 | 790 | 776 | 160.4 |
| A | 15 | 239 | 12983 | 76.11 | 790 | 776 | 160.4 |
| A | 0 | 226 | 7368 | 41.1 | 790 | 776 | 160.4 |
| B | 4 | 81 | 84008 | 556.88 | 795 | 777 | 149.5 |
| B | 10 | 16 | 37548 | 246.02 | 795 | 777 | 149.5 |
| B | 10 | 252 | 31669 | 206.69 | 795 | 777 | 149.5 |
| C | 14 | 234 | 7342 | 36.92 | 767 | 772 | 177.9 |
| C | 13 | 61 | 5729 | 27.86 | 767 | 772 | 177.9 |
| C | 8 | 222 | 3681 | 16.35 | 767 | 772 | 177.9 |
| D | 4 | 95 | 4614027 | 30093.3 | 625 | 608 | 153.3 |
| D | 12 | 233 | 47529 | 306.07 | 625 | 608 | 153.3 |
| D | 1 | 52 | 33841 | 216.78 | 625 | 608 | 153.3 |
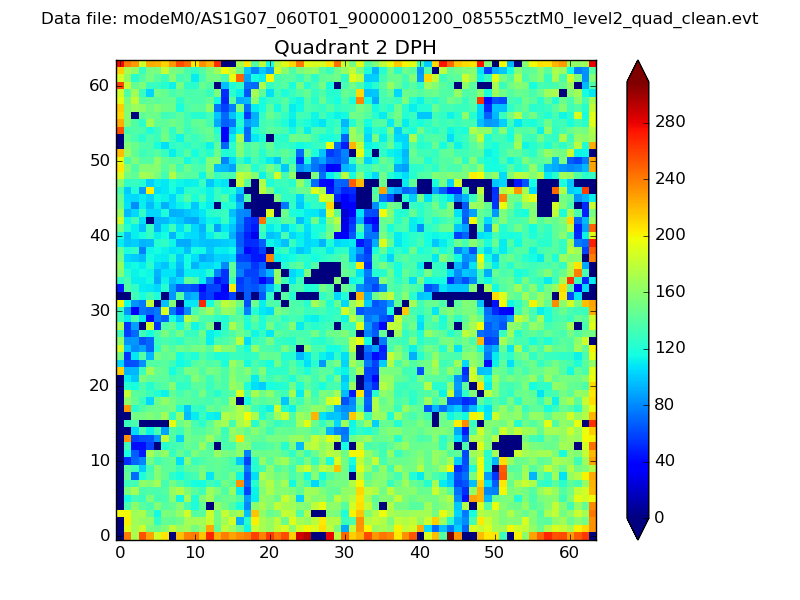
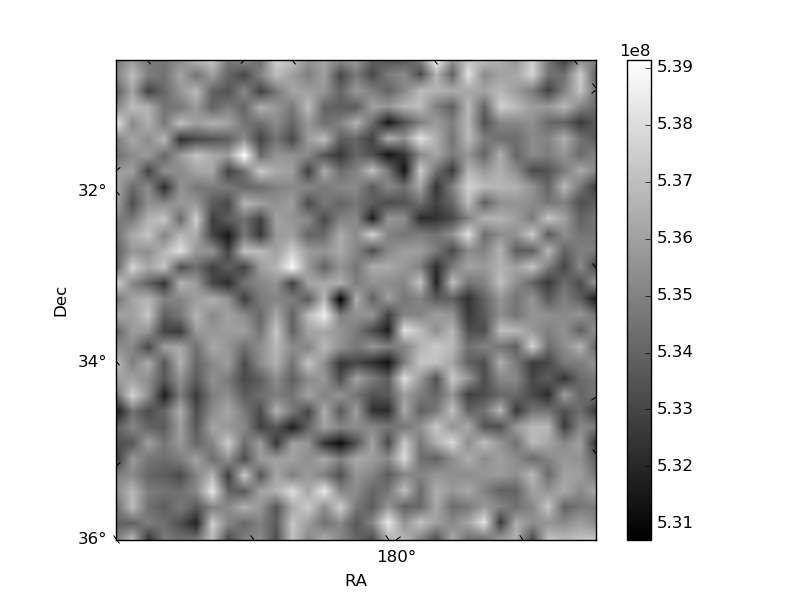
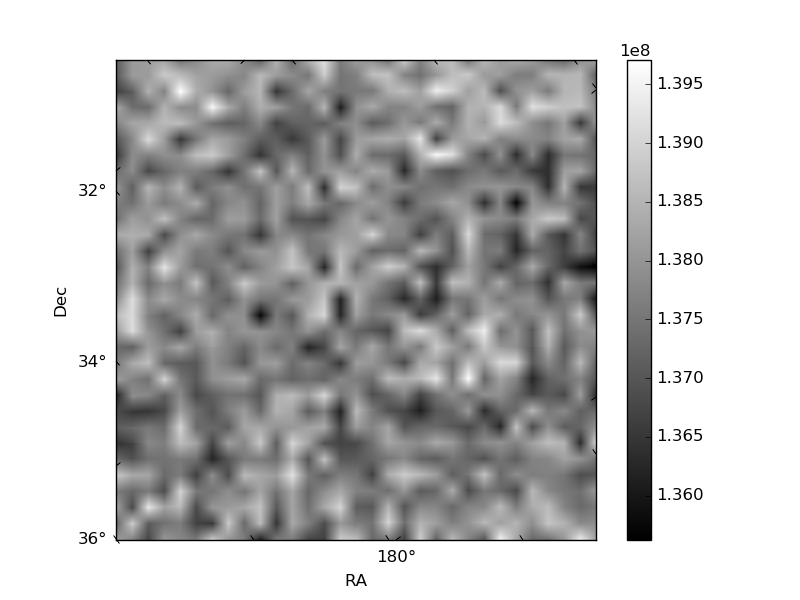
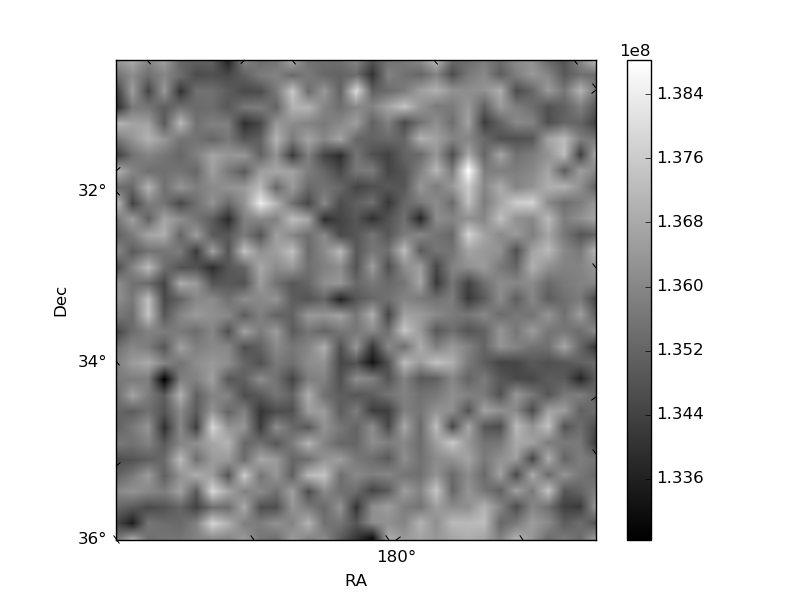
Histogram calculated using DETX and DETY for each event in the final _common_clean file
| Quadrant A | 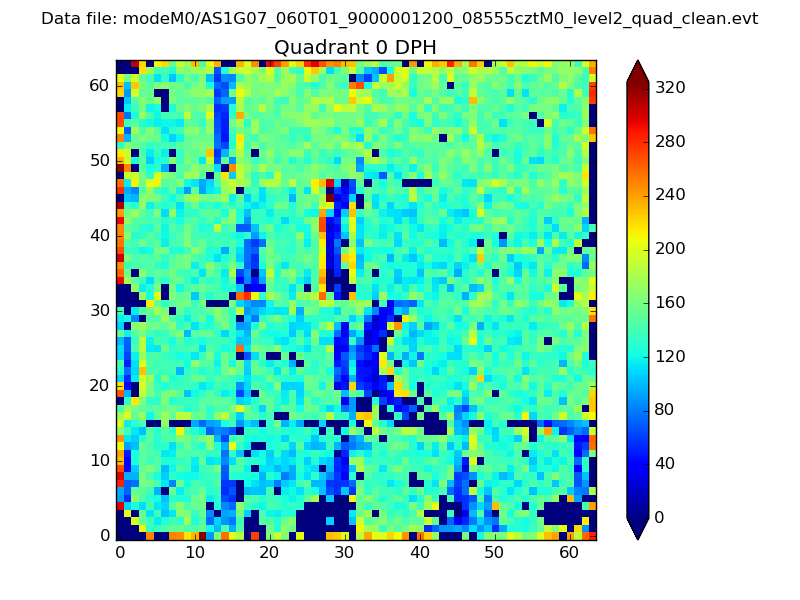 |
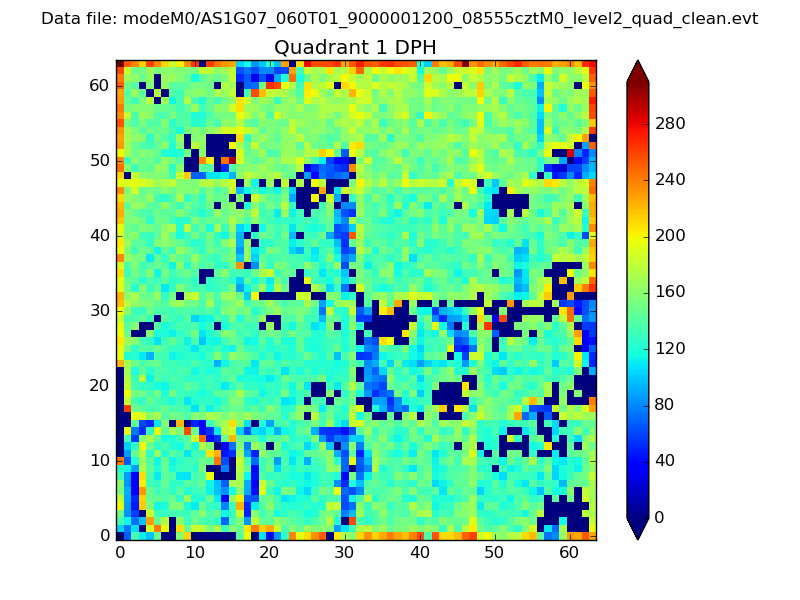 |
Quadrant B |
|---|---|---|---|
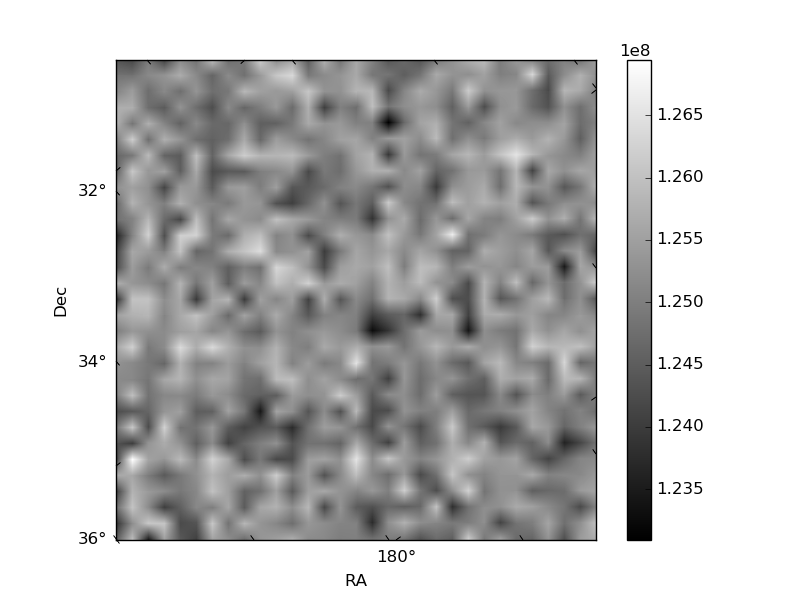
| Quadrant D | 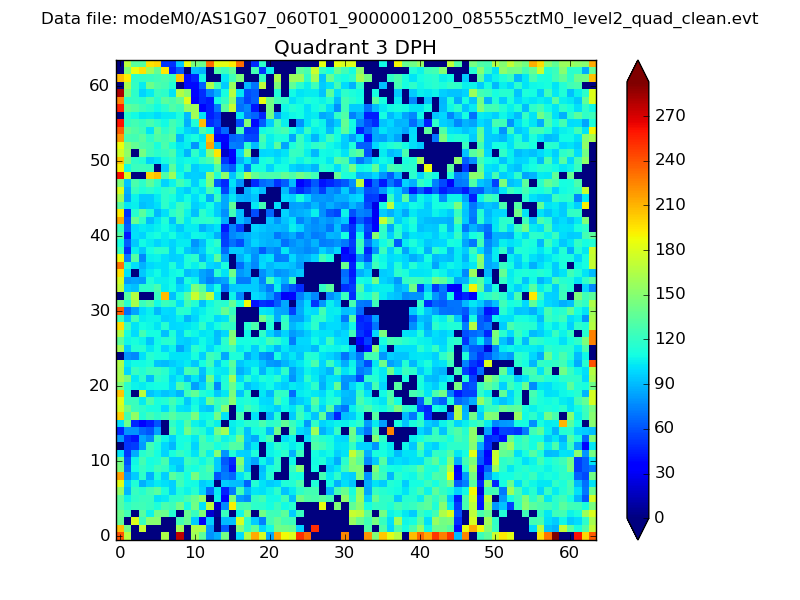 |
 |
Quadrant C |
| Plot type | Count rate plots | Images |
|---|---|---|
| Comparison with Poisson distribution Blue bars denote a histogram of data divided into 1 sec bins. Red curve is a Poisson curve with rate = median count rate of data. |
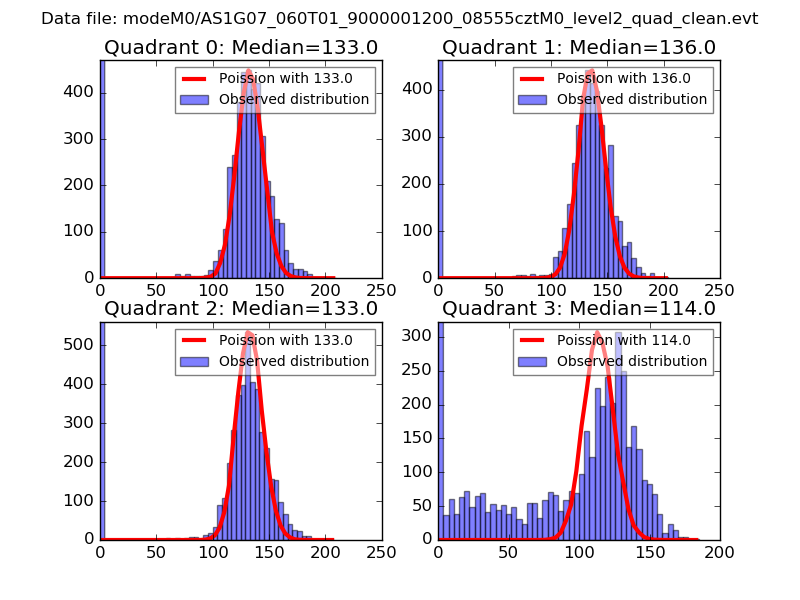 |
 |
| Quadrant-wise count rates Data is divided into 100 sec bins |
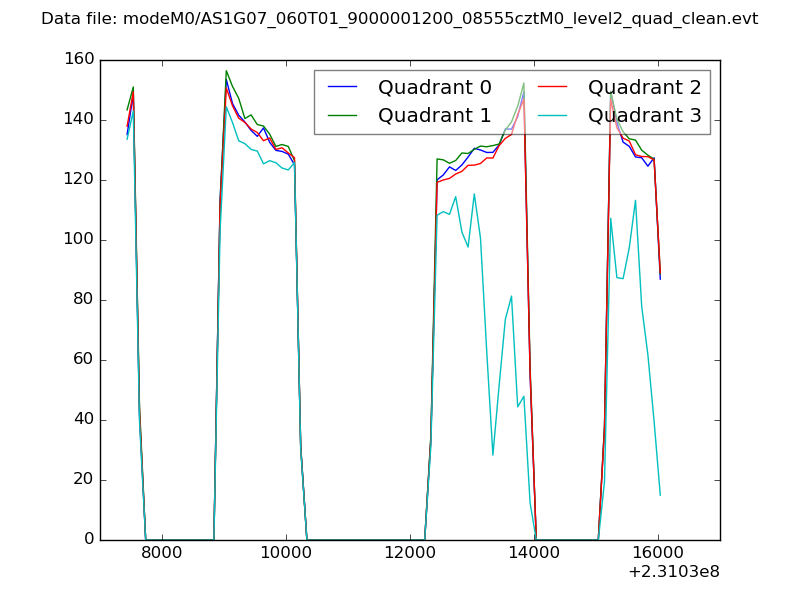 |
|
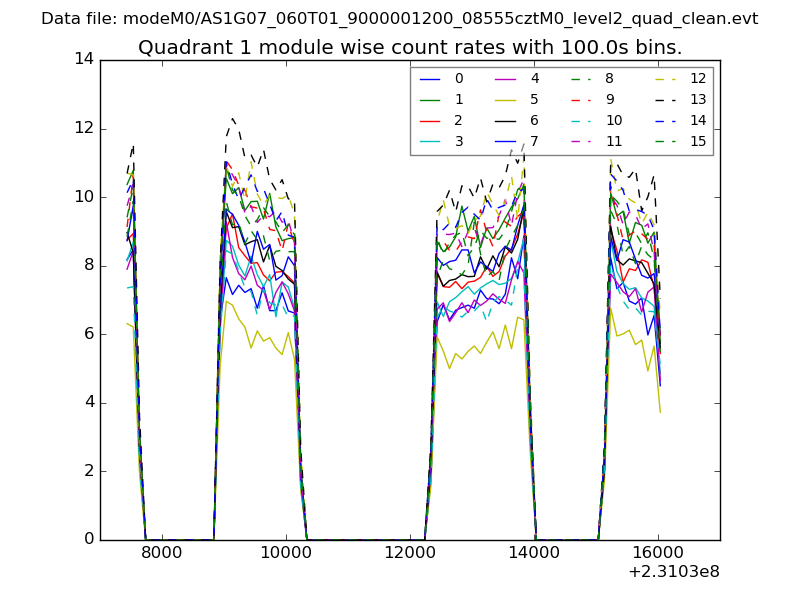
| Module-wise count rates for Quadrant A Data is divided into 100 sec bins |
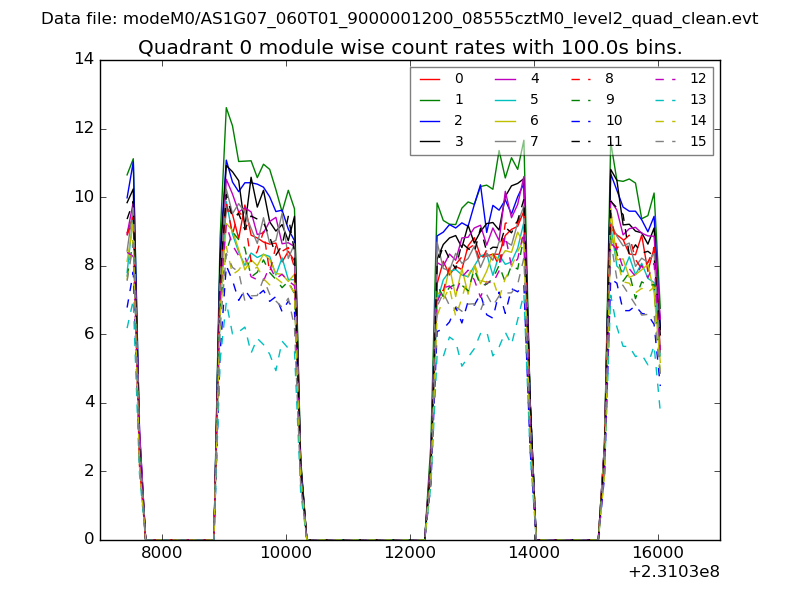 |
 |
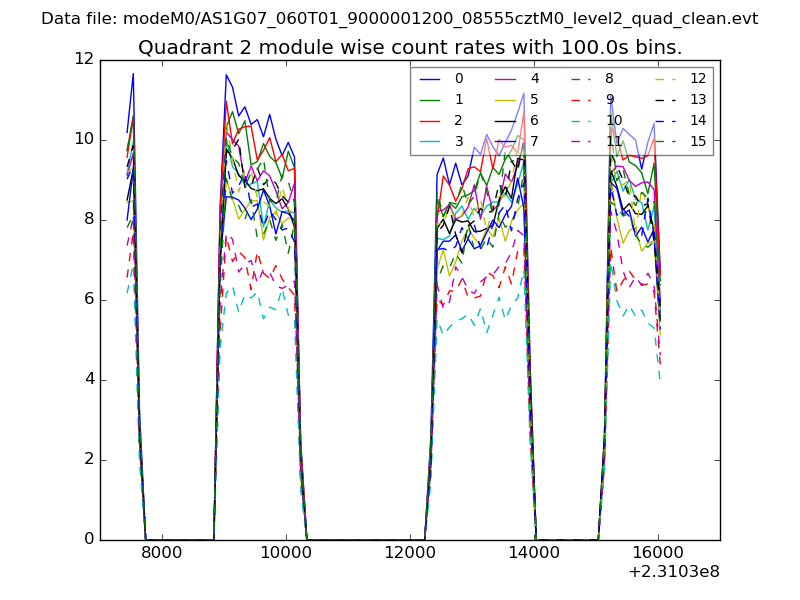
| Module-wise count rates for Quadrant B Data is divided into 100 sec bins |
 |
 |
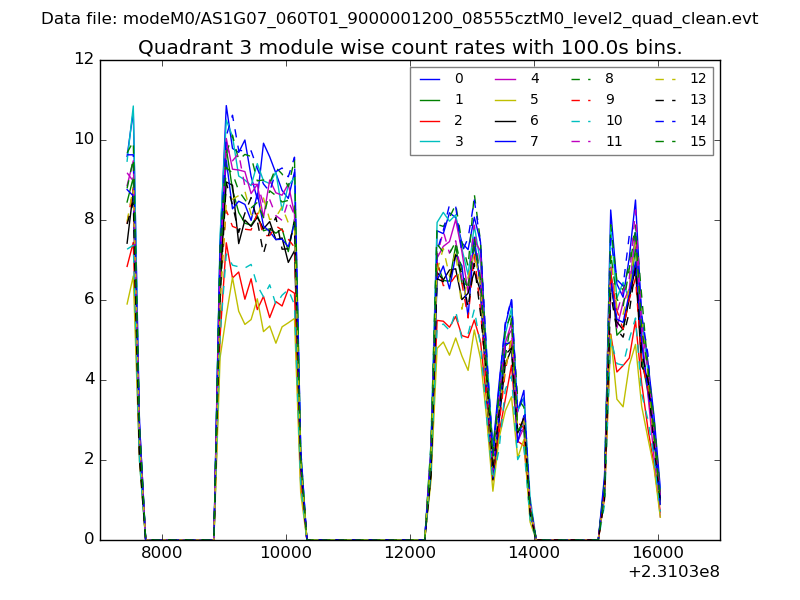
| Module-wise count rates for Quadrant C Data is divided into 100 sec bins |
 |
 |
| Module-wise count rates for Quadrant D Data is divided into 100 sec bins |
 |
 |
| Parameter | Plot |
|---|---|
| CZT HV Monitor | 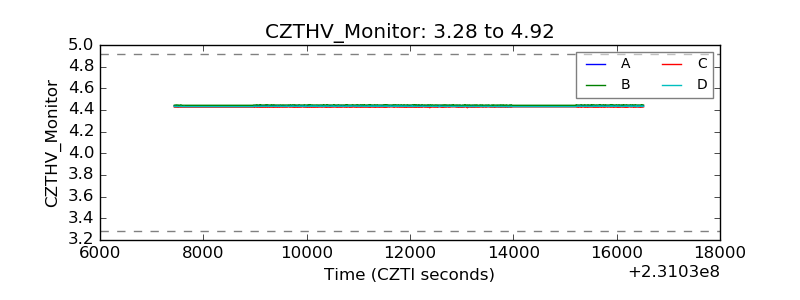 |
| D_VDD | 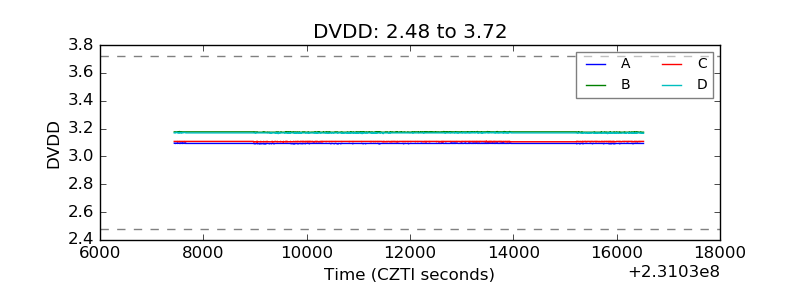 |
| Temperature 1 | 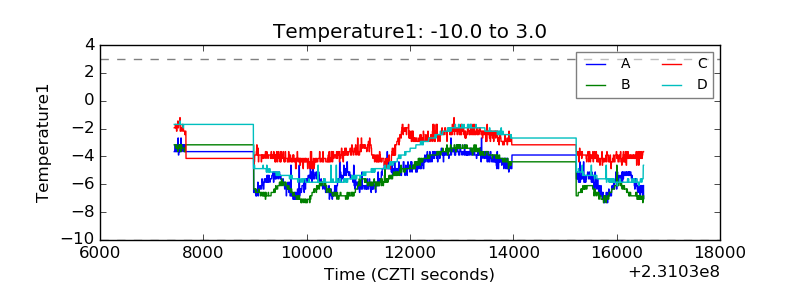 |
| Veto HV Monitor | 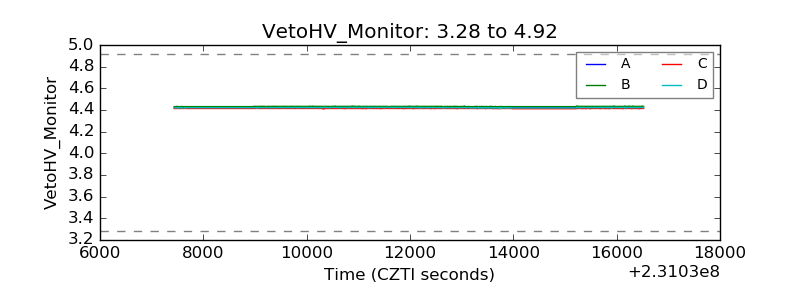 |
| Veto LLD | 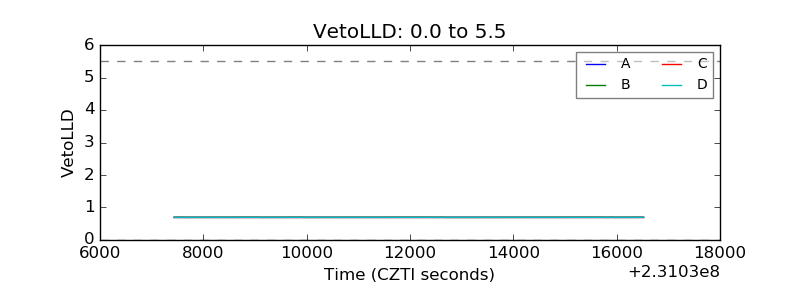 |
| Alpha Counter | 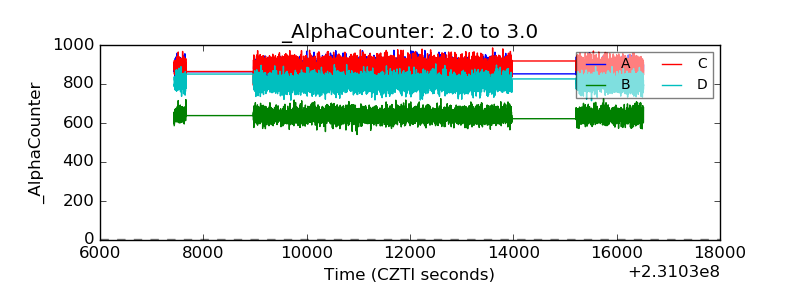 |
| _CPM_Rate | 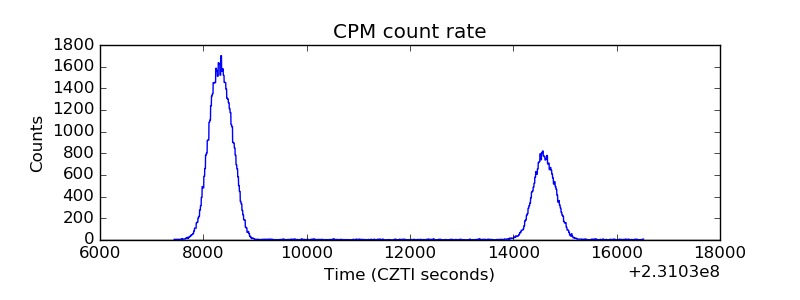 |
| CZT Counter | 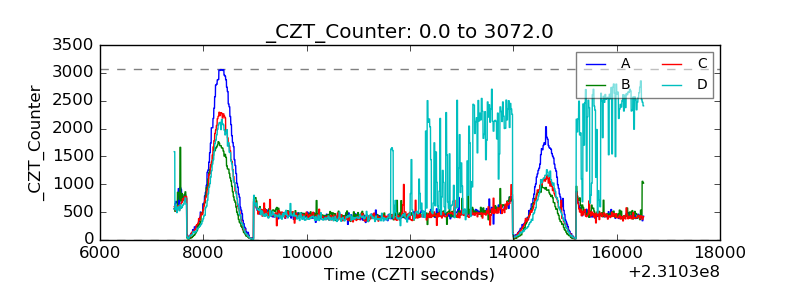 |
| +2.5 Volts monitor |  |
| +5 Volts monitor |  |
| _ROLL_ROT | 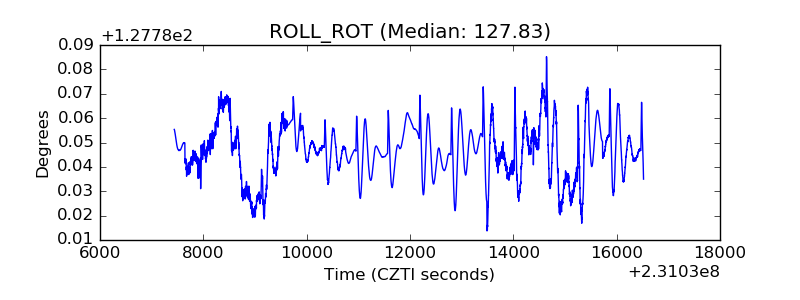 |
| _Roll_DEC |  |
| _Roll_RA | 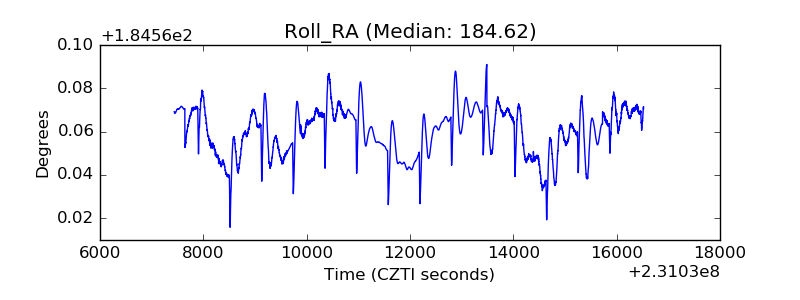 |
| Veto Counter | 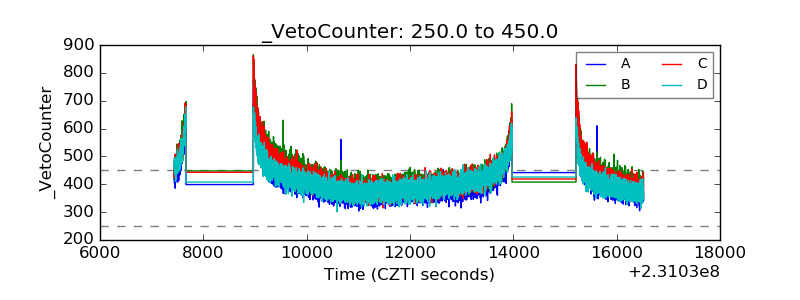 |