| Param | Original file | Final file |
|---|---|---|
| Filename | modeM0/AS1G07_060T01_9000001200_08556cztM0_level2.evt | modeM0/AS1G07_060T01_9000001200_08556cztM0_level2_quad_clean.evt |
| Size (bytes) | 767,828,160 | 70,862,400 |
| Size | 732.3 MB | 67.6 MB |
| Events in quadrant A | 3,084,096 | 480,608 |
| Events in quadrant B | 3,273,473 | 488,260 |
| Events in quadrant C | 3,040,612 | 478,391 |
| Events in quadrant D | 13,400,059 | 228,637 |
| Mode SS | |||
|---|---|---|---|
| Quadrant | BADHDUFLAG | Total packets | Discarded packets |
| A | 0 | 138 | 0 |
| B | 0 | 138 | 0 |
| C | 0 | 138 | 0 |
| D | 0 | 138 | 0 |
| Mode M0 | |||
|---|---|---|---|
| Quadrant | BADHDUFLAG | Total packets | Discarded packets |
| A | 0 | 13862 | 3 |
| B | 0 | 14255 | 2 |
| C | 0 | 13846 | 2 |
| D | 0 | 44493 | 2 |
| Mode M9 | |||
|---|---|---|---|
| Quadrant | BADHDUFLAG | Total packets | Discarded packets |
| A | 0 | 23 | 0 |
| B | 0 | 23 | 0 |
| C | 0 | 23 | 0 |
| D | 0 | 23 | 0 |
| Quadrant | Total seconds | Saturated seconds | Saturation percentage |
|---|---|---|---|
| A | 6720 | 28 | 0.416667% |
| B | 6720 | 65 | 0.967262% |
| C | 6720 | 16 | 0.238095% |
| D | 6720 | 4688 | 69.761905% |
Noise dominated data is calculated using 1-second bins in cleaned event files. If a bin has >2000 counts, and if more than 50% of those come from <1% of pixels, then it is considered to be noise-dominated and hence unusable.
| Quadrant | # 1 sec bins | Bins with >0 counts | Bins with >2000 counts | High rate bins dominated by noise | Noise dominated (total time) | Noise dominated (detector-on time) | Marked lightcurve |
|---|---|---|---|---|---|---|---|
| A | 8980 | 6722 | 0 | 0 | 0.00% | 0.00% | 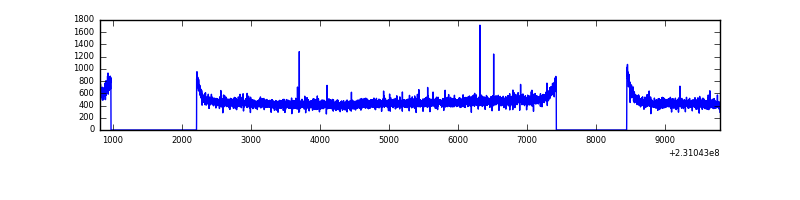 |
| B | 8980 | 6722 | 15 | 15 | 0.17% | 0.22% | 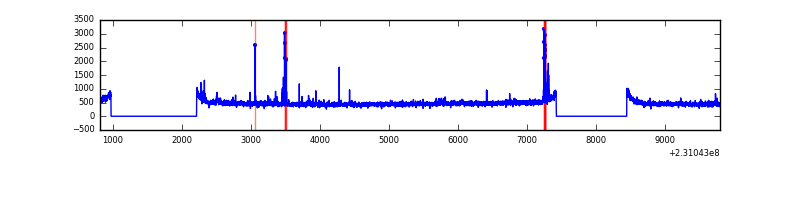 |
| C | 8980 | 6722 | 0 | 0 | 0.00% | 0.00% | 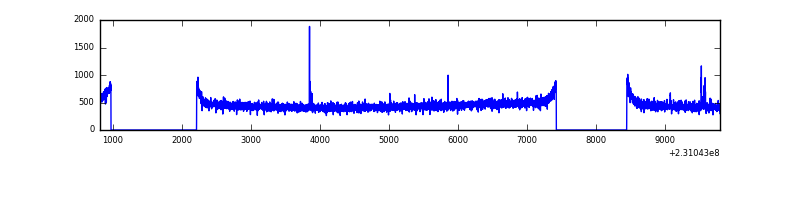 |
| D | 8980 | 6720 | 4398 | 4398 | 48.98% | 65.45% | 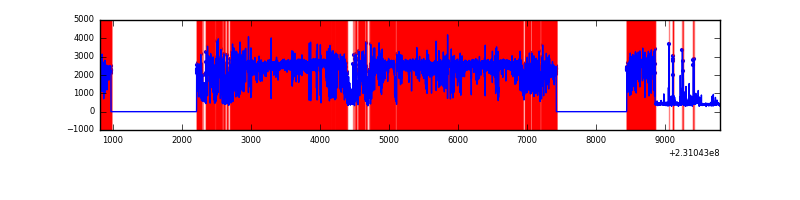 |
Top three noisy pixels from each quadrant. If the there are fewer than three noisy pixels in the level2.evt file, extra rows are filled as -1
| Pixel properties | Quadrant properties | ||||||
|---|---|---|---|---|---|---|---|
| Quadrant | DetID | PixID | Counts | Sigma | Mean | Median | Sigma |
| A | 0 | 226 | 7460 | 41.09 | 798 | 780 | 162.6 |
| A | 12 | 194 | 7001 | 38.27 | 798 | 780 | 162.6 |
| A | 5 | 16 | 3967 | 19.6 | 798 | 780 | 162.6 |
| B | 4 | 81 | 67415 | 430.83 | 803 | 785 | 154.7 |
| B | 0 | 245 | 43076 | 273.46 | 803 | 785 | 154.7 |
| B | 10 | 252 | 24213 | 151.49 | 803 | 785 | 154.7 |
| C | 9 | 54 | 19487 | 103.85 | 774 | 779 | 180.2 |
| C | 13 | 61 | 5878 | 28.3 | 774 | 779 | 180.2 |
| C | 8 | 222 | 2877 | 11.65 | 774 | 779 | 180.2 |
| D | 4 | 95 | 11567138 | 100786.29 | 457 | 445 | 114.8 |
| D | 1 | 52 | 31980 | 274.78 | 457 | 445 | 114.8 |
| D | 2 | 14 | 18848 | 160.35 | 457 | 445 | 114.8 |
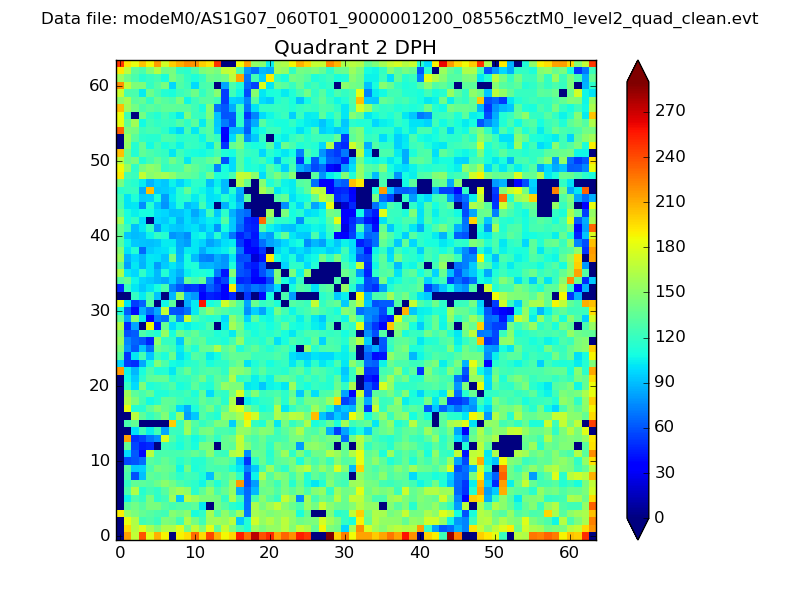
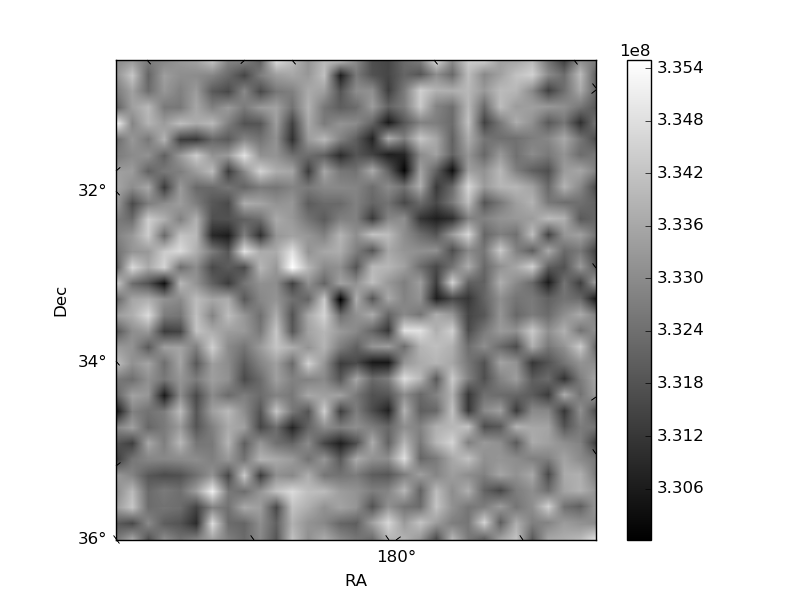
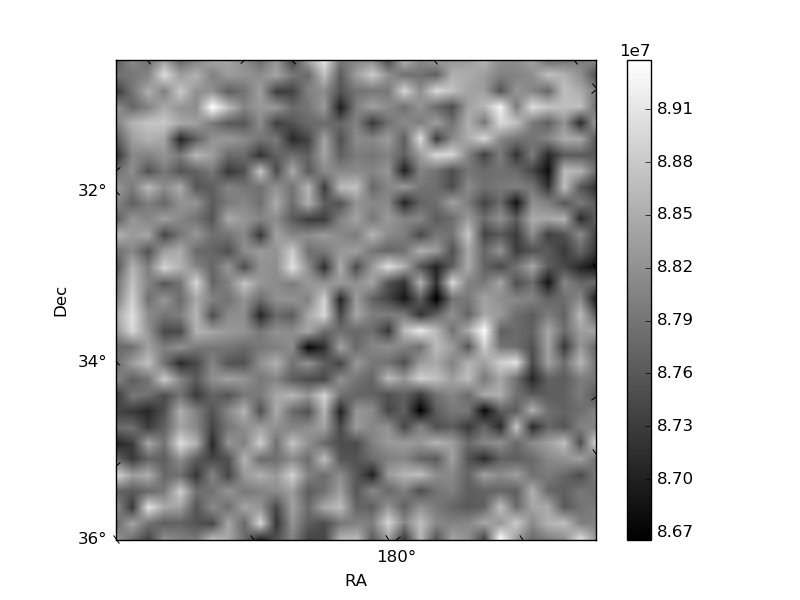
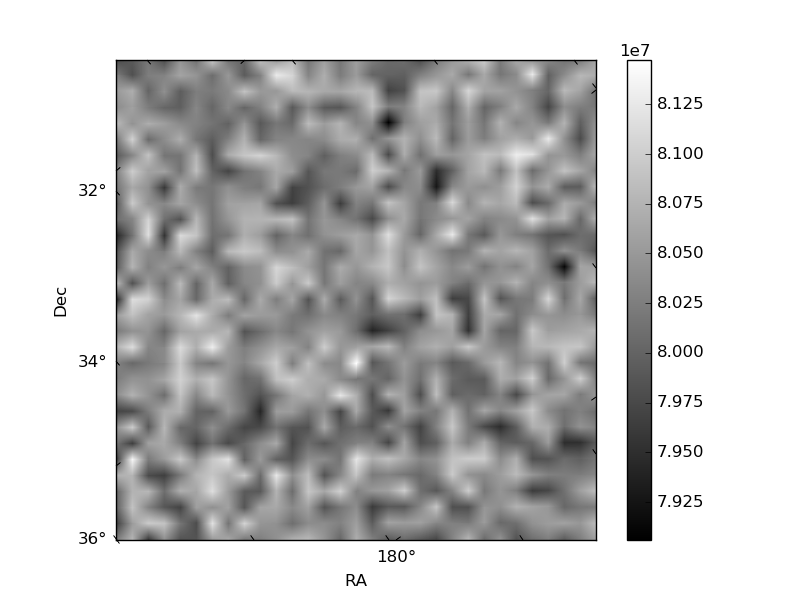
Histogram calculated using DETX and DETY for each event in the final _common_clean file
| Quadrant A | 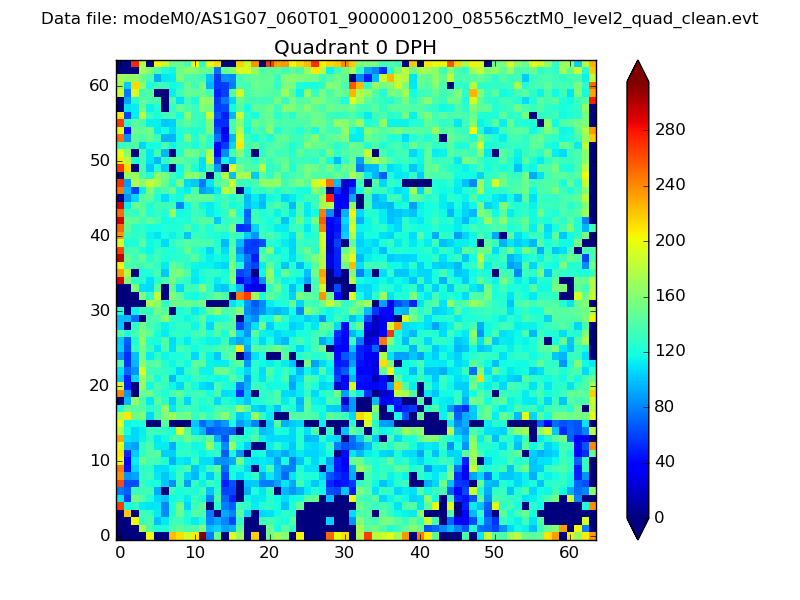 |
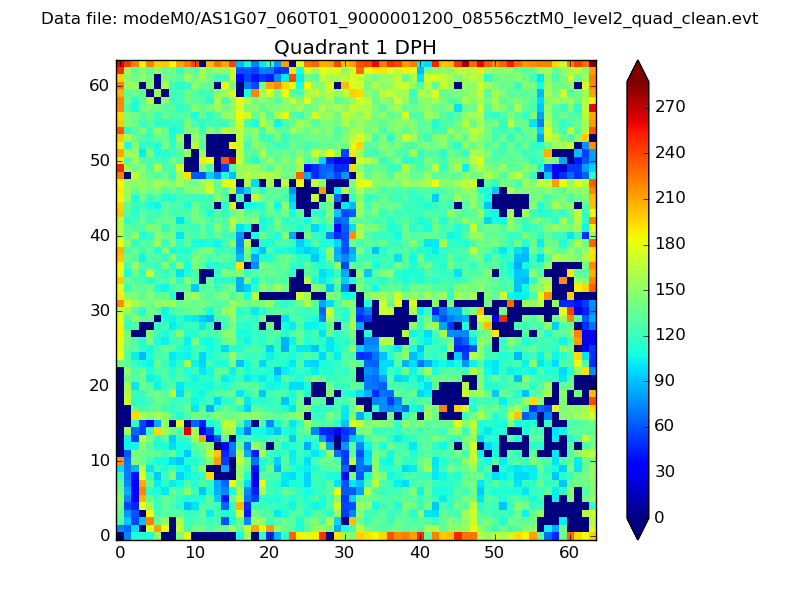 |
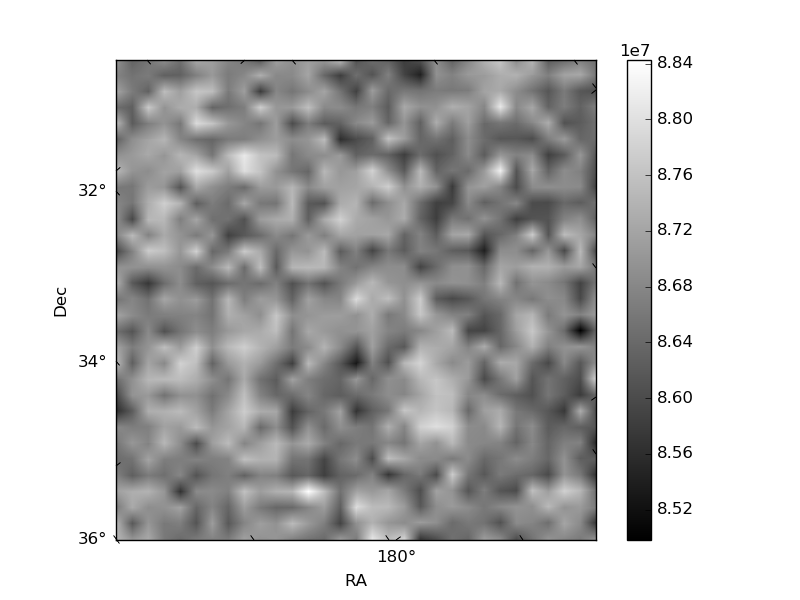
Quadrant B |
|---|---|---|---|
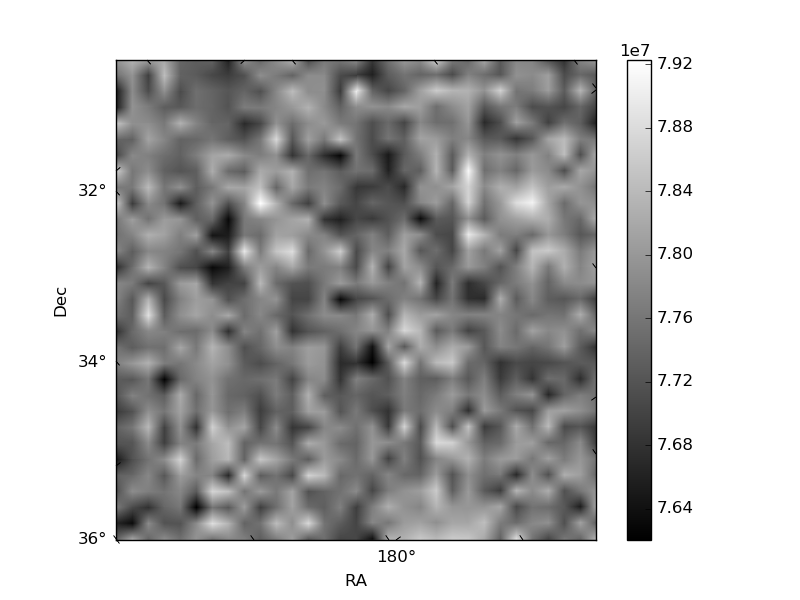
| Quadrant D | 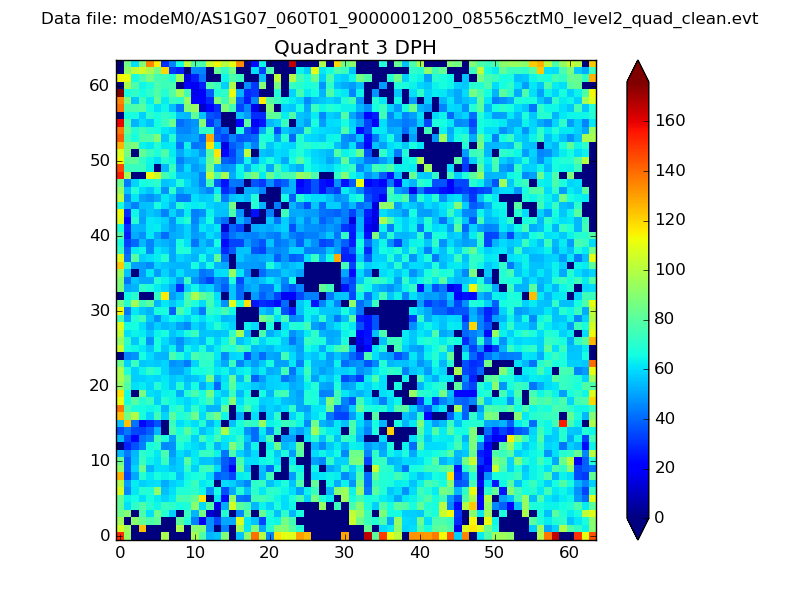 |
 |
Quadrant C |
| Plot type | Count rate plots | Images |
|---|---|---|
| Comparison with Poisson distribution Blue bars denote a histogram of data divided into 1 sec bins. Red curve is a Poisson curve with rate = median count rate of data. |
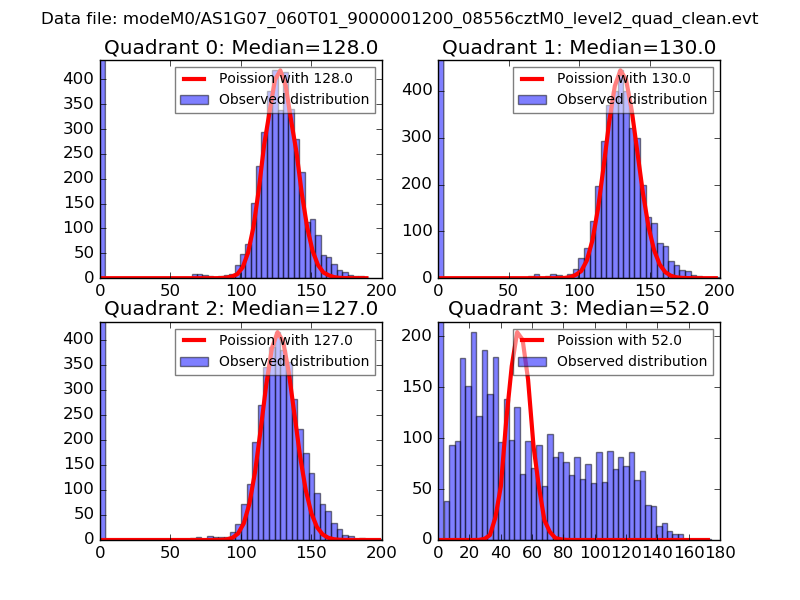 |
 |
| Quadrant-wise count rates Data is divided into 100 sec bins |
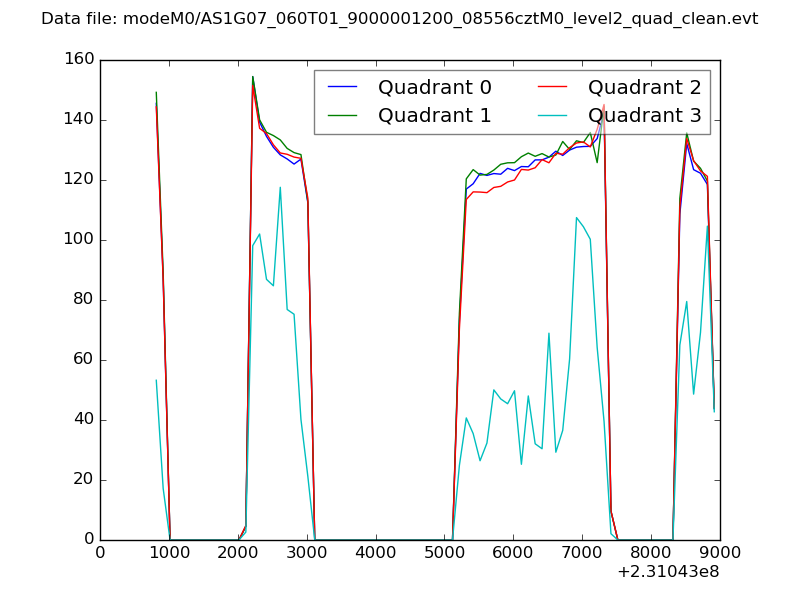 |
|
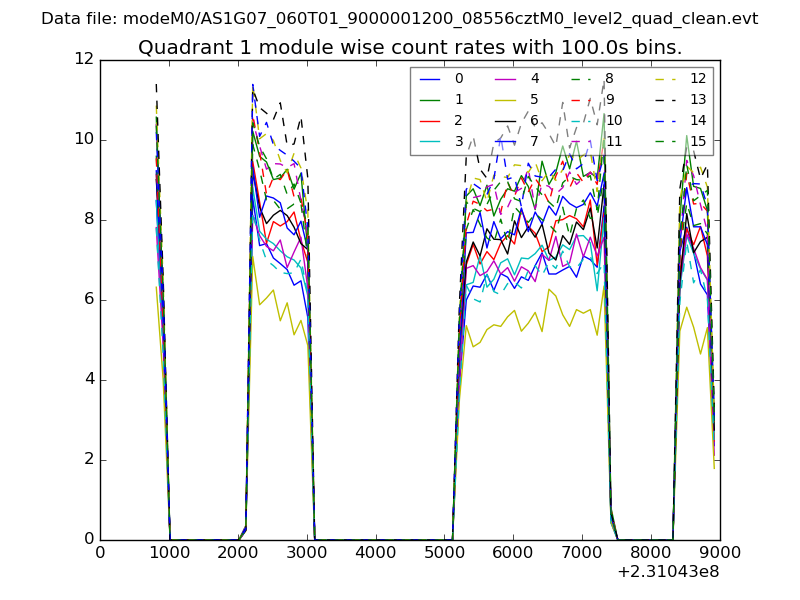
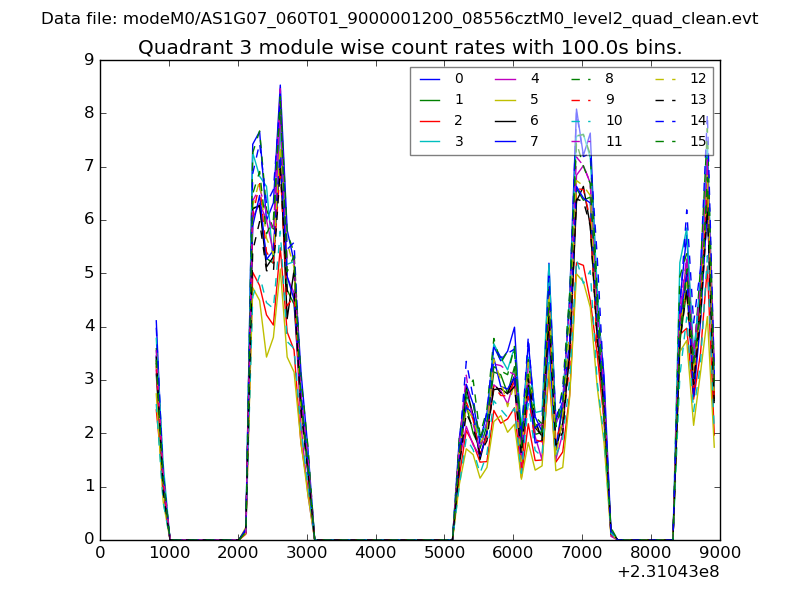
| Module-wise count rates for Quadrant A Data is divided into 100 sec bins |
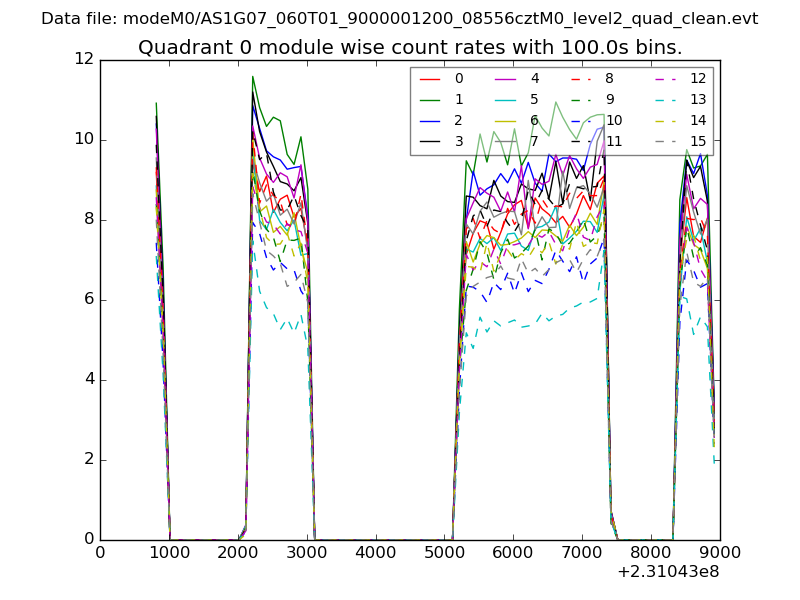 |
 |
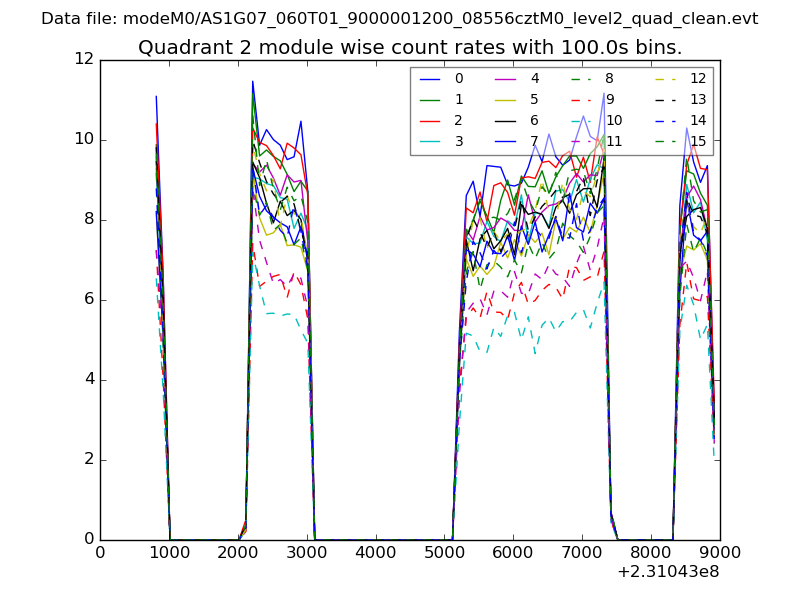
| Module-wise count rates for Quadrant B Data is divided into 100 sec bins |
 |
 |
| Module-wise count rates for Quadrant C Data is divided into 100 sec bins |
 |
 |
| Module-wise count rates for Quadrant D Data is divided into 100 sec bins |
 |
 |
| Parameter | Plot |
|---|---|
| CZT HV Monitor | 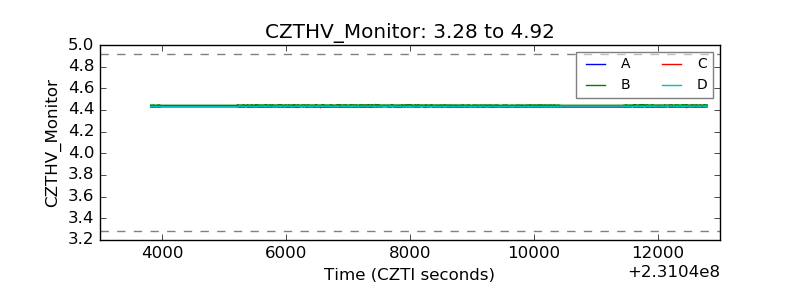 |
| D_VDD | 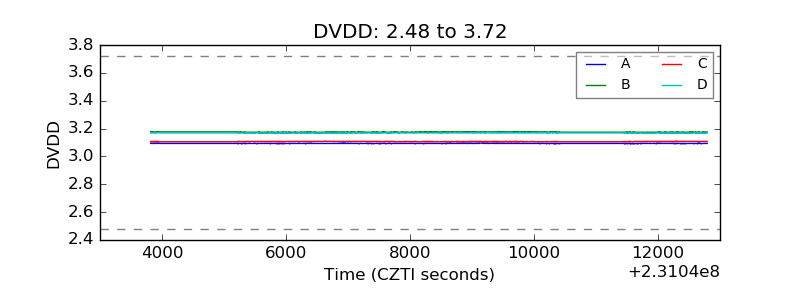 |
| Temperature 1 | 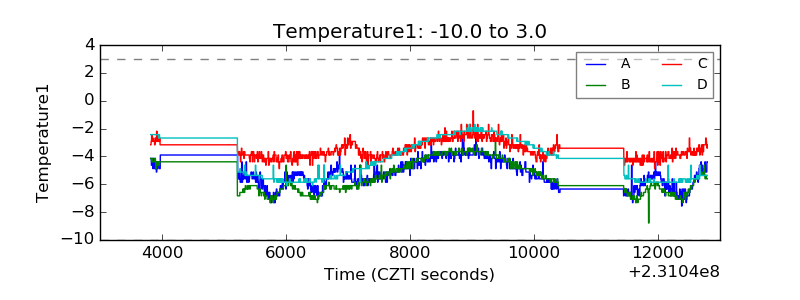 |
| Veto HV Monitor |  |
| Veto LLD | 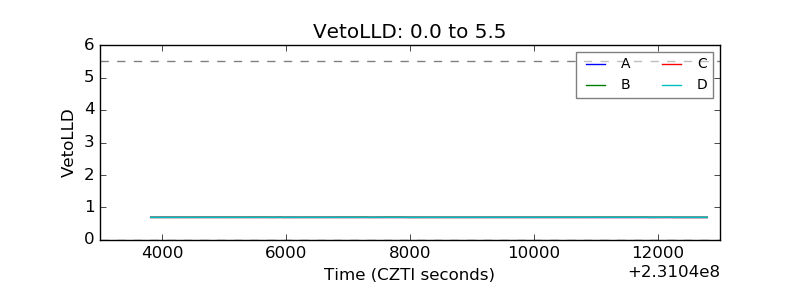 |
| Alpha Counter | 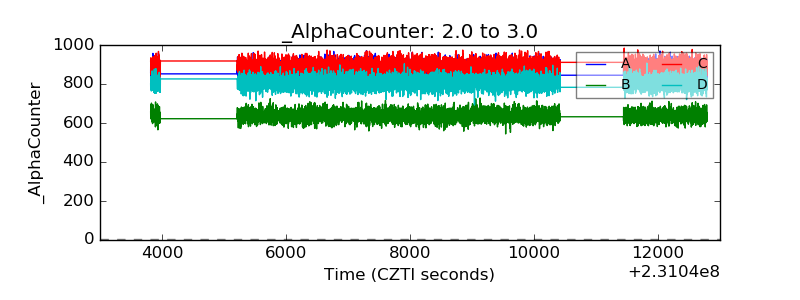 |
| _CPM_Rate | 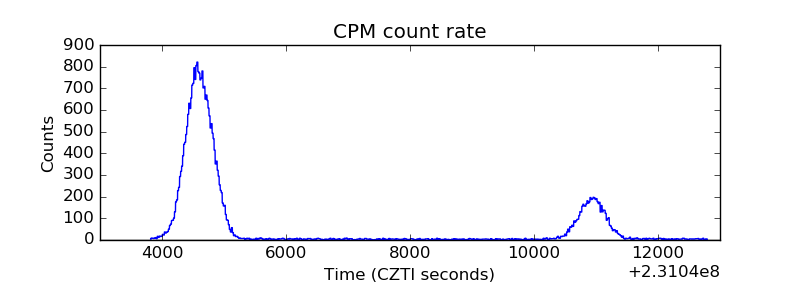 |
| CZT Counter | 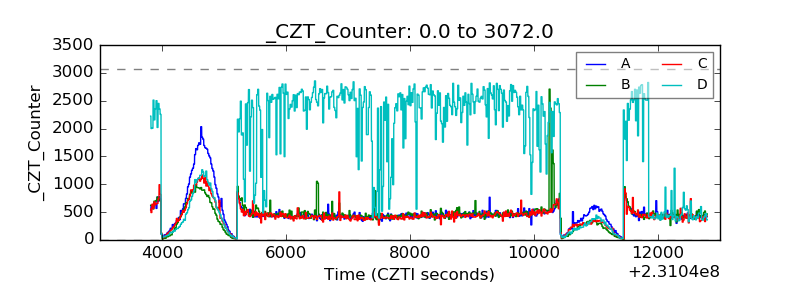 |
| +2.5 Volts monitor |  |
| +5 Volts monitor |  |
| _ROLL_ROT |  |
| _Roll_DEC | 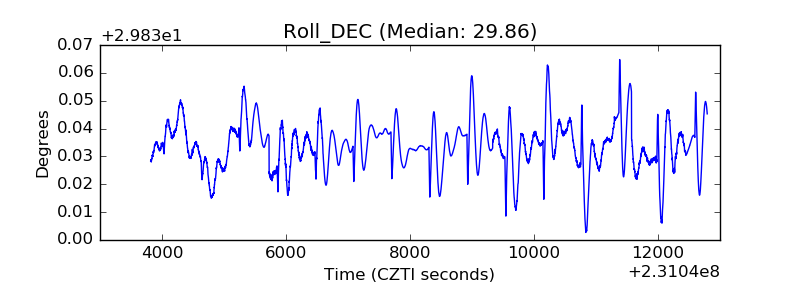 |
| _Roll_RA | 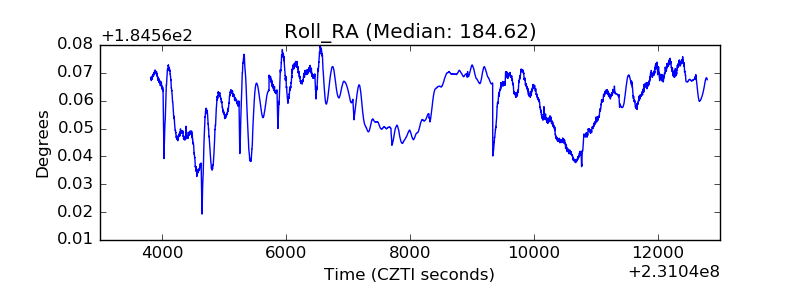 |
| Veto Counter | 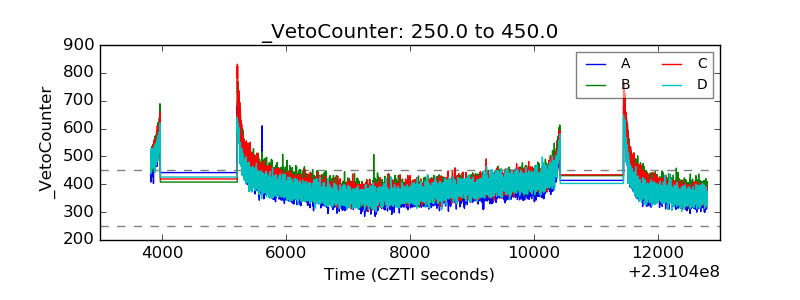 |