| Param | Original file | Final file |
|---|---|---|
| Filename | modeM0/AS1G07_060T01_9000001200_08557cztM0_level2.evt | modeM0/AS1G07_060T01_9000001200_08557cztM0_level2_quad_clean.evt |
| Size (bytes) | 3,090,176,640 | 483,569,280 |
| Size | 2.9 GB | 461.2 MB |
| Events in quadrant A | 19,475,357 | 3,029,414 |
| Events in quadrant B | 20,380,149 | 3,083,623 |
| Events in quadrant C | 18,727,530 | 3,022,560 |
| Events in quadrant D | 32,165,566 | 2,624,087 |
| Mode SS | |||
|---|---|---|---|
| Quadrant | BADHDUFLAG | Total packets | Discarded packets |
| A | 0 | 854 | 0 |
| B | 0 | 854 | 0 |
| C | 0 | 854 | 0 |
| D | 0 | 854 | 0 |
| Mode M0 | |||
|---|---|---|---|
| Quadrant | BADHDUFLAG | Total packets | Discarded packets |
| A | 0 | 87587 | 21 |
| B | 0 | 89112 | 12 |
| C | 0 | 85864 | 16 |
| D | 0 | 126612 | 24 |
| Mode M9 | |||
|---|---|---|---|
| Quadrant | BADHDUFLAG | Total packets | Discarded packets |
| A | 0 | 88 | 0 |
| B | 0 | 88 | 0 |
| C | 0 | 88 | 0 |
| D | 0 | 88 | 0 |
| Quadrant | Total seconds | Saturated seconds | Saturation percentage |
|---|---|---|---|
| A | 42028 | 323 | 0.768535% |
| B | 42032 | 489 | 1.163399% |
| C | 42030 | 150 | 0.356888% |
| D | 42026 | 5835 | 13.884262% |
Noise dominated data is calculated using 1-second bins in cleaned event files. If a bin has >2000 counts, and if more than 50% of those come from <1% of pixels, then it is considered to be noise-dominated and hence unusable.
| Quadrant | # 1 sec bins | Bins with >0 counts | Bins with >2000 counts | High rate bins dominated by noise | Noise dominated (total time) | Noise dominated (detector-on time) | Marked lightcurve |
|---|---|---|---|---|---|---|---|
| A | 50764 | 42040 | 48 | 48 | 0.09% | 0.11% | 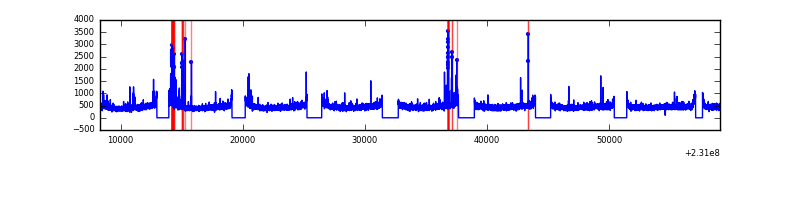 |
| B | 50764 | 42041 | 176 | 176 | 0.35% | 0.42% | 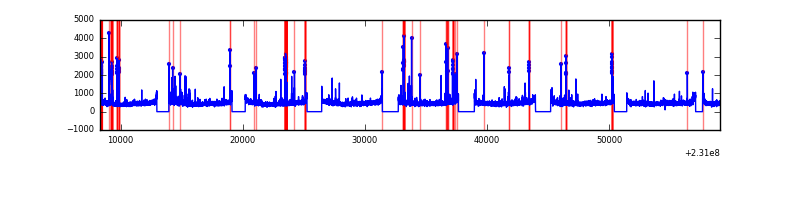 |
| C | 50764 | 42039 | 0 | 0 | 0.00% | 0.00% |  |
| D | 50764 | 42036 | 5258 | 5258 | 10.36% | 12.51% | 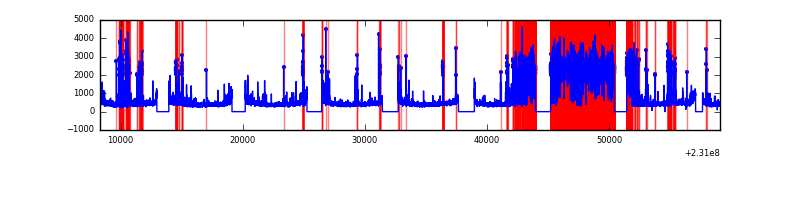 |
Top three noisy pixels from each quadrant. If the there are fewer than three noisy pixels in the level2.evt file, extra rows are filled as -1
| Pixel properties | Quadrant properties | ||||||
|---|---|---|---|---|---|---|---|
| Quadrant | DetID | PixID | Counts | Sigma | Mean | Median | Sigma |
| A | 15 | 223 | 382728 | 384.07 | 4911 | 4812 | 984.0 |
| A | 15 | 239 | 129690 | 126.91 | 4911 | 4812 | 984.0 |
| A | 0 | 226 | 45617 | 41.47 | 4911 | 4812 | 984.0 |
| B | 10 | 16 | 693347 | 738.69 | 4939 | 4819 | 932.1 |
| B | 0 | 214 | 172795 | 180.21 | 4939 | 4819 | 932.1 |
| B | 4 | 81 | 126228 | 130.25 | 4939 | 4819 | 932.1 |
| C | 9 | 54 | 40725 | 32.51 | 4785 | 4809 | 1104.9 |
| C | 13 | 61 | 36222 | 28.43 | 4785 | 4809 | 1104.9 |
| C | 8 | 222 | 23716 | 17.11 | 4785 | 4809 | 1104.9 |
| D | 4 | 95 | 13937671 | 13109.69 | 4361 | 4256 | 1062.8 |
| D | 1 | 52 | 883713 | 827.46 | 4361 | 4256 | 1062.8 |
| D | 7 | 71 | 214488 | 197.8 | 4361 | 4256 | 1062.8 |
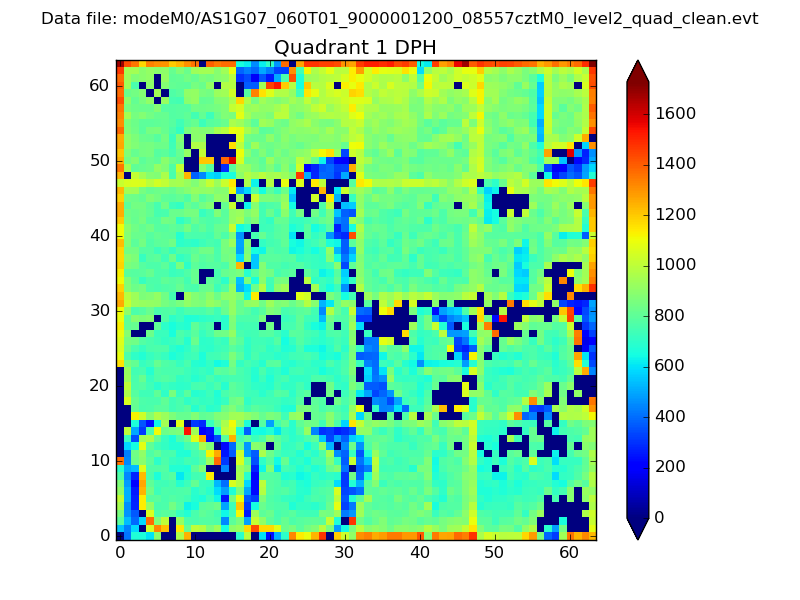
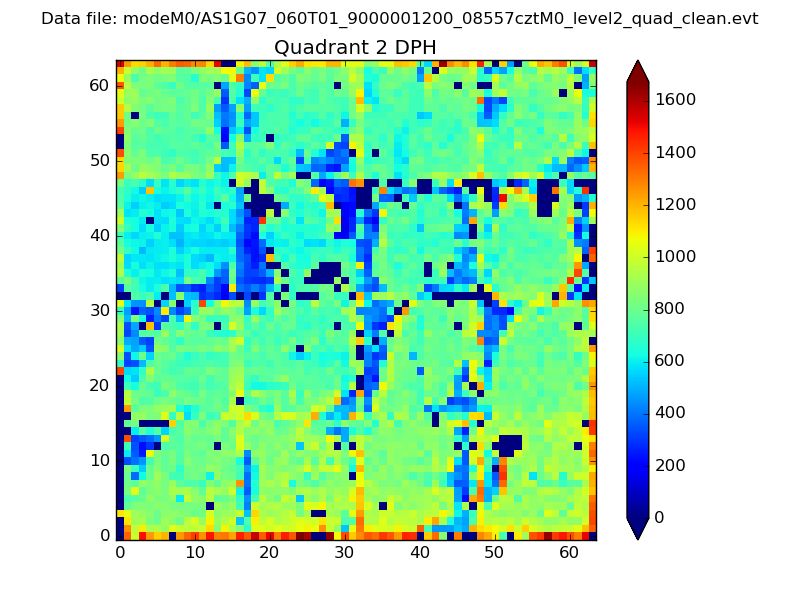
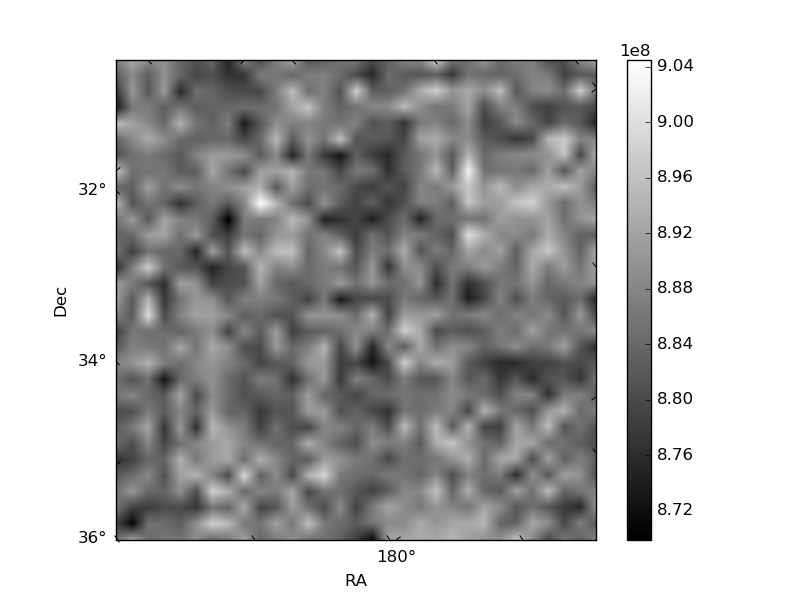
Histogram calculated using DETX and DETY for each event in the final _common_clean file
| Quadrant A | 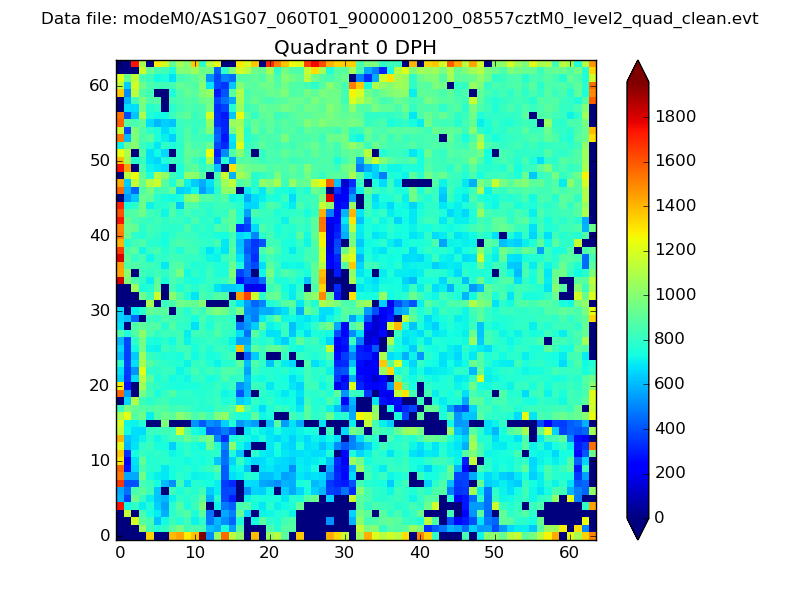 |
 |
Quadrant B |
|---|---|---|---|
| Quadrant D | 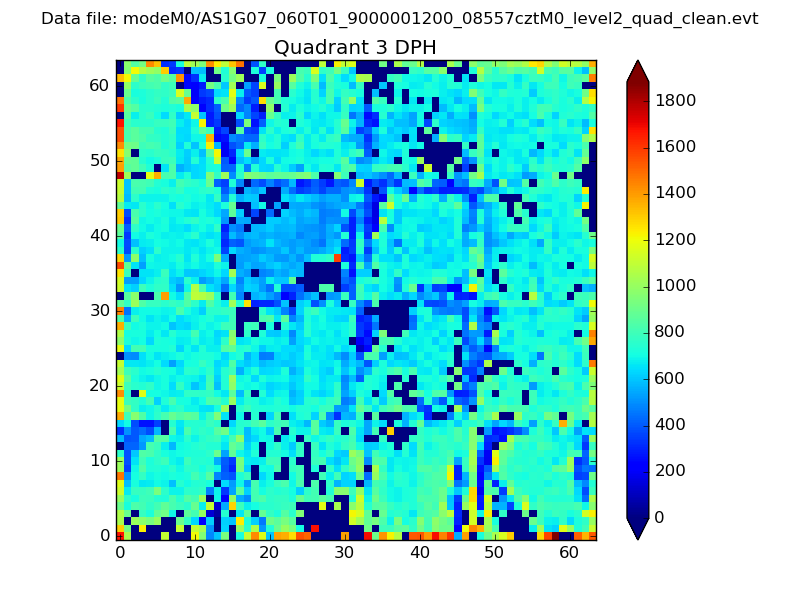 |
 |
Quadrant C |
| Plot type | Count rate plots | Images |
|---|---|---|
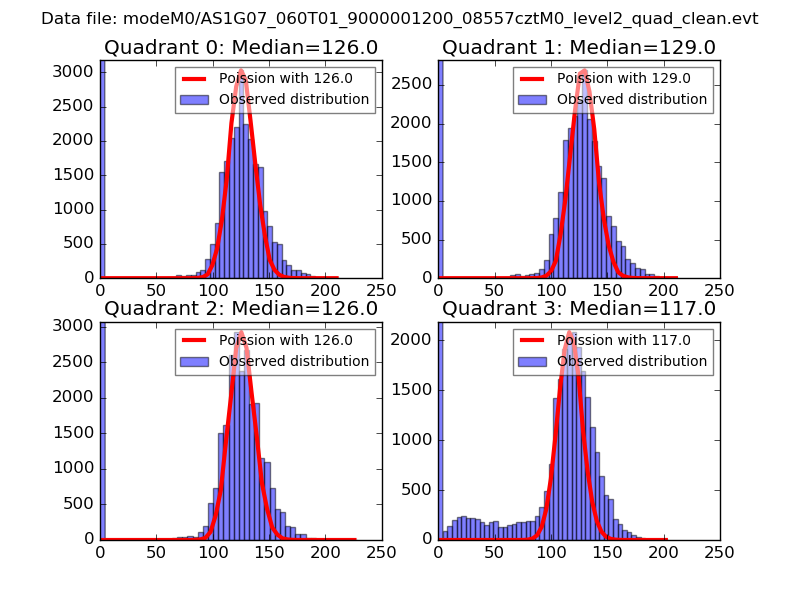
| Comparison with Poisson distribution Blue bars denote a histogram of data divided into 1 sec bins. Red curve is a Poisson curve with rate = median count rate of data. |
 |
 |
| Quadrant-wise count rates Data is divided into 100 sec bins |
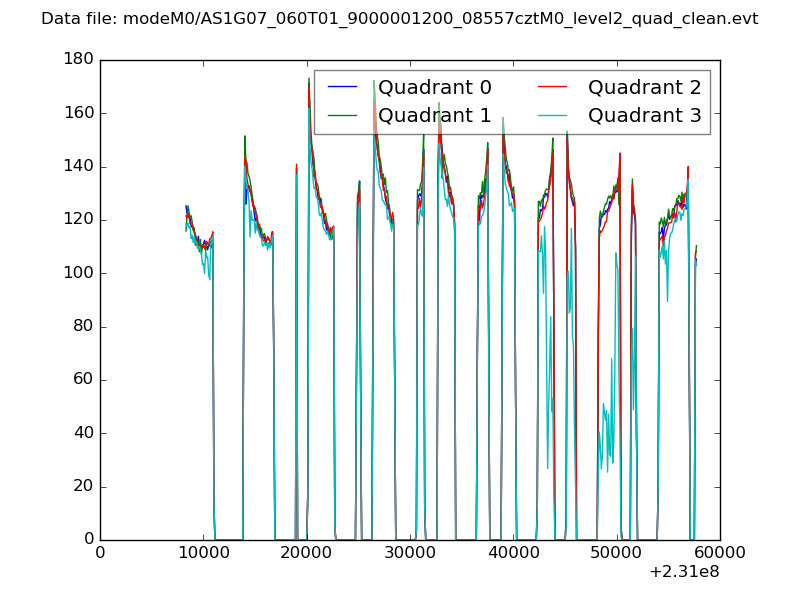 |
|
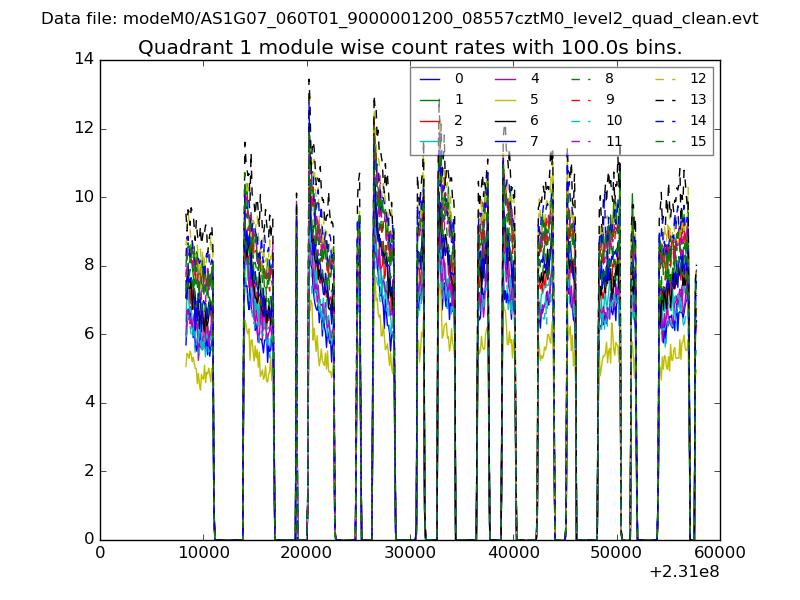
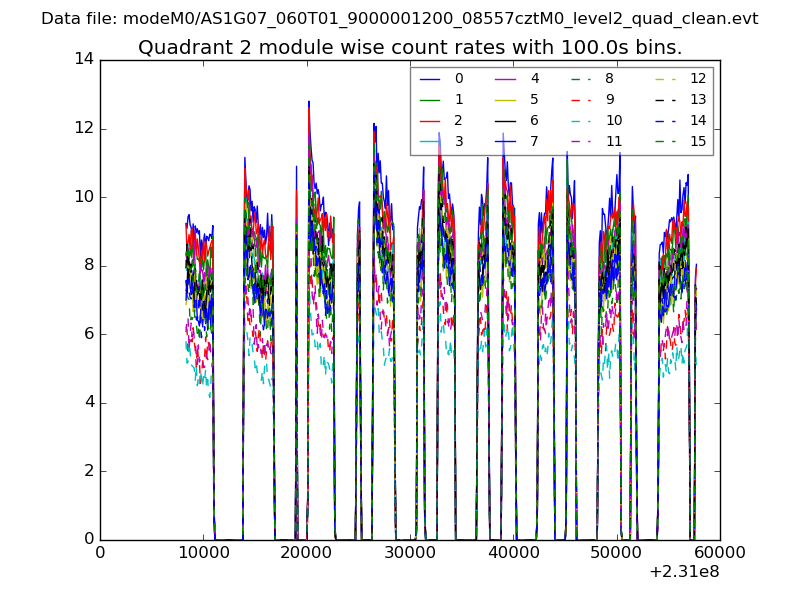
| Module-wise count rates for Quadrant A Data is divided into 100 sec bins |
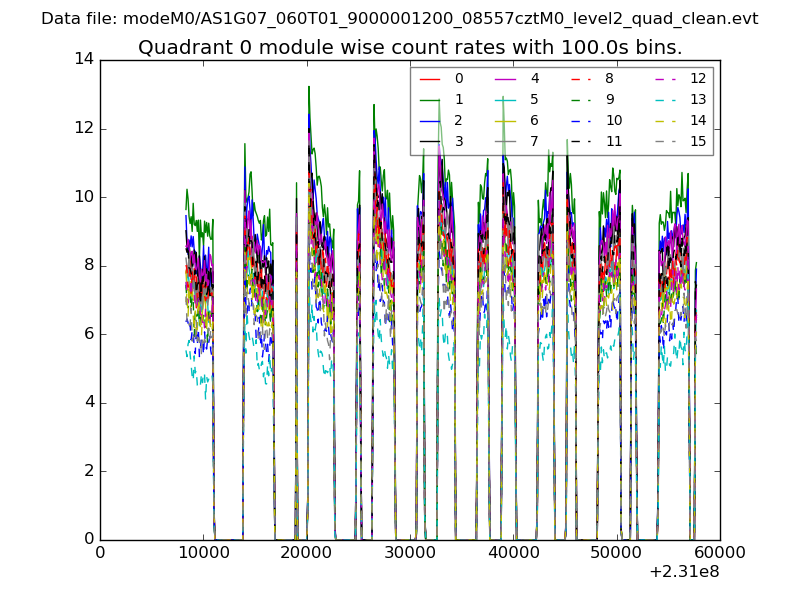 |
 |
| Module-wise count rates for Quadrant B Data is divided into 100 sec bins |
 |
 |
| Module-wise count rates for Quadrant C Data is divided into 100 sec bins |
 |
 |
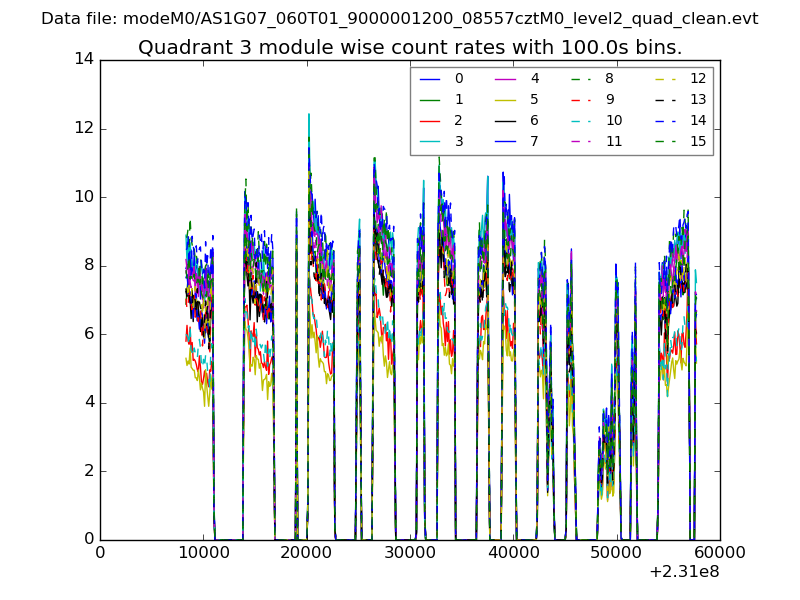
| Module-wise count rates for Quadrant D Data is divided into 100 sec bins |
 |
 |
| Parameter | Plot |
|---|---|
| CZT HV Monitor | 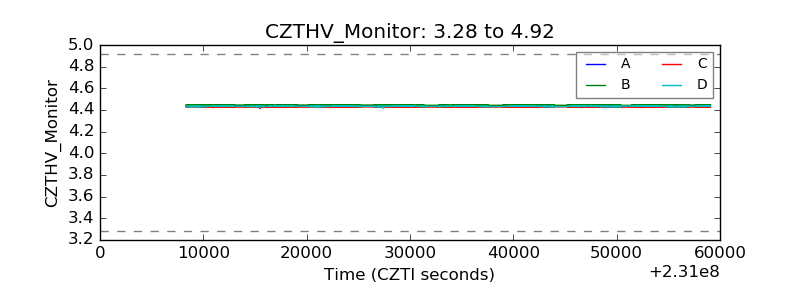 |
| D_VDD | 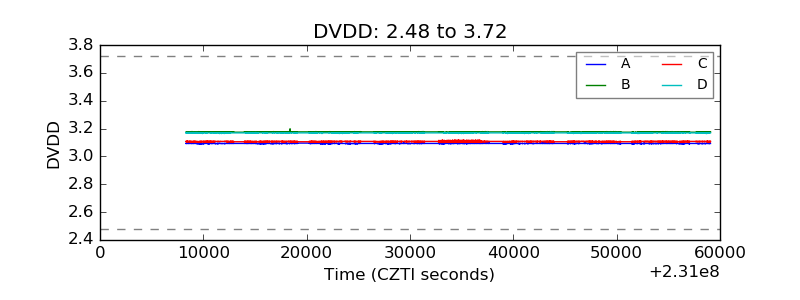 |
| Temperature 1 | 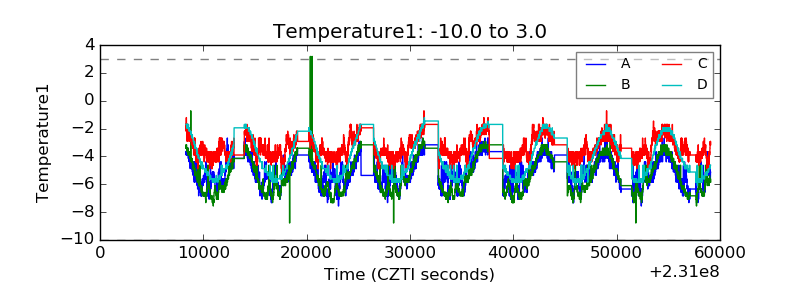 |
| Veto HV Monitor |  |
| Veto LLD | 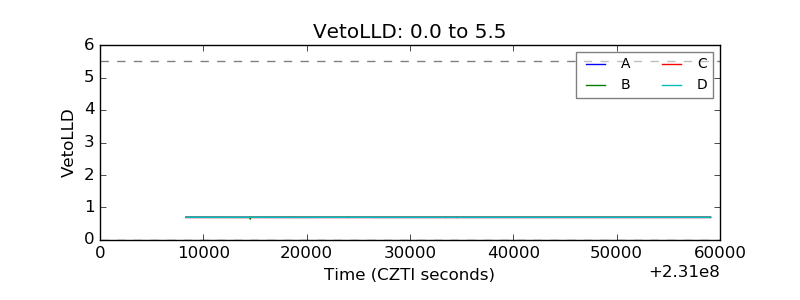 |
| Alpha Counter | 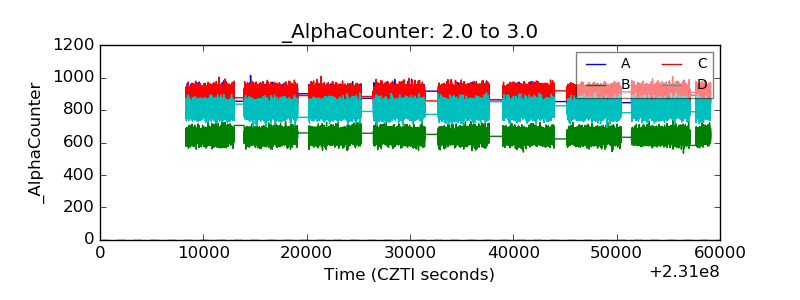 |
| _CPM_Rate | 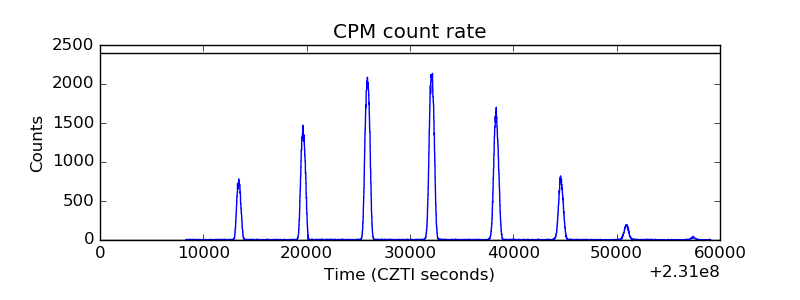 |
| CZT Counter | 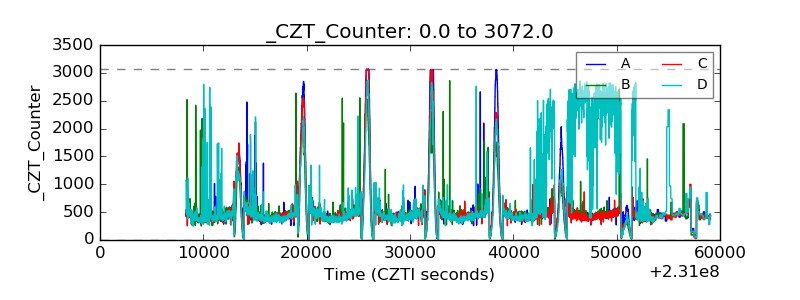 |
| +2.5 Volts monitor |  |
| +5 Volts monitor |  |
| _ROLL_ROT | 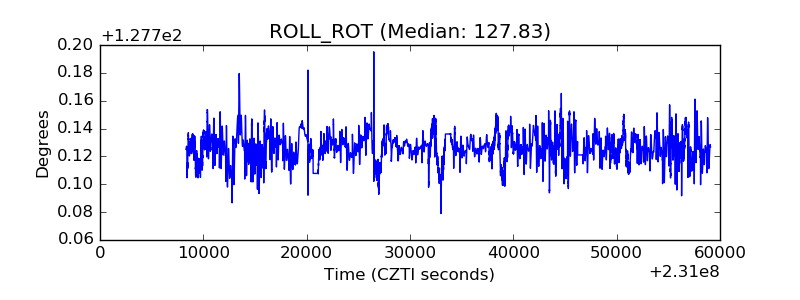 |
| _Roll_DEC | 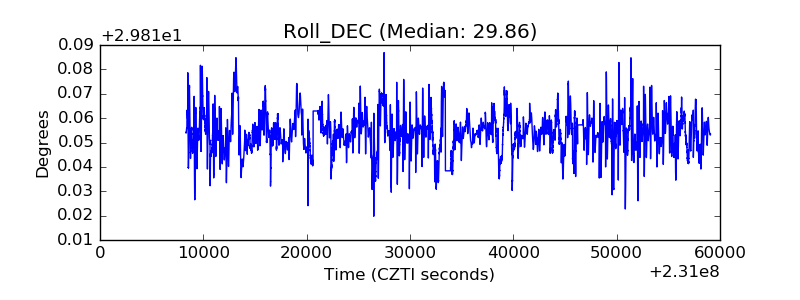 |
| _Roll_RA | 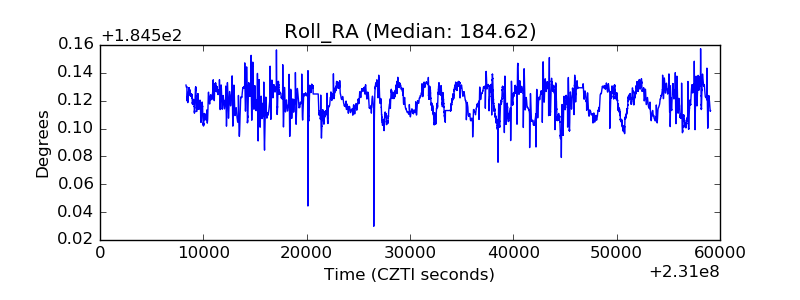 |
| Veto Counter | 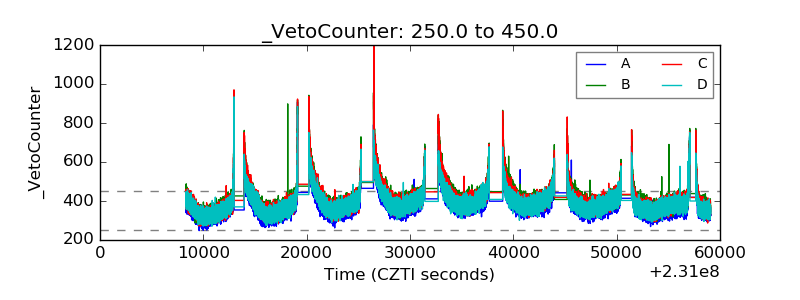 |