| Param | Original file | Final file |
|---|---|---|
| Filename | modeM0/AS1G07_060T01_9000001200_08558cztM0_level2.evt | modeM0/AS1G07_060T01_9000001200_08558cztM0_level2_quad_clean.evt |
| Size (bytes) | 787,210,560 | 136,307,520 |
| Size | 750.7 MB | 130.0 MB |
| Events in quadrant A | 5,596,013 | 826,878 |
| Events in quadrant B | 5,786,465 | 839,945 |
| Events in quadrant C | 5,522,171 | 825,692 |
| Events in quadrant D | 6,111,356 | 794,551 |
| Mode SS | |||
|---|---|---|---|
| Quadrant | BADHDUFLAG | Total packets | Discarded packets |
| A | 0 | 246 | 0 |
| B | 0 | 246 | 0 |
| C | 0 | 246 | 0 |
| D | 0 | 246 | 0 |
| Mode M0 | |||
|---|---|---|---|
| Quadrant | BADHDUFLAG | Total packets | Discarded packets |
| A | 0 | 25200 | 3 |
| B | 0 | 25438 | 2 |
| C | 0 | 25179 | 2 |
| D | 0 | 26928 | 2 |
| Mode M9 | |||
|---|---|---|---|
| Quadrant | BADHDUFLAG | Total packets | Discarded packets |
| A | 0 | 6 | 0 |
| B | 0 | 6 | 0 |
| C | 0 | 6 | 0 |
| D | 0 | 6 | 0 |
| Quadrant | Total seconds | Saturated seconds | Saturation percentage |
|---|---|---|---|
| A | 12153 | 436 | 3.587592% |
| B | 12153 | 446 | 3.669876% |
| C | 12153 | 309 | 2.542582% |
| D | 12153 | 464 | 3.817987% |
Noise dominated data is calculated using 1-second bins in cleaned event files. If a bin has >2000 counts, and if more than 50% of those come from <1% of pixels, then it is considered to be noise-dominated and hence unusable.
| Quadrant | # 1 sec bins | Bins with >0 counts | Bins with >2000 counts | High rate bins dominated by noise | Noise dominated (total time) | Noise dominated (detector-on time) | Marked lightcurve |
|---|---|---|---|---|---|---|---|
| A | 12768 | 12154 | 0 | 0 | 0.00% | 0.00% | 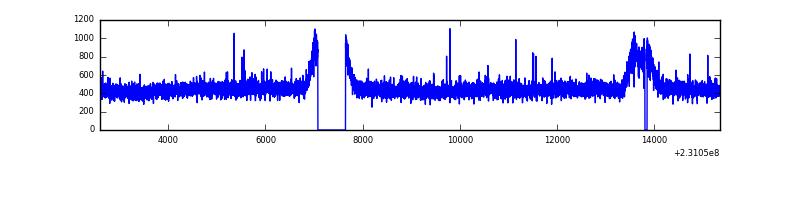 |
| B | 12768 | 12153 | 3 | 3 | 0.02% | 0.02% | 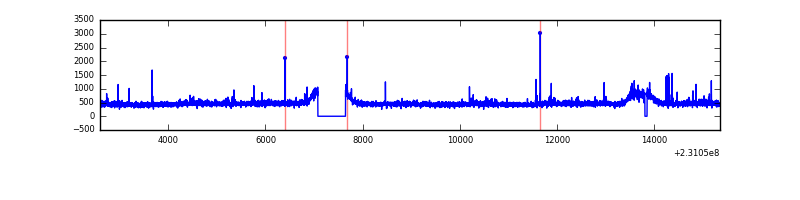 |
| C | 12768 | 12154 | 0 | 0 | 0.00% | 0.00% |  |
| D | 12768 | 12154 | 94 | 94 | 0.74% | 0.77% | 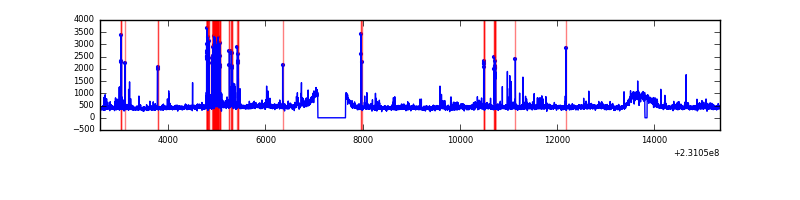 |
Top three noisy pixels from each quadrant. If the there are fewer than three noisy pixels in the level2.evt file, extra rows are filled as -1
| Pixel properties | Quadrant properties | ||||||
|---|---|---|---|---|---|---|---|
| Quadrant | DetID | PixID | Counts | Sigma | Mean | Median | Sigma |
| A | 0 | 226 | 13448 | 40.29 | 1451 | 1416 | 298.6 |
| A | 12 | 194 | 12807 | 38.15 | 1451 | 1416 | 298.6 |
| A | 15 | 223 | 11047 | 32.25 | 1451 | 1416 | 298.6 |
| B | 0 | 214 | 60759 | 210.23 | 1448 | 1409 | 282.3 |
| B | 12 | 111 | 32789 | 111.16 | 1448 | 1409 | 282.3 |
| B | 4 | 48 | 30756 | 103.96 | 1448 | 1409 | 282.3 |
| C | 13 | 61 | 10626 | 27.87 | 1412 | 1414 | 330.6 |
| C | 8 | 222 | 9453 | 24.32 | 1412 | 1414 | 330.6 |
| C | 8 | 128 | 5537 | 12.47 | 1412 | 1414 | 330.6 |
| D | 4 | 95 | 312075 | 892.19 | 1400 | 1362 | 348.3 |
| D | 1 | 52 | 195864 | 558.5 | 1400 | 1362 | 348.3 |
| D | 11 | 129 | 59568 | 167.13 | 1400 | 1362 | 348.3 |
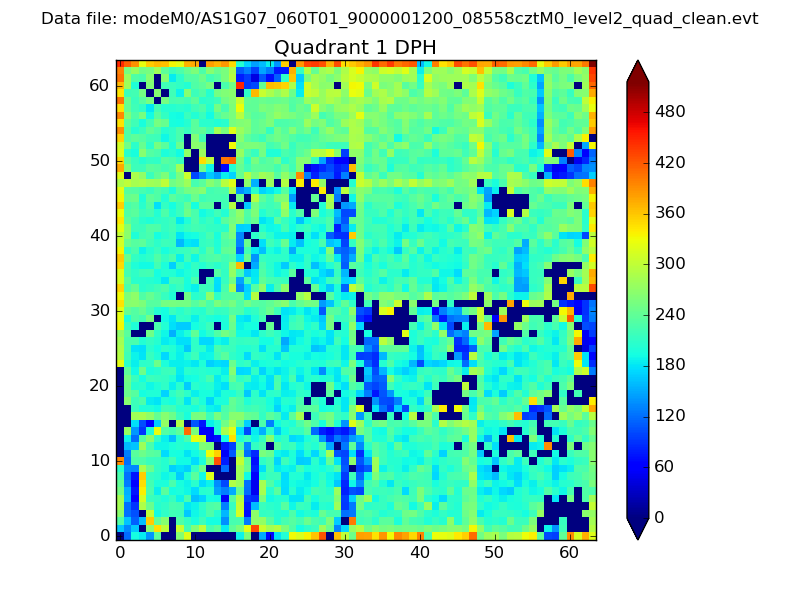
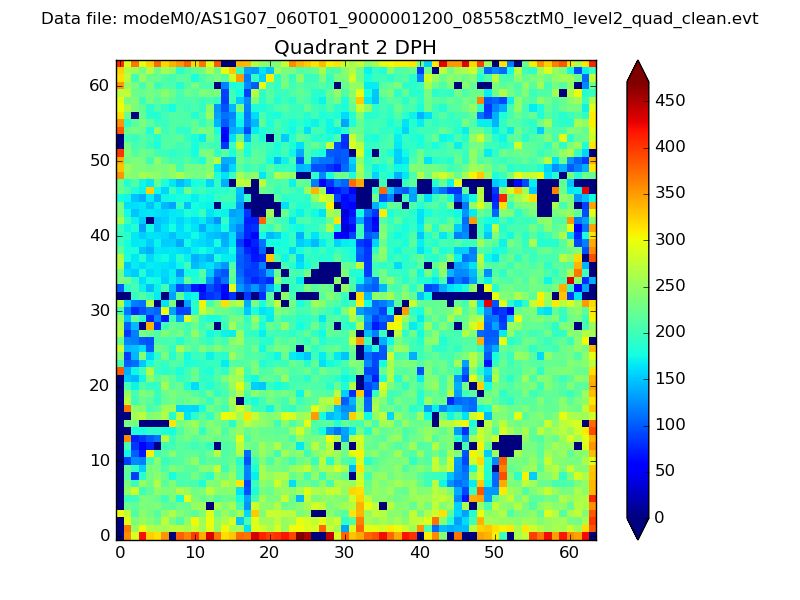
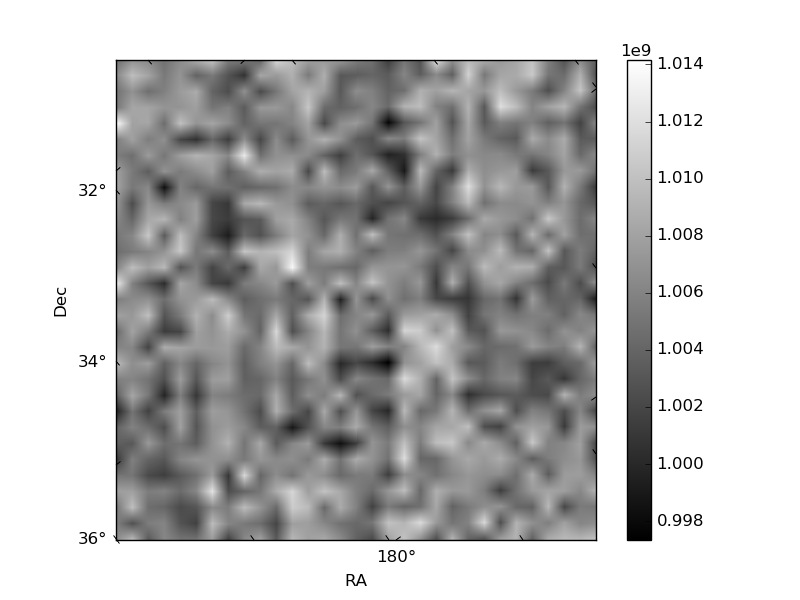
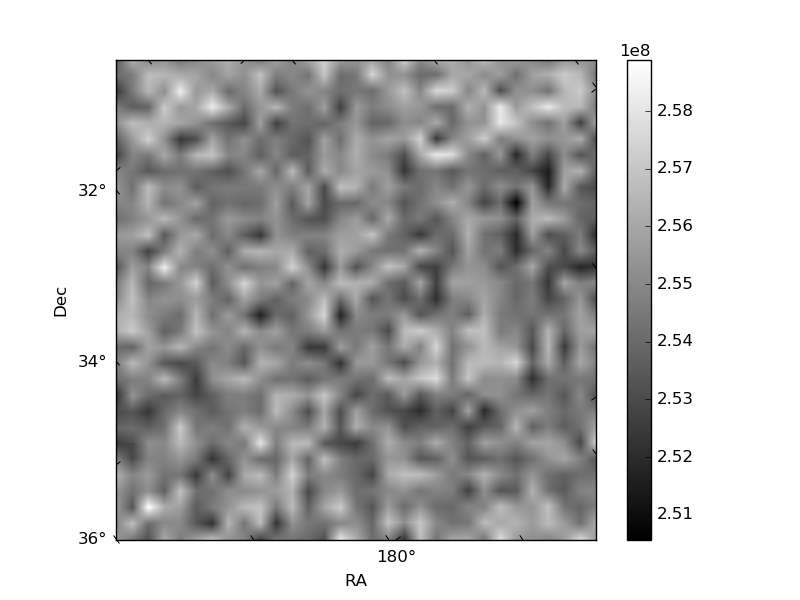
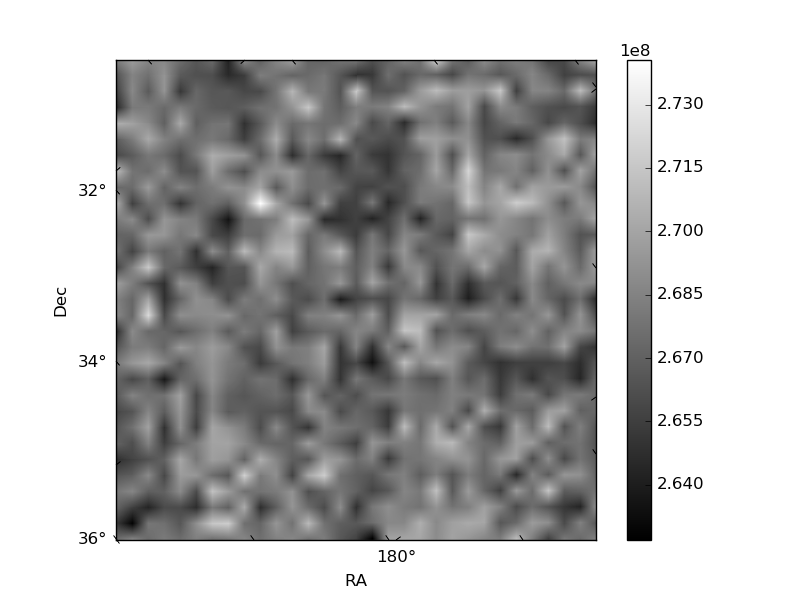
Histogram calculated using DETX and DETY for each event in the final _common_clean file
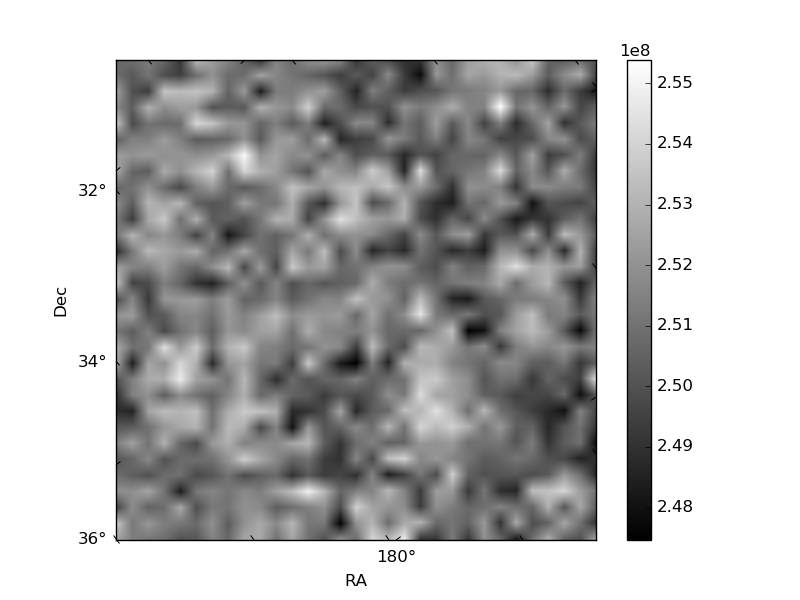
| Quadrant A | 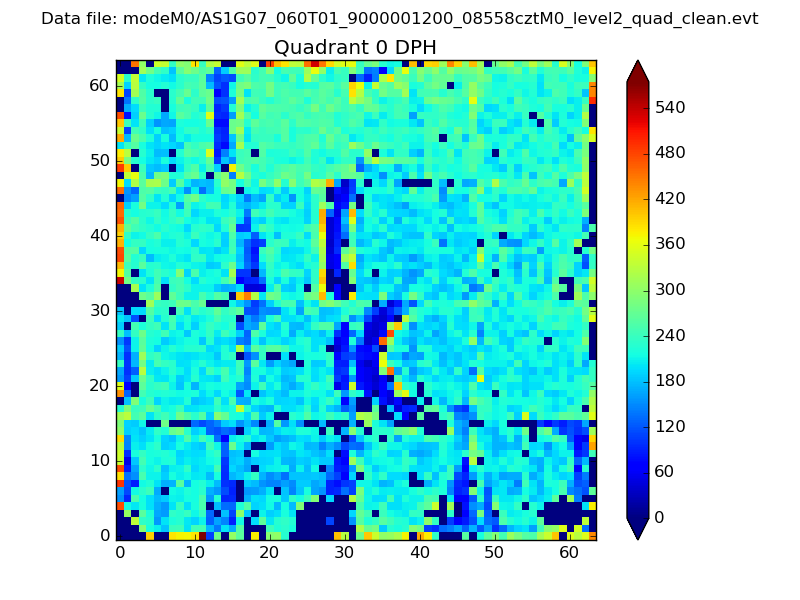 |
 |
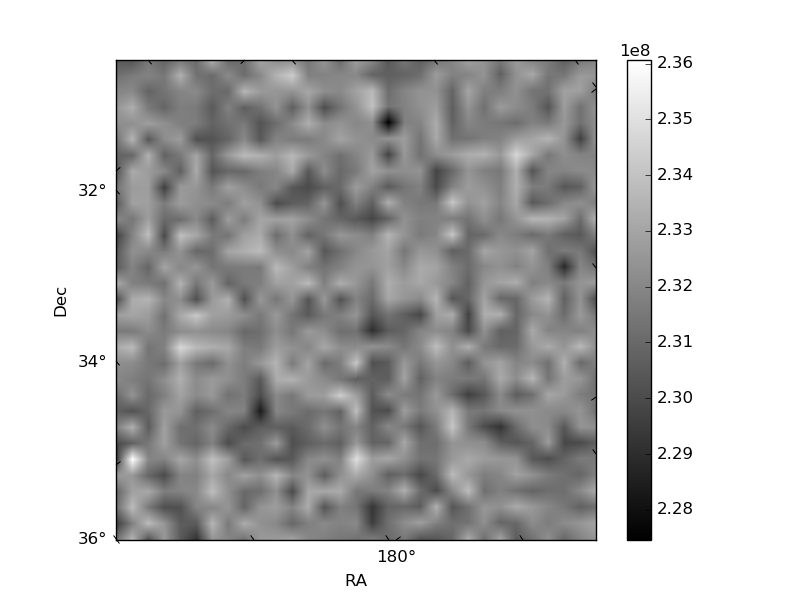
Quadrant B |
|---|---|---|---|
| Quadrant D | 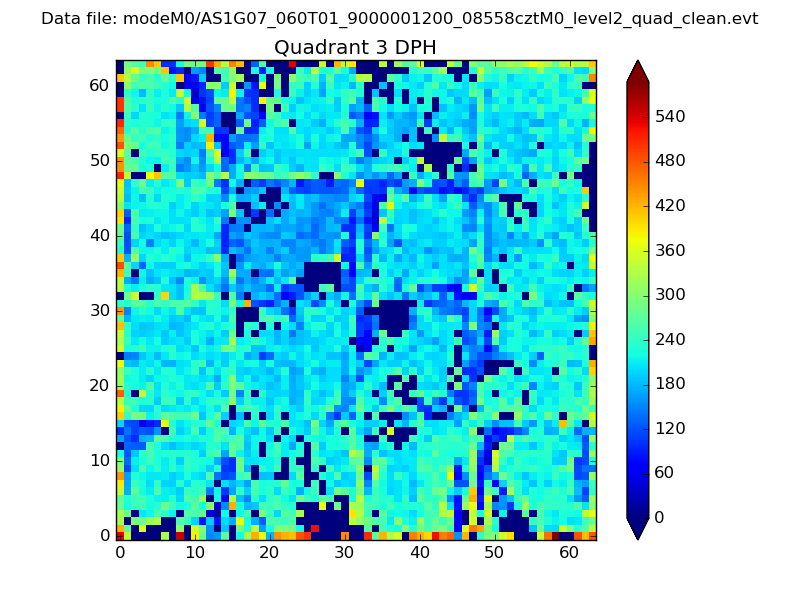 |
 |
Quadrant C |
| Plot type | Count rate plots | Images |
|---|---|---|
| Comparison with Poisson distribution Blue bars denote a histogram of data divided into 1 sec bins. Red curve is a Poisson curve with rate = median count rate of data. |
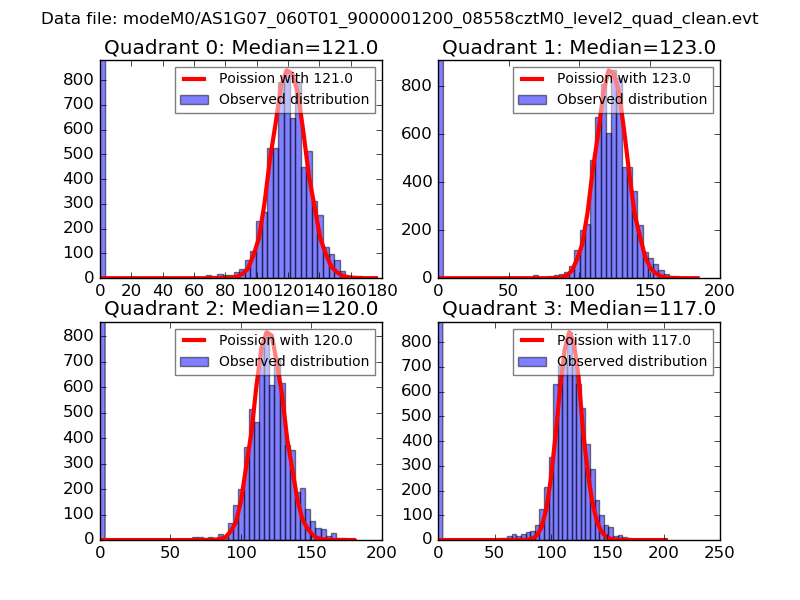 |
 |
| Quadrant-wise count rates Data is divided into 100 sec bins |
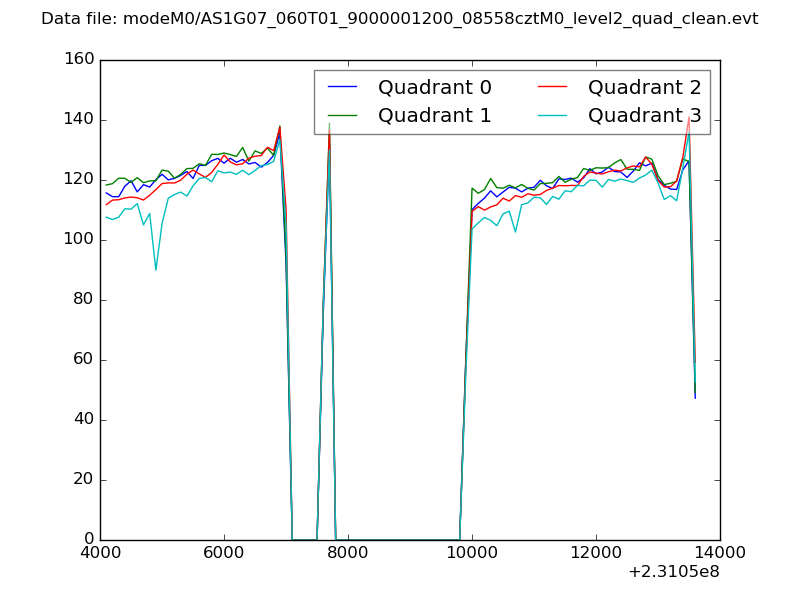 |
|
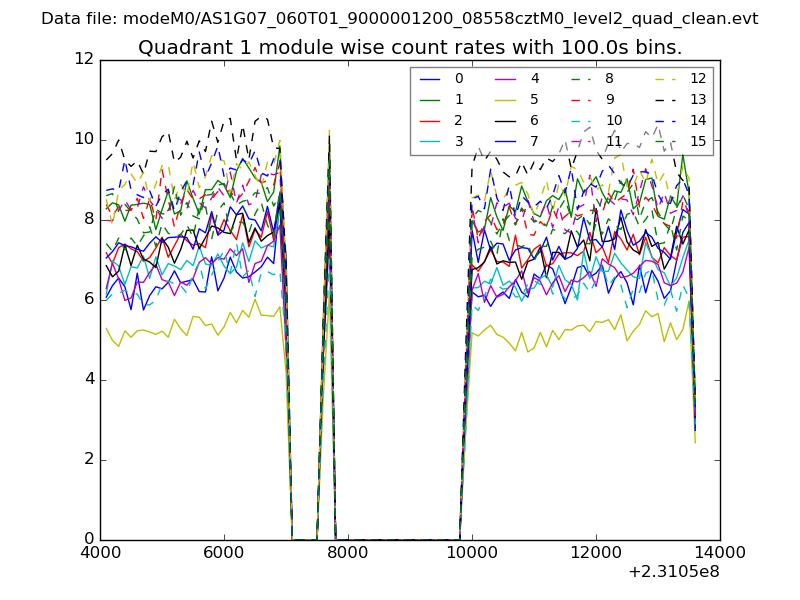
| Module-wise count rates for Quadrant A Data is divided into 100 sec bins |
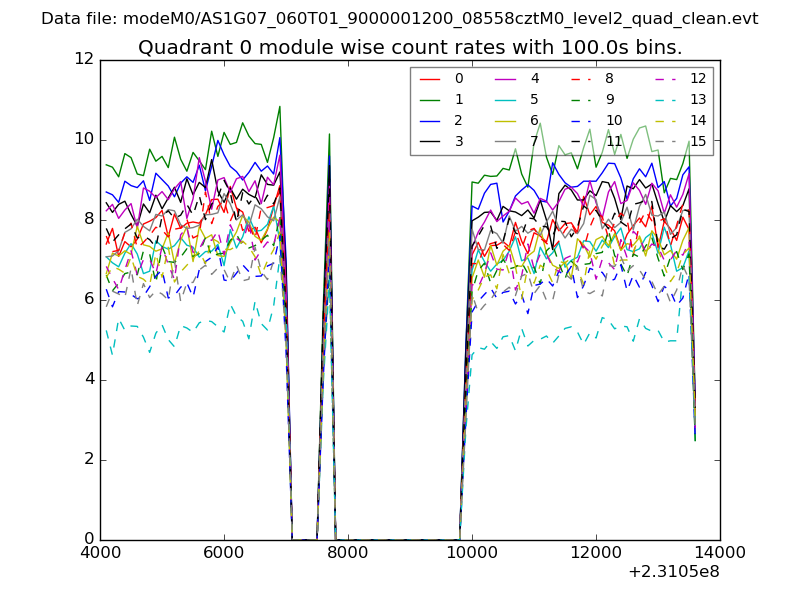 |
 |
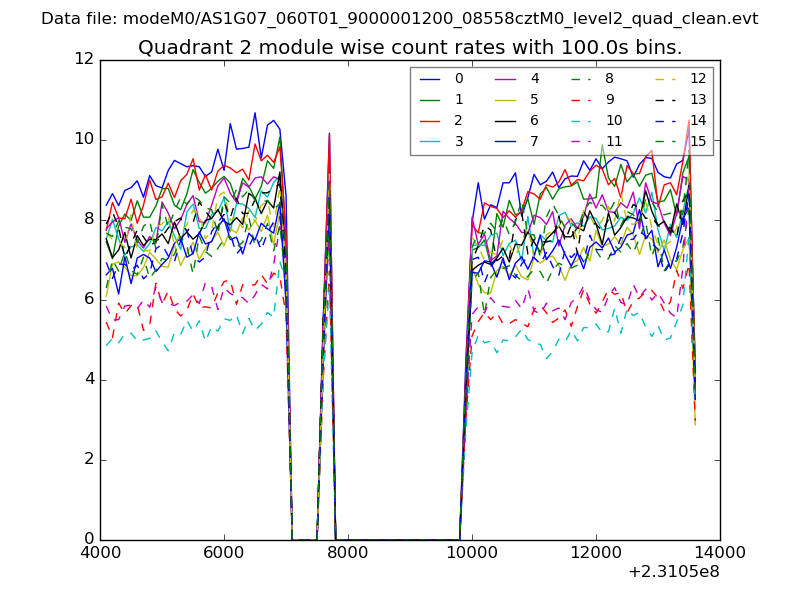
| Module-wise count rates for Quadrant B Data is divided into 100 sec bins |
 |
 |
| Module-wise count rates for Quadrant C Data is divided into 100 sec bins |
 |
 |
| Module-wise count rates for Quadrant D Data is divided into 100 sec bins |
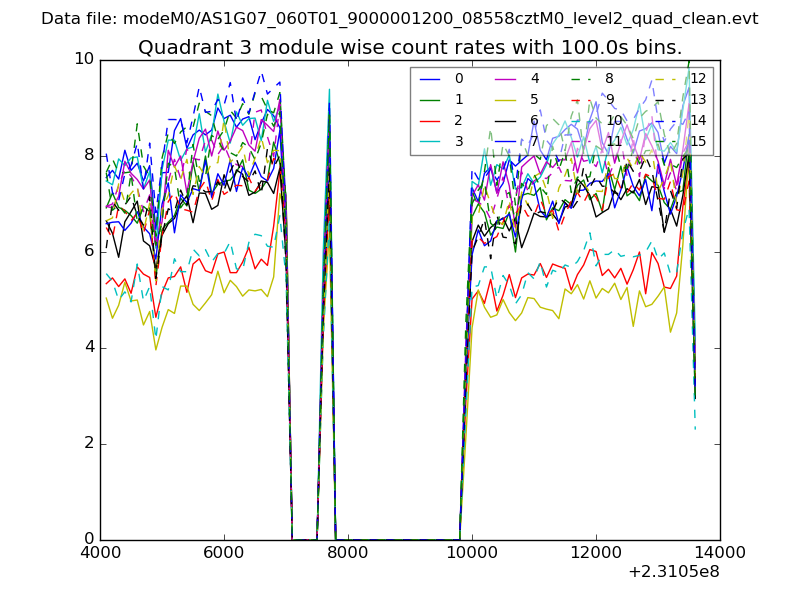 |
 |
| Parameter | Plot |
|---|---|
| CZT HV Monitor | 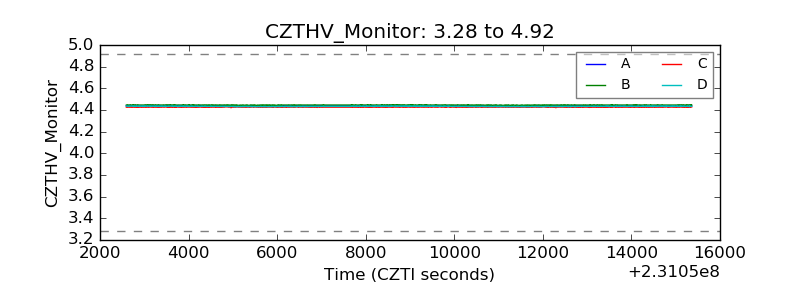 |
| D_VDD | 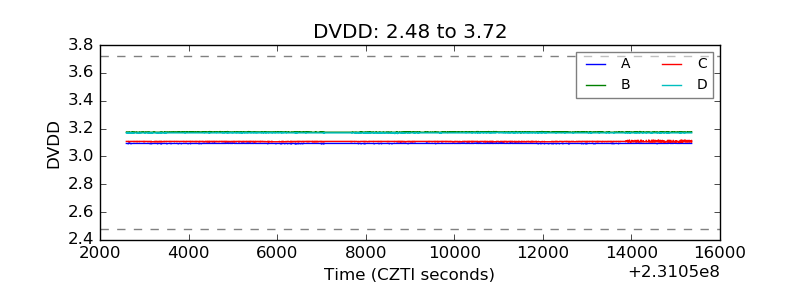 |
| Temperature 1 | 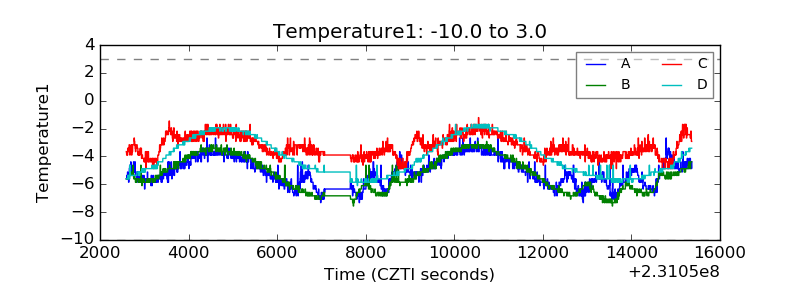 |
| Veto HV Monitor |  |
| Veto LLD | 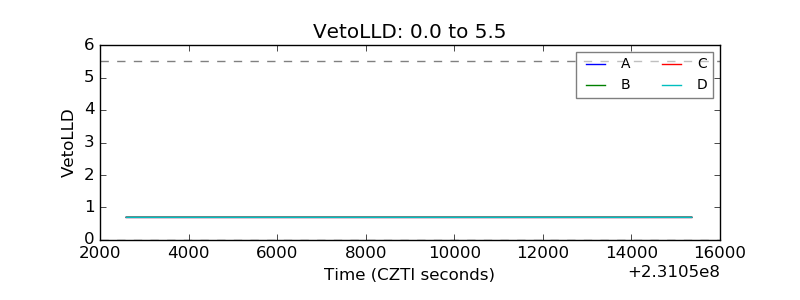 |
| Alpha Counter | 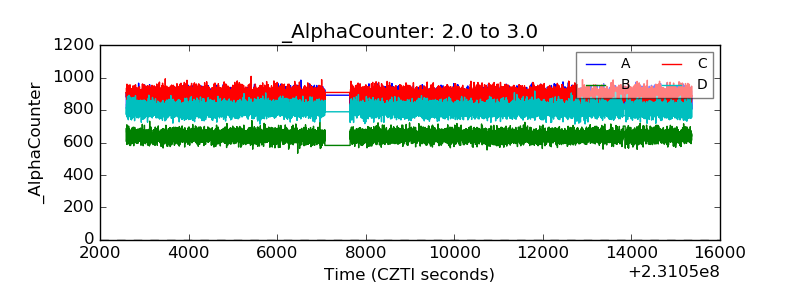 |
| _CPM_Rate | 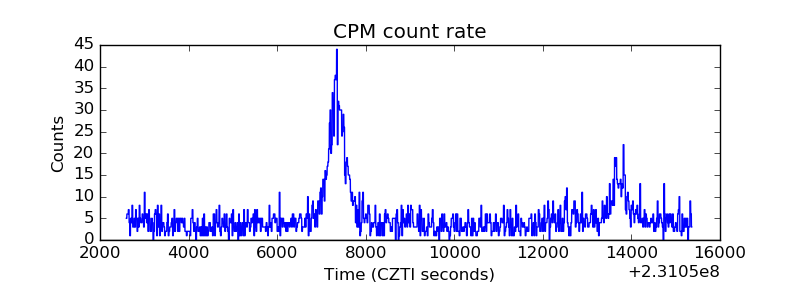 |
| CZT Counter |  |
| +2.5 Volts monitor |  |
| +5 Volts monitor |  |
| _ROLL_ROT | 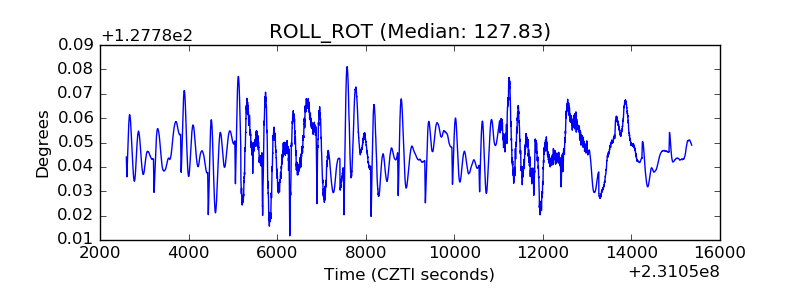 |
| _Roll_DEC | 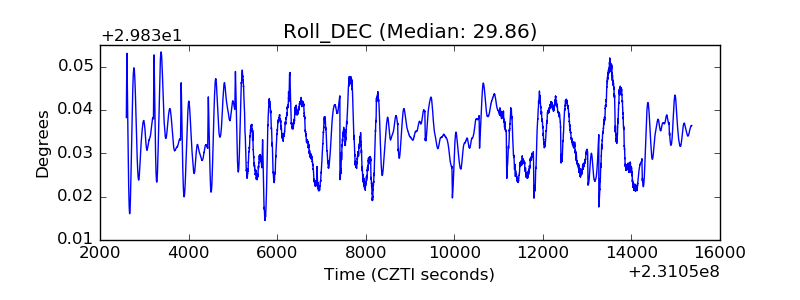 |
| _Roll_RA | 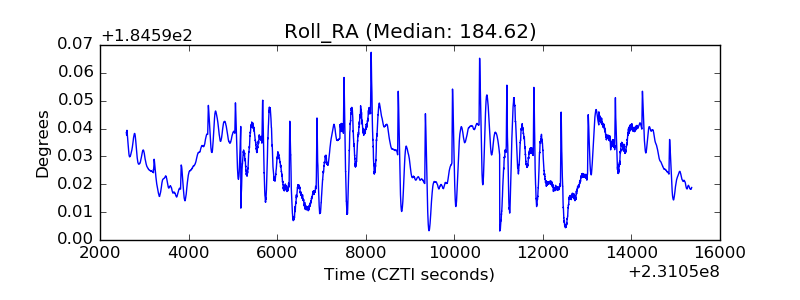 |
| Veto Counter | 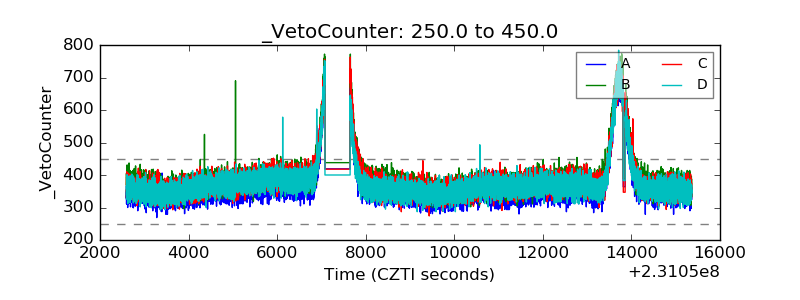 |