| Param | Original file | Final file |
|---|---|---|
| Filename | modeM0/AS1G07_060T01_9000001200_08562cztM0_level2.evt | modeM0/AS1G07_060T01_9000001200_08562cztM0_level2_quad_clean.evt |
| Size (bytes) | 1,275,284,160 | 231,909,120 |
| Size | 1.2 GB | 221.2 MB |
| Events in quadrant A | 9,426,463 | 1,442,810 |
| Events in quadrant B | 9,103,783 | 1,457,596 |
| Events in quadrant C | 8,393,980 | 1,438,478 |
| Events in quadrant D | 10,420,486 | 1,384,574 |
| Mode SS | |||
|---|---|---|---|
| Quadrant | BADHDUFLAG | Total packets | Discarded packets |
| A | 0 | 384 | 0 |
| B | 0 | 384 | 0 |
| C | 0 | 384 | 0 |
| D | 0 | 384 | 0 |
| Mode M0 | |||
|---|---|---|---|
| Quadrant | BADHDUFLAG | Total packets | Discarded packets |
| A | 0 | 41021 | 13 |
| B | 0 | 39833 | 14 |
| C | 0 | 38539 | 10 |
| D | 0 | 44185 | 15 |
| Mode M9 | |||
|---|---|---|---|
| Quadrant | BADHDUFLAG | Total packets | Discarded packets |
| A | 0 | 16 | 0 |
| B | 0 | 16 | 0 |
| C | 0 | 16 | 0 |
| D | 0 | 16 | 0 |
| Quadrant | Total seconds | Saturated seconds | Saturation percentage |
|---|---|---|---|
| A | 18865 | 561 | 2.973761% |
| B | 18864 | 454 | 2.406701% |
| C | 18866 | 290 | 1.537157% |
| D | 18865 | 715 | 3.790087% |
Noise dominated data is calculated using 1-second bins in cleaned event files. If a bin has >2000 counts, and if more than 50% of those come from <1% of pixels, then it is considered to be noise-dominated and hence unusable.
| Quadrant | # 1 sec bins | Bins with >0 counts | Bins with >2000 counts | High rate bins dominated by noise | Noise dominated (total time) | Noise dominated (detector-on time) | Marked lightcurve |
|---|---|---|---|---|---|---|---|
| A | 20524 | 18869 | 137 | 137 | 0.67% | 0.73% | 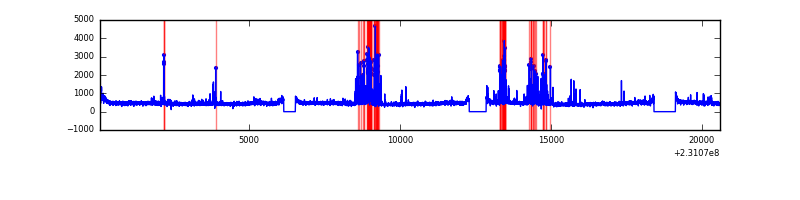 |
| B | 20524 | 18869 | 80 | 80 | 0.39% | 0.42% | 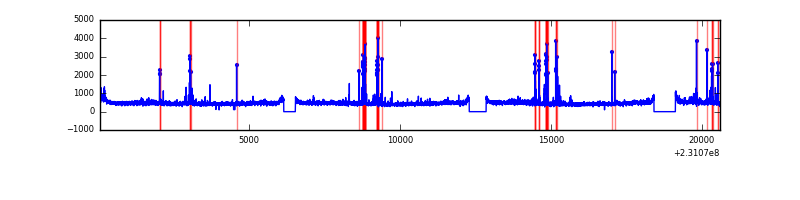 |
| C | 20524 | 18869 | 1 | 1 | 0.00% | 0.01% | 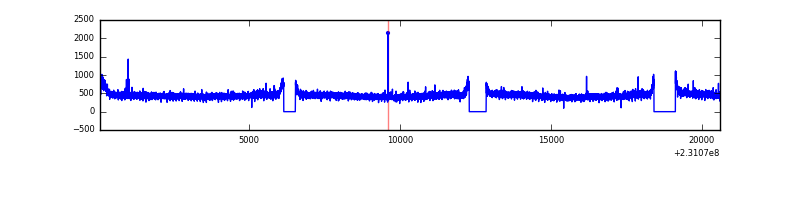 |
| D | 20524 | 18869 | 374 | 374 | 1.82% | 1.98% | 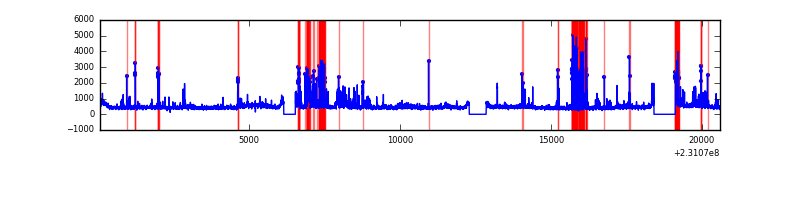 |
Top three noisy pixels from each quadrant. If the there are fewer than three noisy pixels in the level2.evt file, extra rows are filled as -1
| Pixel properties | Quadrant properties | ||||||
|---|---|---|---|---|---|---|---|
| Quadrant | DetID | PixID | Counts | Sigma | Mean | Median | Sigma |
| A | 15 | 223 | 653076 | 1463.86 | 2187 | 2133 | 444.7 |
| A | 15 | 239 | 273646 | 610.59 | 2187 | 2133 | 444.7 |
| A | 15 | 255 | 38308 | 81.35 | 2187 | 2133 | 444.7 |
| B | 10 | 16 | 325201 | 759.68 | 2200 | 2140 | 425.3 |
| B | 0 | 214 | 115720 | 267.08 | 2200 | 2140 | 425.3 |
| B | 11 | 51 | 52177 | 117.66 | 2200 | 2140 | 425.3 |
| C | 9 | 54 | 29154 | 54.39 | 2143 | 2146 | 496.6 |
| C | 13 | 61 | 16217 | 28.34 | 2143 | 2146 | 496.6 |
| C | 8 | 222 | 11632 | 19.1 | 2143 | 2146 | 496.6 |
| D | 1 | 52 | 1833061 | 3566.68 | 2099 | 2044 | 513.4 |
| D | 14 | 34 | 199767 | 385.15 | 2099 | 2044 | 513.4 |
| D | 12 | 233 | 114096 | 218.27 | 2099 | 2044 | 513.4 |
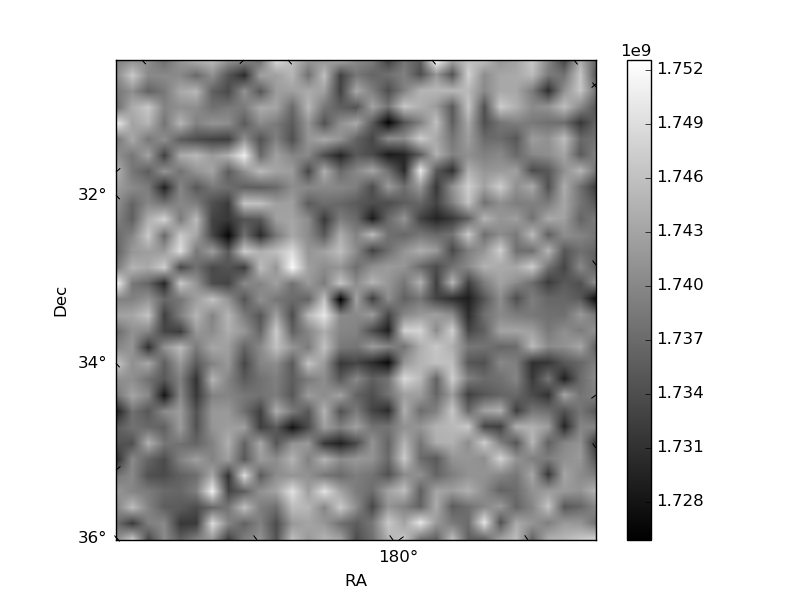
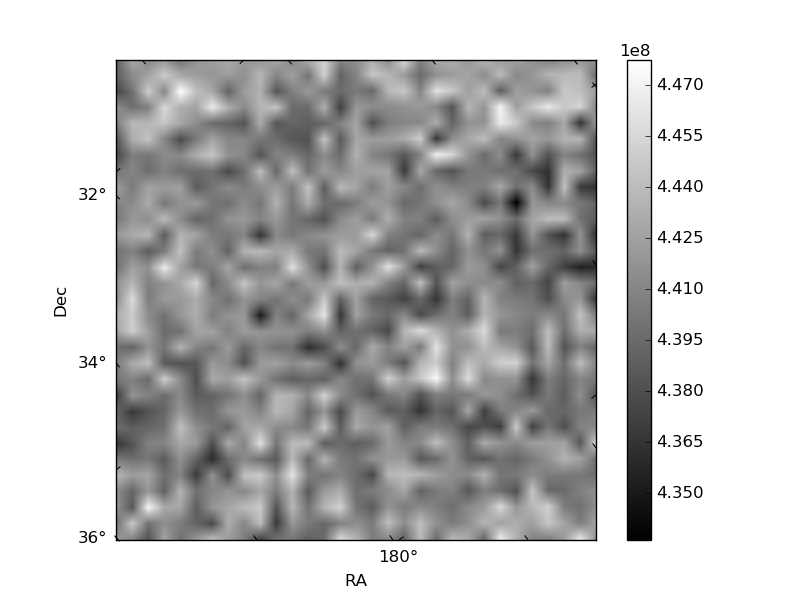
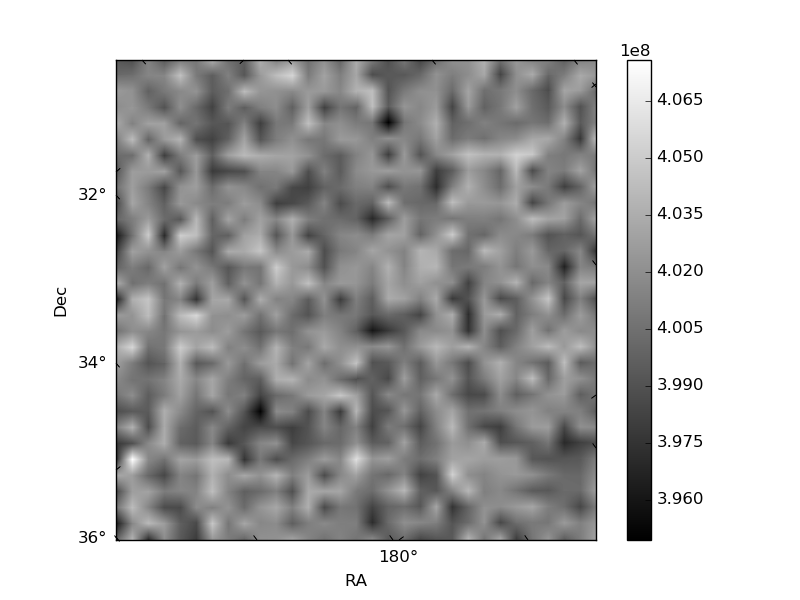
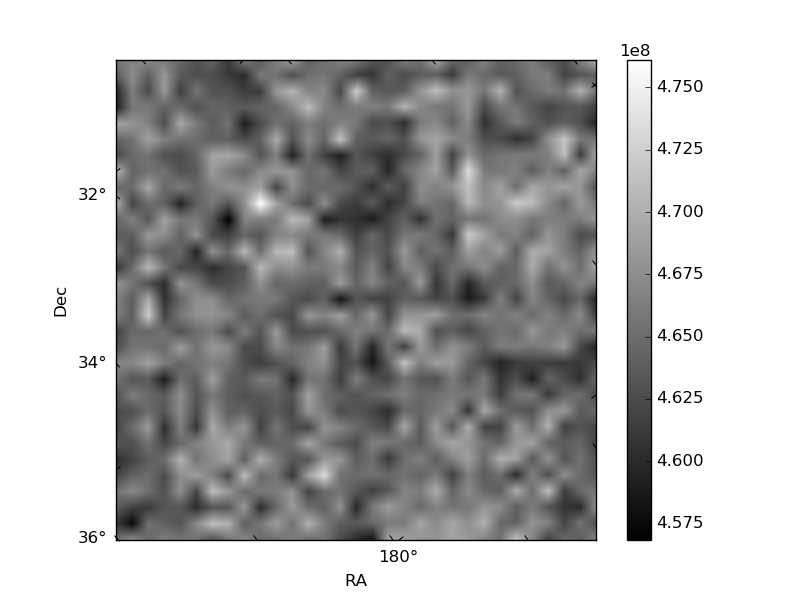
Histogram calculated using DETX and DETY for each event in the final _common_clean file
| Quadrant A | 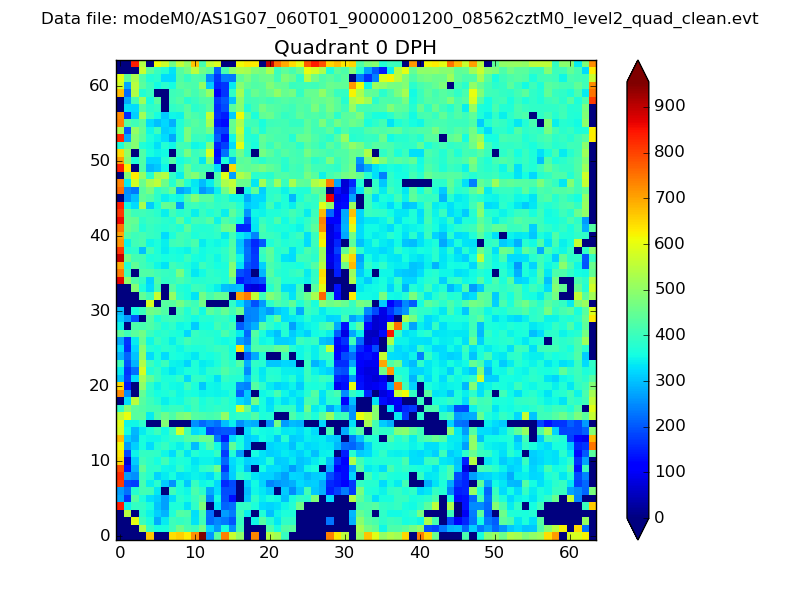 |
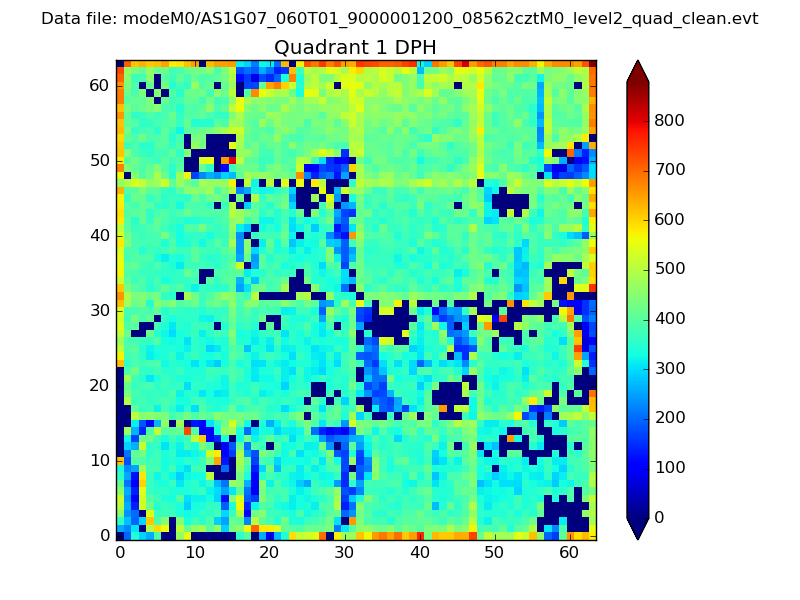 |
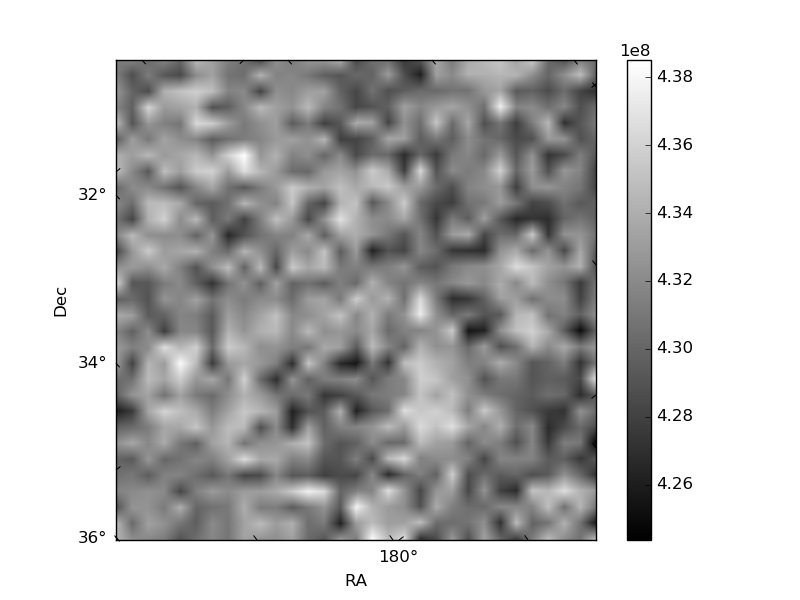
Quadrant B |
|---|---|---|---|
| Quadrant D | 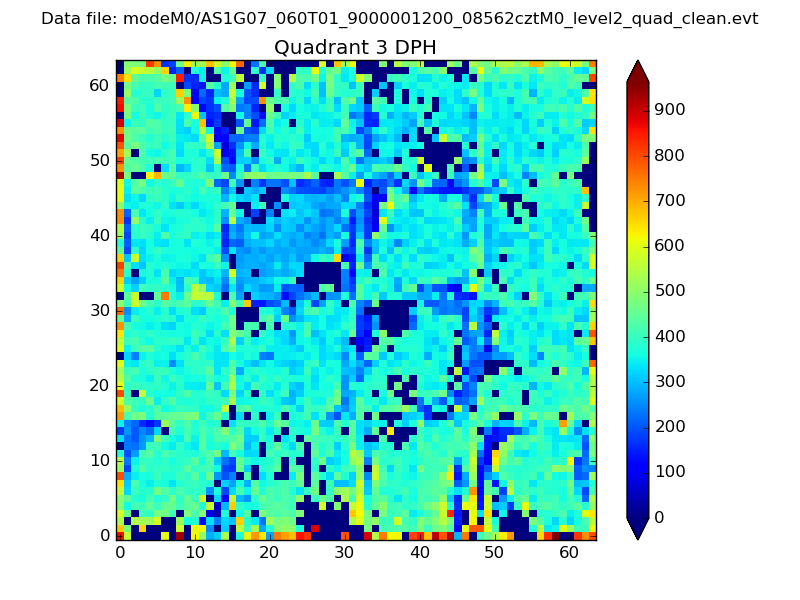 |
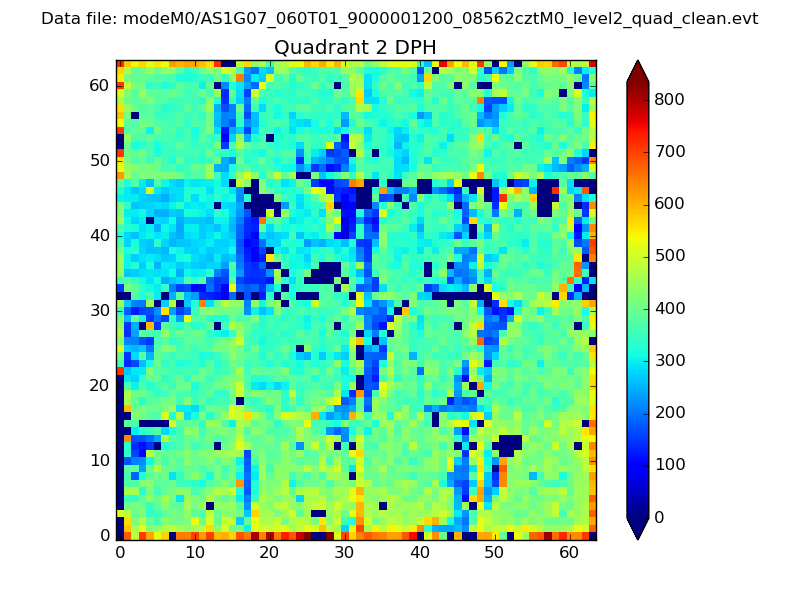 |
Quadrant C |
| Plot type | Count rate plots | Images |
|---|---|---|
| Comparison with Poisson distribution Blue bars denote a histogram of data divided into 1 sec bins. Red curve is a Poisson curve with rate = median count rate of data. |
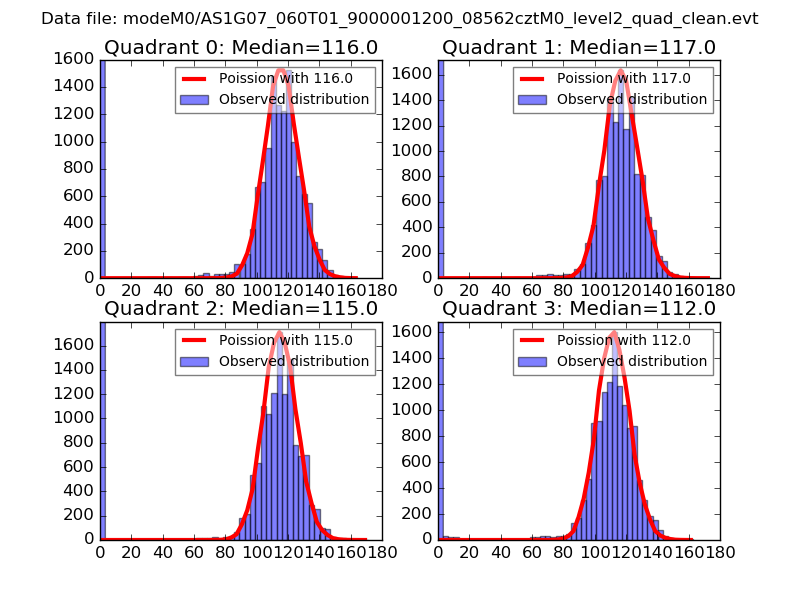 |
 |
| Quadrant-wise count rates Data is divided into 100 sec bins |
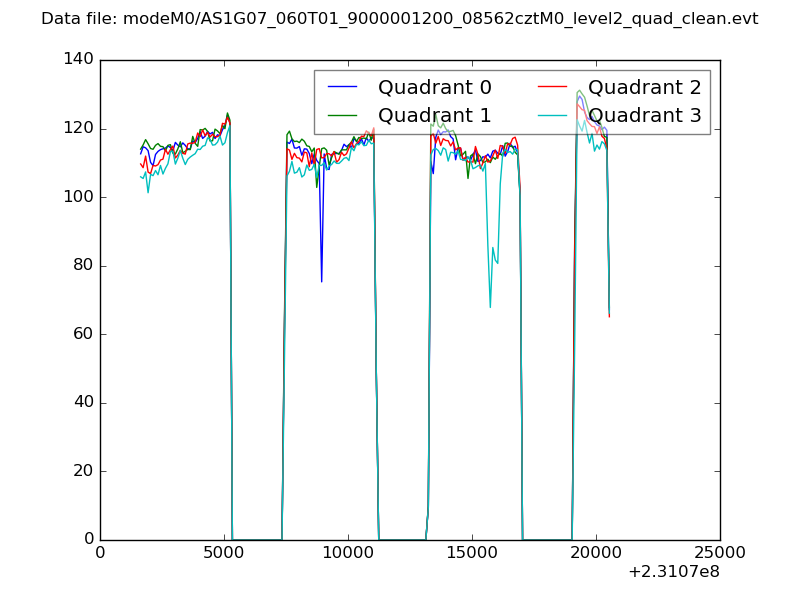 |
|
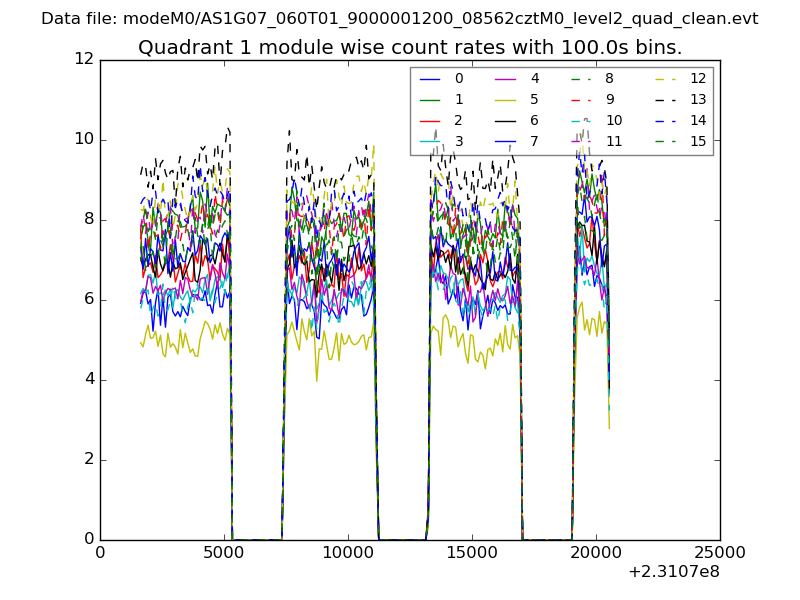
| Module-wise count rates for Quadrant A Data is divided into 100 sec bins |
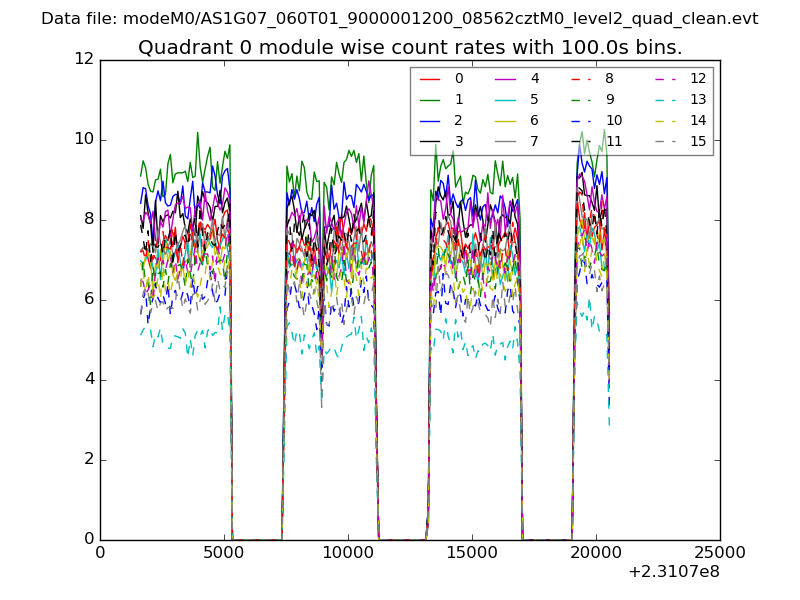 |
 |
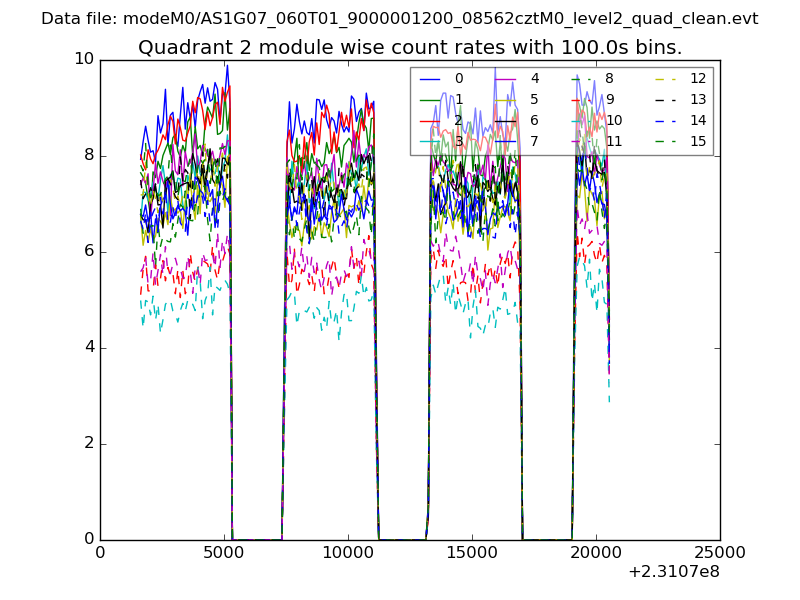
| Module-wise count rates for Quadrant B Data is divided into 100 sec bins |
 |
 |
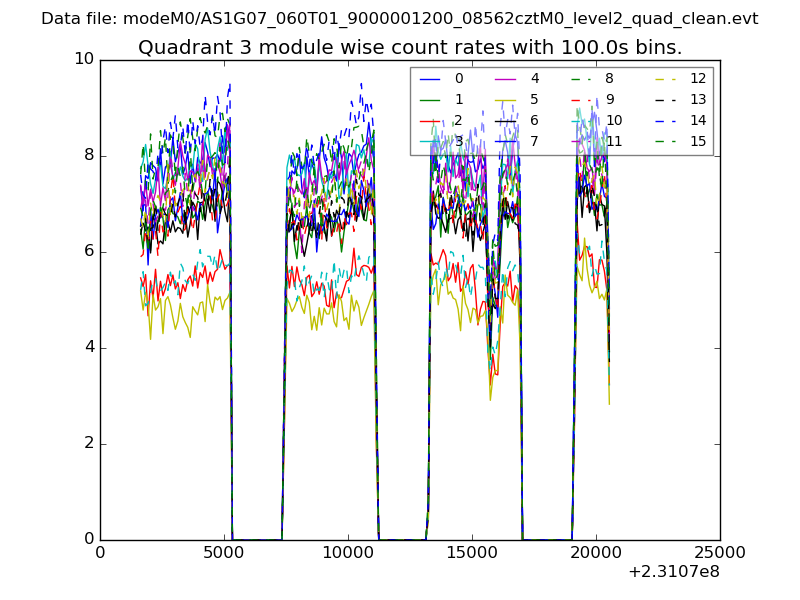
| Module-wise count rates for Quadrant C Data is divided into 100 sec bins |
 |
 |
| Module-wise count rates for Quadrant D Data is divided into 100 sec bins |
 |
 |
| Parameter | Plot |
|---|---|
| CZT HV Monitor | 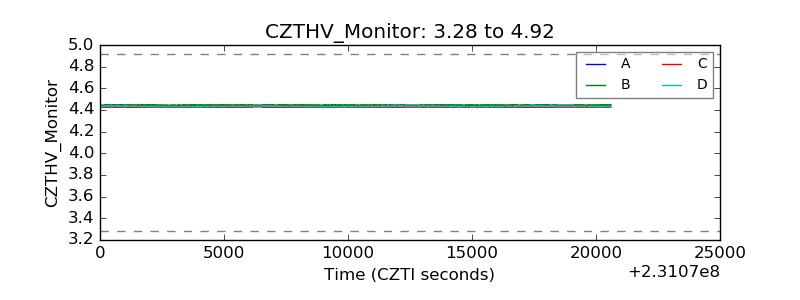 |
| D_VDD |  |
| Temperature 1 | 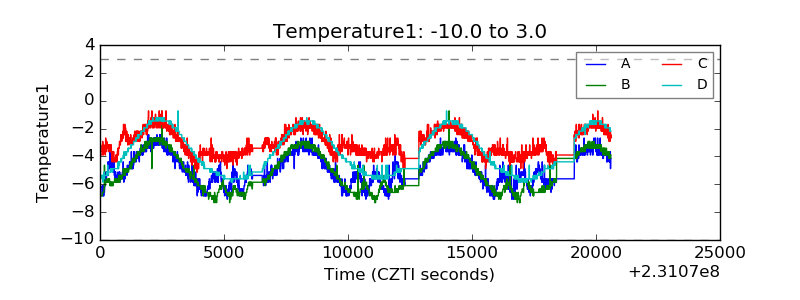 |
| Veto HV Monitor |  |
| Veto LLD | 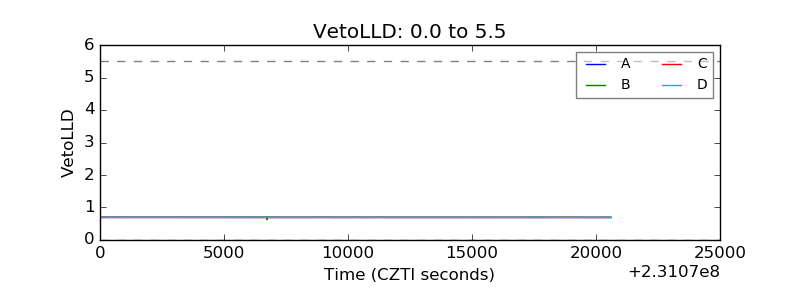 |
| Alpha Counter | 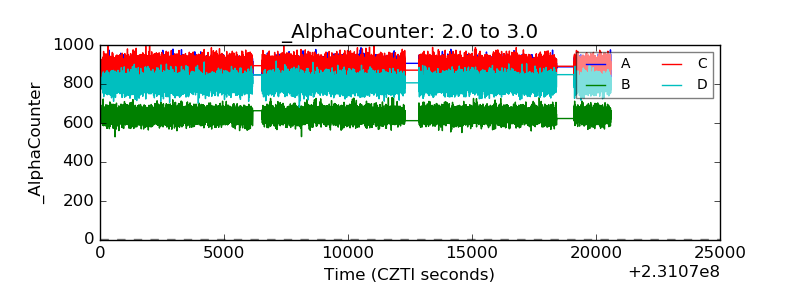 |
| _CPM_Rate | 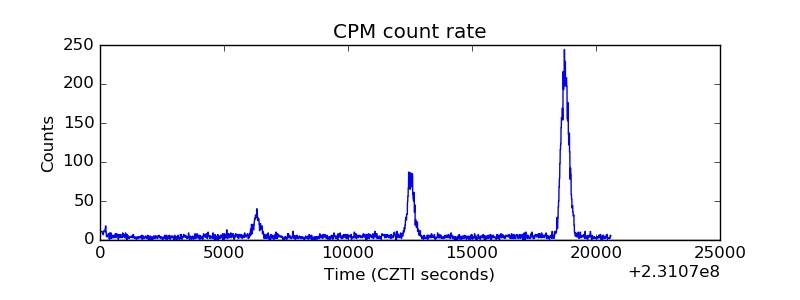 |
| CZT Counter | 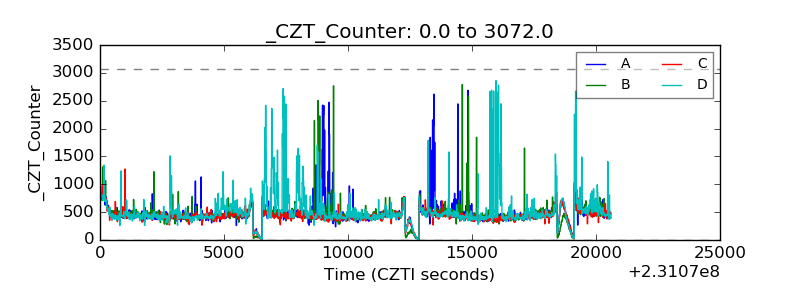 |
| +2.5 Volts monitor |  |
| +5 Volts monitor |  |
| _ROLL_ROT | 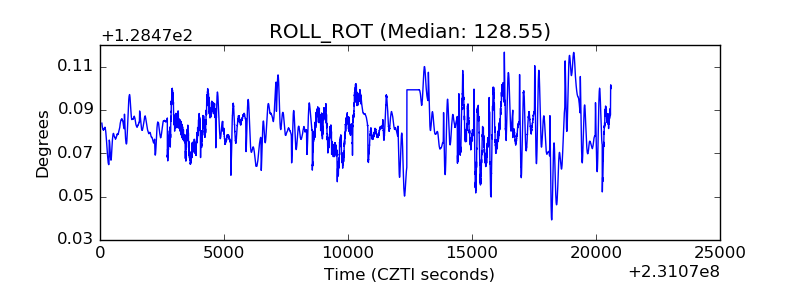 |
| _Roll_DEC | 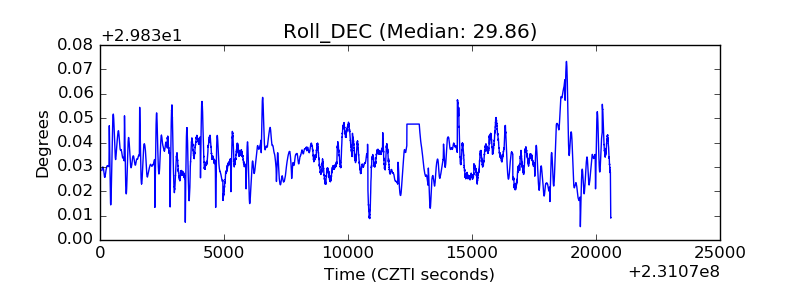 |
| _Roll_RA | 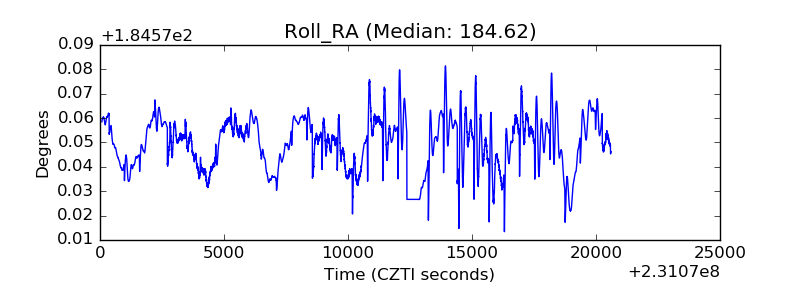 |
| Veto Counter | 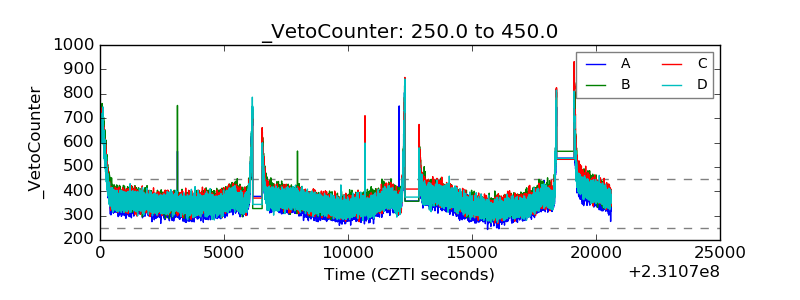 |