| Param | Original file | Final file |
|---|---|---|
| Filename | modeM0/AS1G07_060T01_9000001200_08563cztM0_level2.evt | modeM0/AS1G07_060T01_9000001200_08563cztM0_level2_quad_clean.evt |
| Size (bytes) | 440,415,360 | 92,185,920 |
| Size | 420.0 MB | 87.9 MB |
| Events in quadrant A | 3,308,859 | 587,747 |
| Events in quadrant B | 3,276,596 | 591,667 |
| Events in quadrant C | 2,932,407 | 585,875 |
| Events in quadrant D | 3,371,223 | 566,275 |
| Mode SS | |||
|---|---|---|---|
| Quadrant | BADHDUFLAG | Total packets | Discarded packets |
| A | 0 | 134 | 0 |
| B | 0 | 134 | 0 |
| C | 0 | 134 | 0 |
| D | 0 | 134 | 0 |
| Mode M0 | |||
|---|---|---|---|
| Quadrant | BADHDUFLAG | Total packets | Discarded packets |
| A | 0 | 14497 | 2 |
| B | 0 | 14208 | 1 |
| C | 0 | 13397 | 1 |
| D | 0 | 14806 | 1 |
| Mode M9 | |||
|---|---|---|---|
| Quadrant | BADHDUFLAG | Total packets | Discarded packets |
| A | 0 | 9 | 0 |
| B | 0 | 9 | 0 |
| C | 0 | 9 | 0 |
| D | 0 | 9 | 0 |
| Quadrant | Total seconds | Saturated seconds | Saturation percentage |
|---|---|---|---|
| A | 6599 | 102 | 1.545689% |
| B | 6599 | 110 | 1.666919% |
| C | 6599 | 38 | 0.575845% |
| D | 6599 | 143 | 2.166995% |
Noise dominated data is calculated using 1-second bins in cleaned event files. If a bin has >2000 counts, and if more than 50% of those come from <1% of pixels, then it is considered to be noise-dominated and hence unusable.
| Quadrant | # 1 sec bins | Bins with >0 counts | Bins with >2000 counts | High rate bins dominated by noise | Noise dominated (total time) | Noise dominated (detector-on time) | Marked lightcurve |
|---|---|---|---|---|---|---|---|
| A | 7499 | 6599 | 36 | 36 | 0.48% | 0.55% | 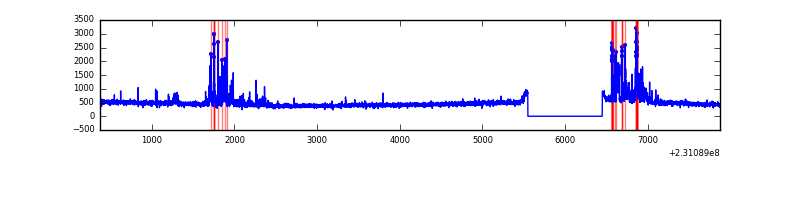 |
| B | 7499 | 6599 | 49 | 49 | 0.65% | 0.74% | 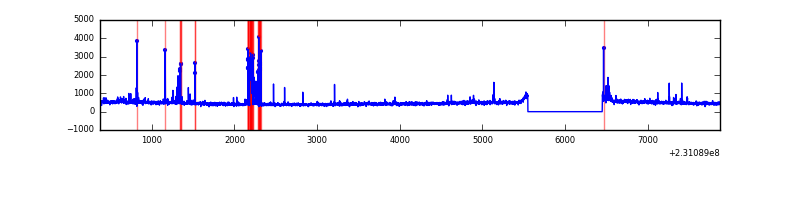 |
| C | 7499 | 6599 | 0 | 0 | 0.00% | 0.00% | 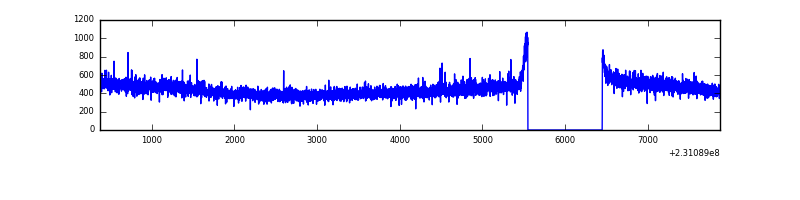 |
| D | 7499 | 6599 | 97 | 97 | 1.29% | 1.47% | 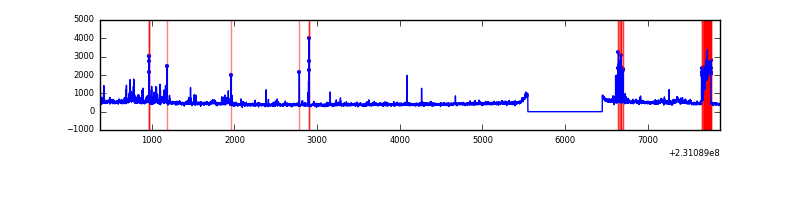 |
Top three noisy pixels from each quadrant. If the there are fewer than three noisy pixels in the level2.evt file, extra rows are filled as -1
| Pixel properties | Quadrant properties | ||||||
|---|---|---|---|---|---|---|---|
| Quadrant | DetID | PixID | Counts | Sigma | Mean | Median | Sigma |
| A | 15 | 223 | 262159 | 1666.04 | 764 | 745 | 156.9 |
| A | 15 | 239 | 95690 | 605.1 | 764 | 745 | 156.9 |
| A | 0 | 226 | 7035 | 40.09 | 764 | 745 | 156.9 |
| B | 10 | 16 | 236428 | 1602.39 | 765 | 746 | 147.1 |
| B | 0 | 214 | 35215 | 234.35 | 765 | 746 | 147.1 |
| B | 12 | 111 | 16618 | 107.91 | 765 | 746 | 147.1 |
| C | 13 | 61 | 5636 | 27.92 | 750 | 753 | 174.9 |
| C | 8 | 222 | 3873 | 17.84 | 750 | 753 | 174.9 |
| C | 9 | 54 | 3339 | 14.78 | 750 | 753 | 174.9 |
| D | 7 | 71 | 212558 | 1168.33 | 744 | 724 | 181.3 |
| D | 14 | 34 | 116908 | 640.79 | 744 | 724 | 181.3 |
| D | 1 | 52 | 88292 | 482.97 | 744 | 724 | 181.3 |
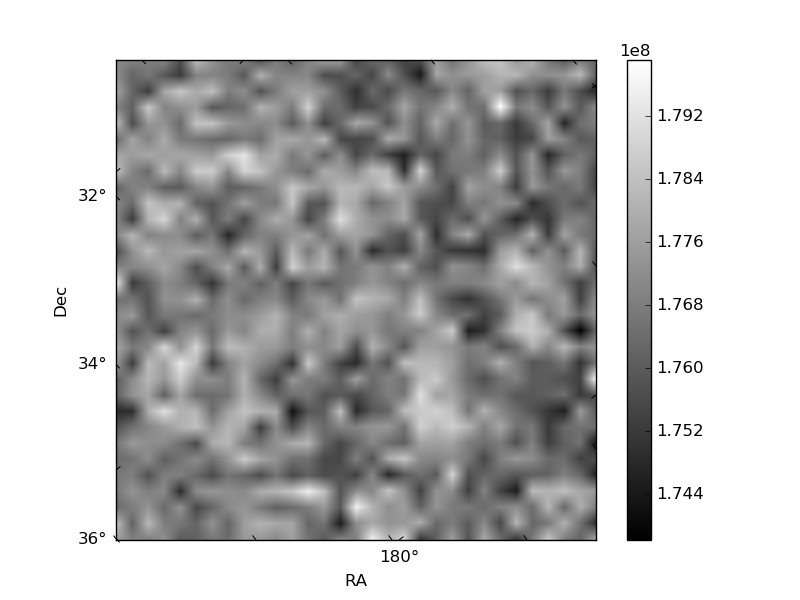
Histogram calculated using DETX and DETY for each event in the final _common_clean file
| Quadrant A | 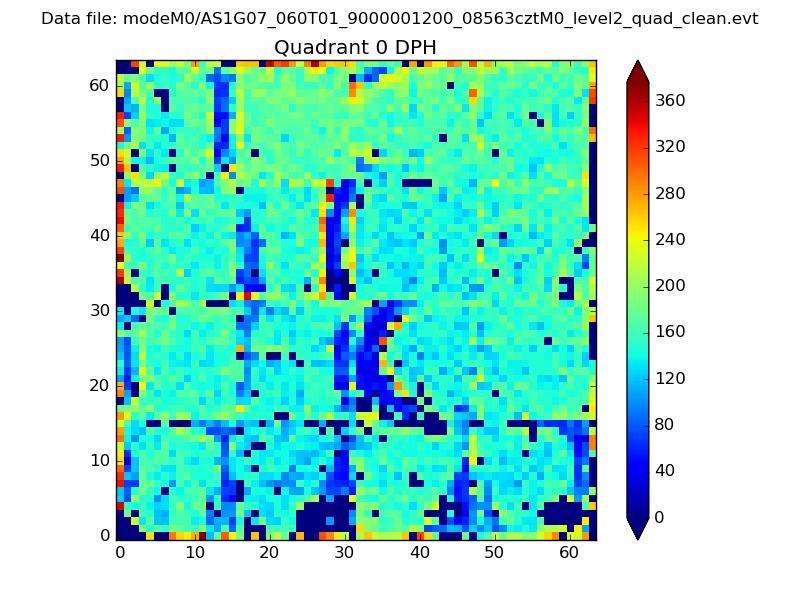 |
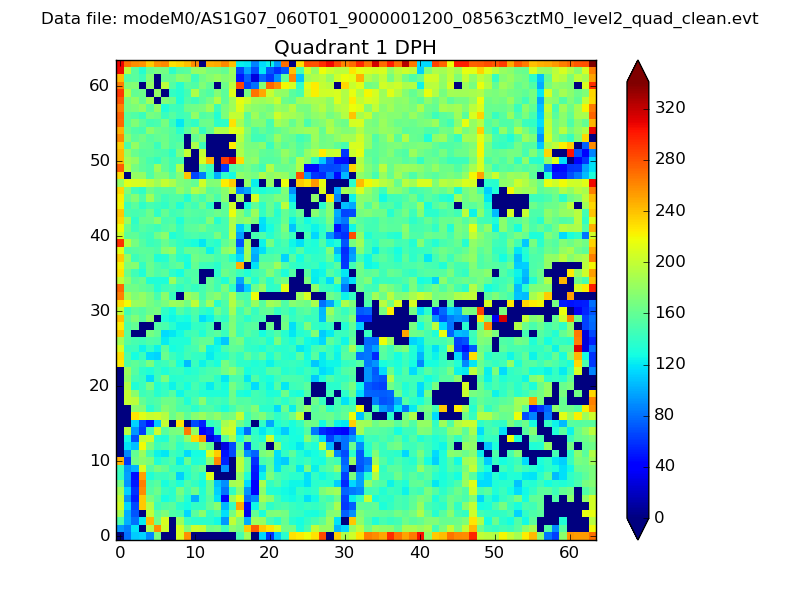 |
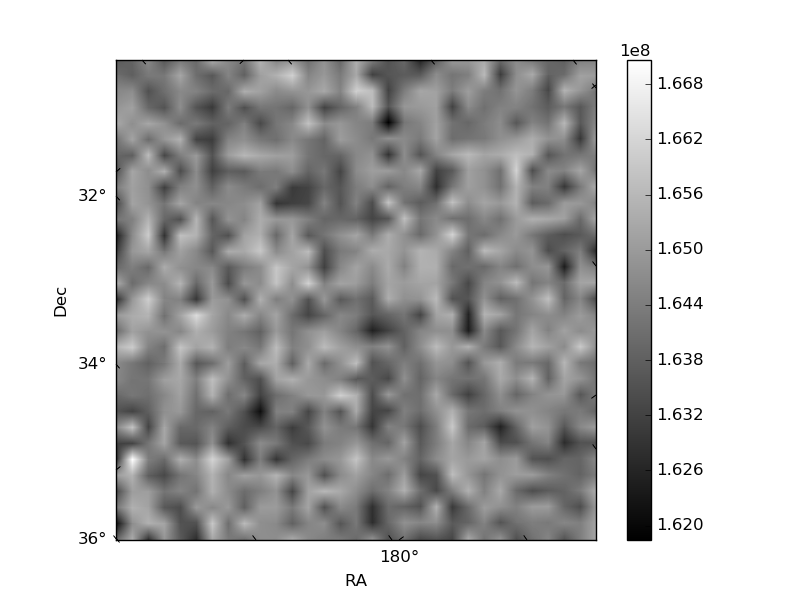
Quadrant B |
|---|---|---|---|
| Quadrant D | 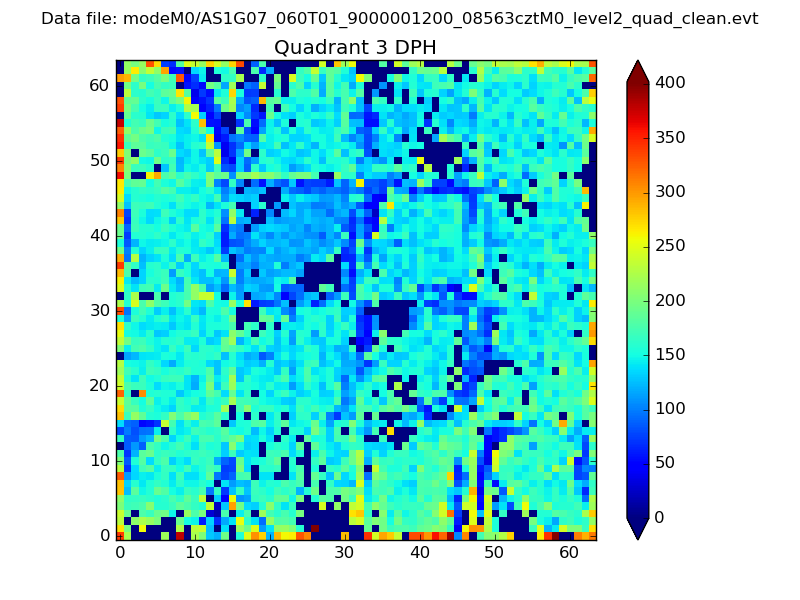 |
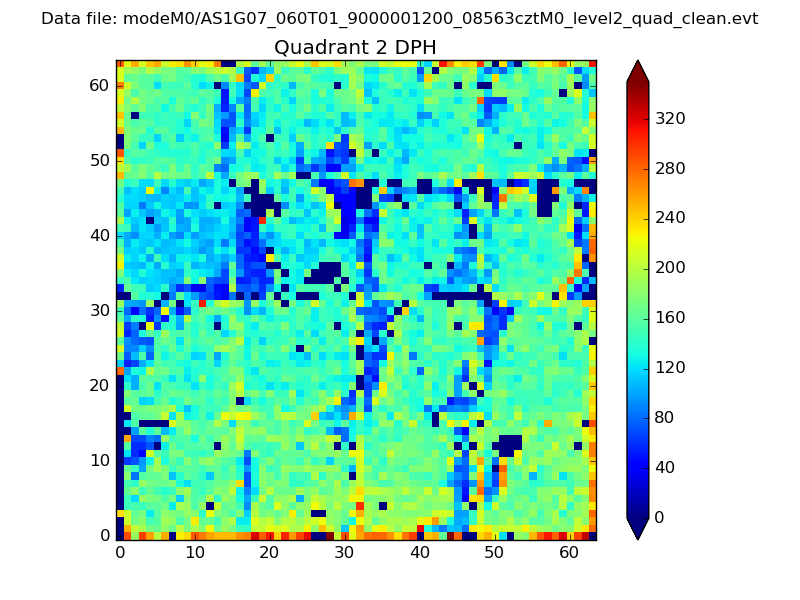 |
Quadrant C |
| Plot type | Count rate plots | Images |
|---|---|---|
| Comparison with Poisson distribution Blue bars denote a histogram of data divided into 1 sec bins. Red curve is a Poisson curve with rate = median count rate of data. |
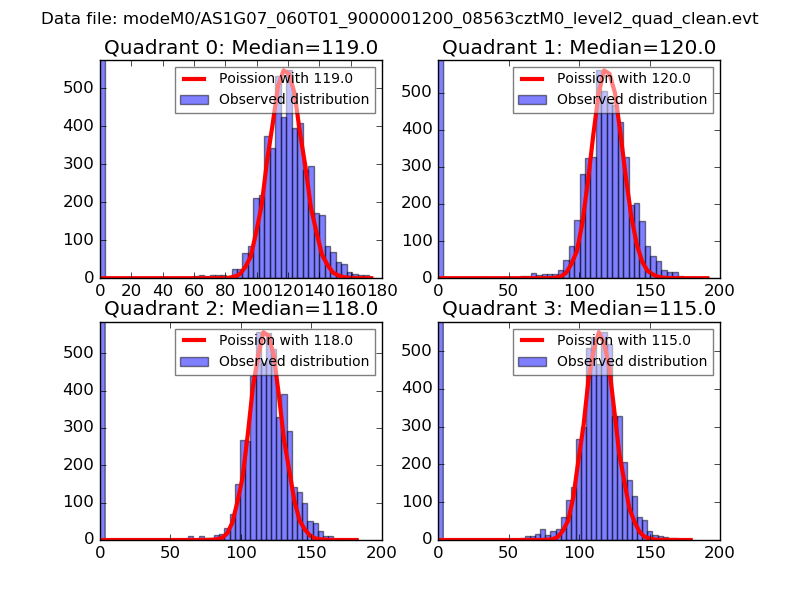 |
 |
| Quadrant-wise count rates Data is divided into 100 sec bins |
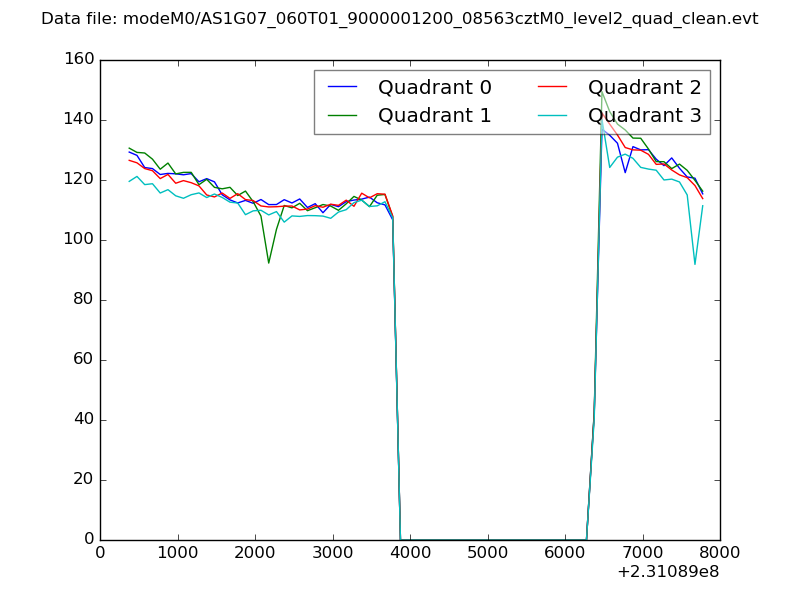 |
|
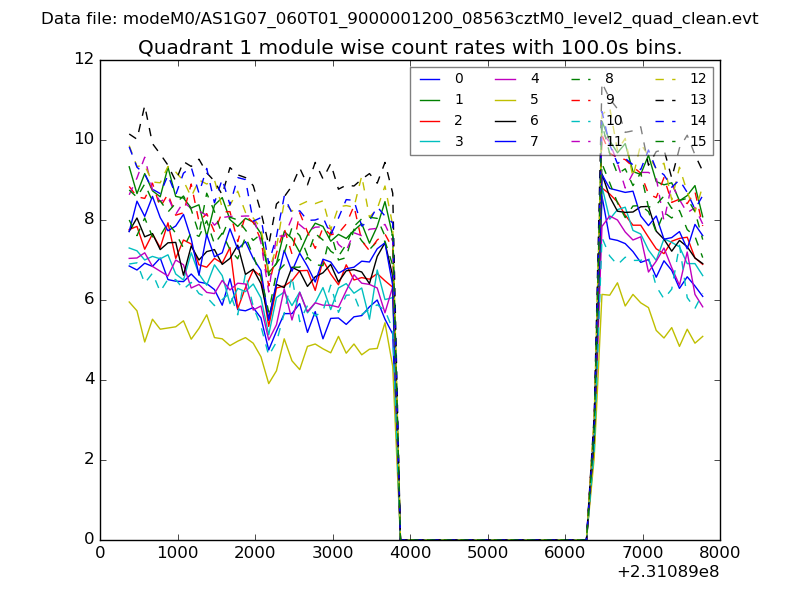
| Module-wise count rates for Quadrant A Data is divided into 100 sec bins |
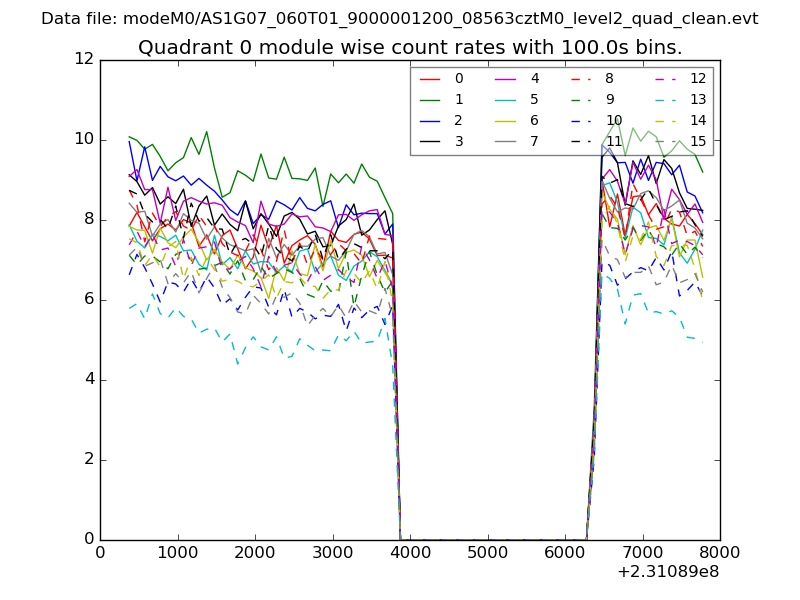 |
 |
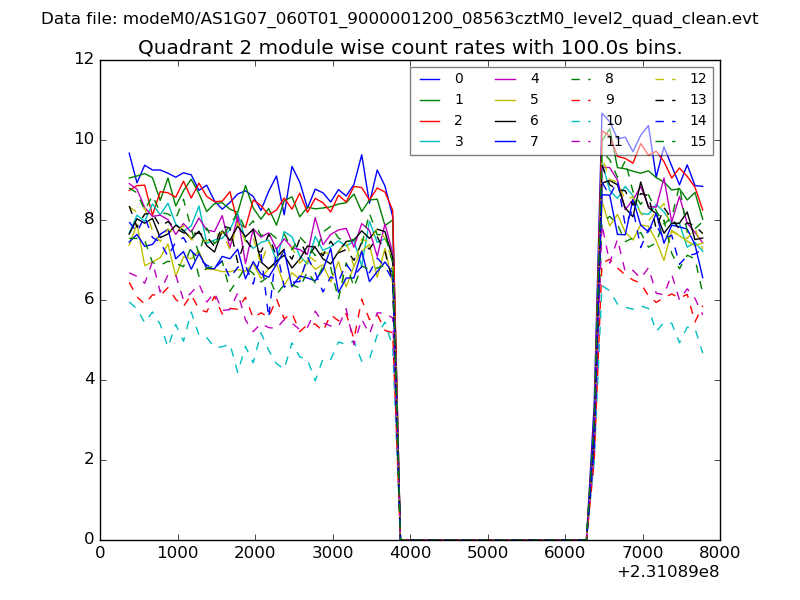
| Module-wise count rates for Quadrant B Data is divided into 100 sec bins |
 |
 |
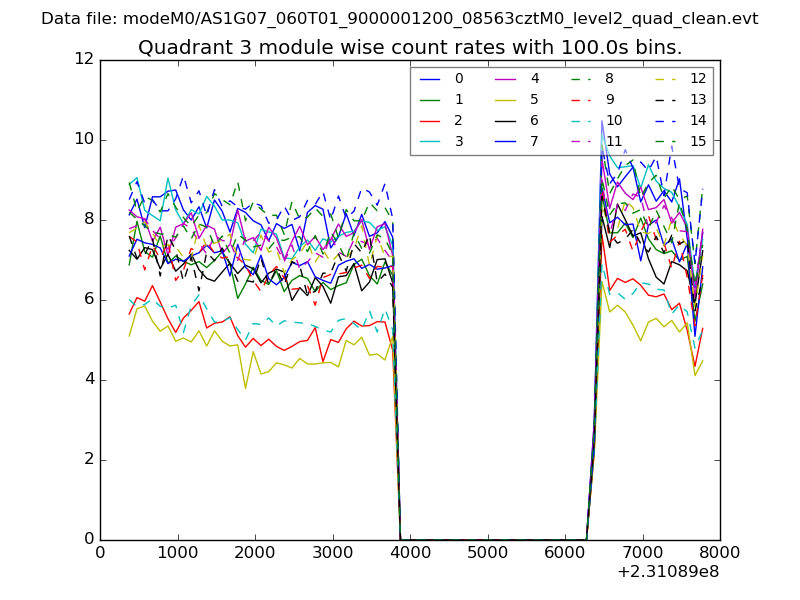
| Module-wise count rates for Quadrant C Data is divided into 100 sec bins |
 |
 |
| Module-wise count rates for Quadrant D Data is divided into 100 sec bins |
 |
 |
| Parameter | Plot |
|---|---|
| CZT HV Monitor | 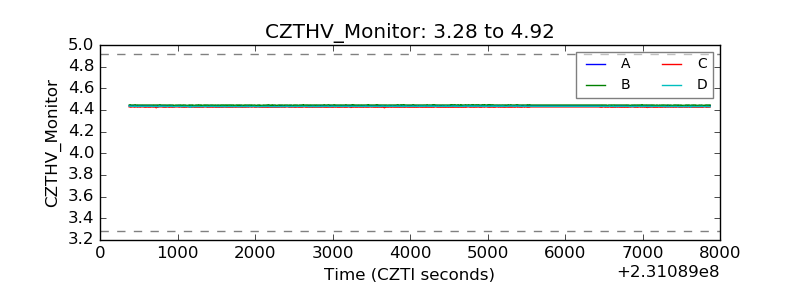 |
| D_VDD | 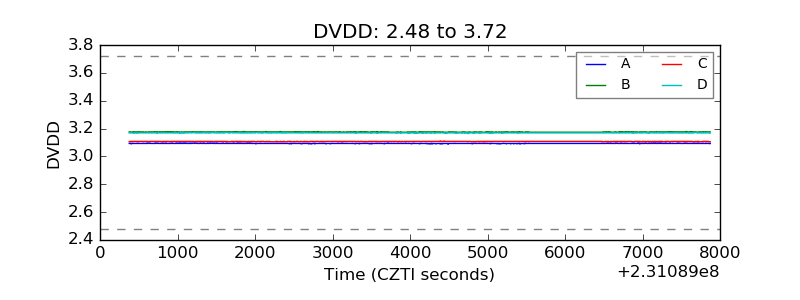 |
| Temperature 1 | 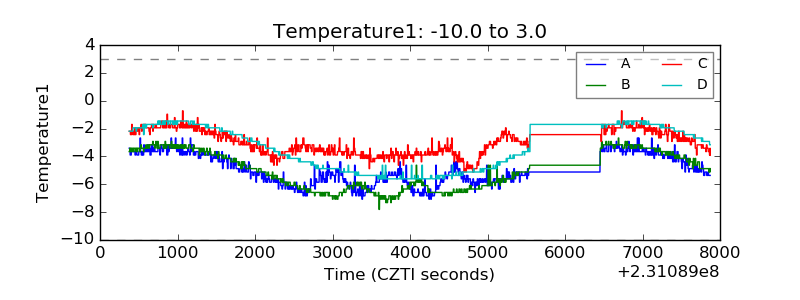 |
| Veto HV Monitor |  |
| Veto LLD | 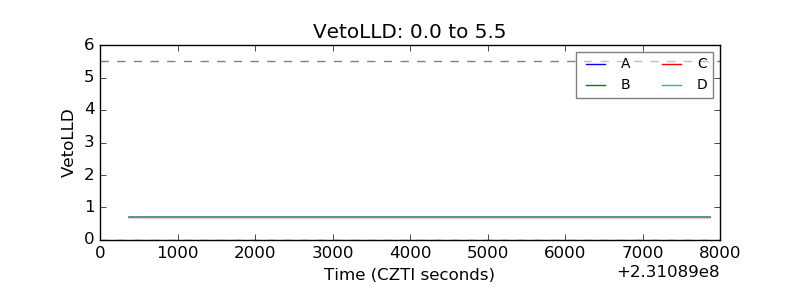 |
| Alpha Counter | 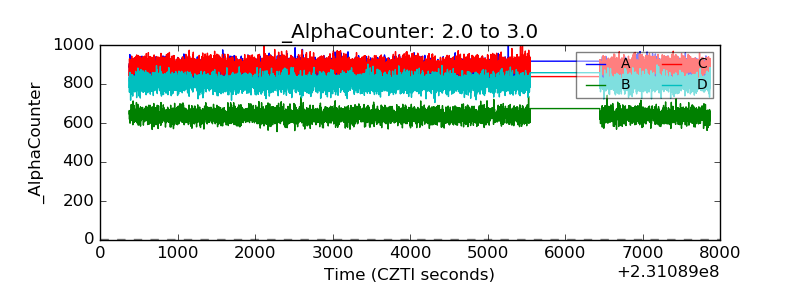 |
| _CPM_Rate | 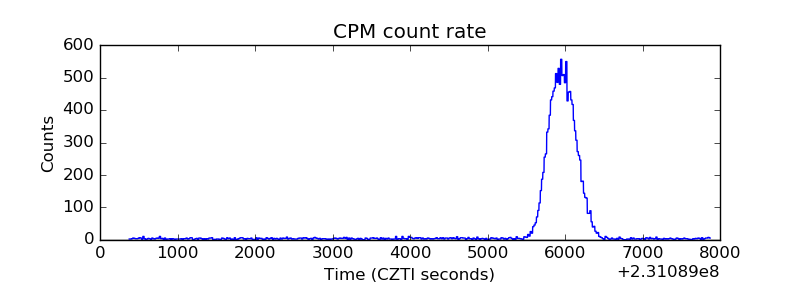 |
| CZT Counter | 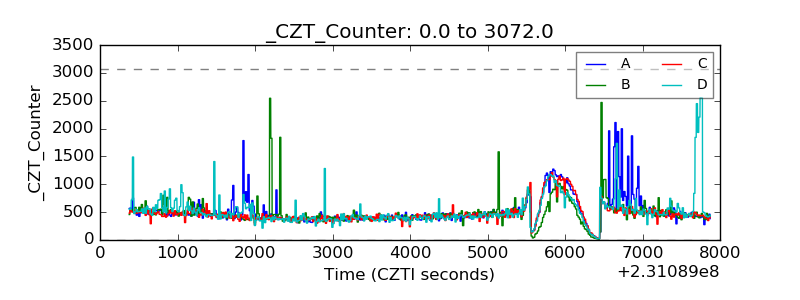 |
| +2.5 Volts monitor |  |
| +5 Volts monitor |  |
| _ROLL_ROT | 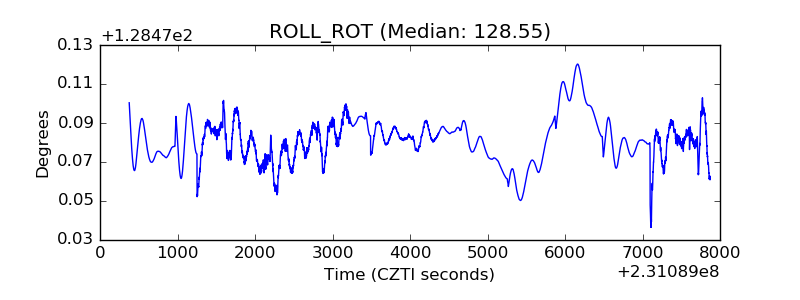 |
| _Roll_DEC | 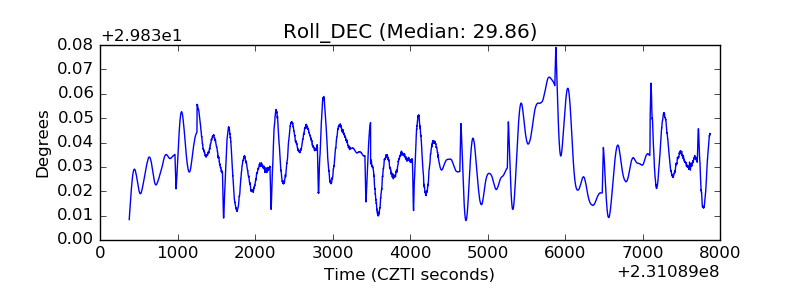 |
| _Roll_RA |  |
| Veto Counter | 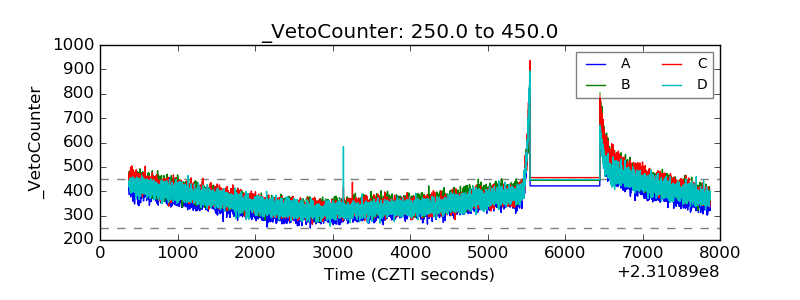 |