| Param | Original file | Final file |
|---|---|---|
| Filename | modeM0/AS1G07_060T01_9000001200_08564cztM0_level2.evt | modeM0/AS1G07_060T01_9000001200_08564cztM0_level2_quad_clean.evt |
| Size (bytes) | 442,782,720 | 88,018,560 |
| Size | 422.3 MB | 83.9 MB |
| Events in quadrant A | 3,151,893 | 556,251 |
| Events in quadrant B | 3,196,643 | 563,786 |
| Events in quadrant C | 2,901,734 | 559,642 |
| Events in quadrant D | 3,721,441 | 536,425 |
| Mode SS | |||
|---|---|---|---|
| Quadrant | BADHDUFLAG | Total packets | Discarded packets |
| A | 0 | 130 | 0 |
| B | 0 | 130 | 0 |
| C | 0 | 130 | 0 |
| D | 0 | 130 | 0 |
| Mode M0 | |||
|---|---|---|---|
| Quadrant | BADHDUFLAG | Total packets | Discarded packets |
| A | 0 | 13992 | 3 |
| B | 0 | 13865 | 2 |
| C | 0 | 13204 | 2 |
| D | 0 | 15575 | 2 |
| Mode M9 | |||
|---|---|---|---|
| Quadrant | BADHDUFLAG | Total packets | Discarded packets |
| A | 0 | 14 | 0 |
| B | 0 | 14 | 0 |
| C | 0 | 14 | 0 |
| D | 0 | 15 | 0 |
| Quadrant | Total seconds | Saturated seconds | Saturation percentage |
|---|---|---|---|
| A | 6444 | 87 | 1.350093% |
| B | 6444 | 68 | 1.055245% |
| C | 6444 | 32 | 0.496586% |
| D | 6444 | 181 | 2.808814% |
Noise dominated data is calculated using 1-second bins in cleaned event files. If a bin has >2000 counts, and if more than 50% of those come from <1% of pixels, then it is considered to be noise-dominated and hence unusable.
| Quadrant | # 1 sec bins | Bins with >0 counts | Bins with >2000 counts | High rate bins dominated by noise | Noise dominated (total time) | Noise dominated (detector-on time) | Marked lightcurve |
|---|---|---|---|---|---|---|---|
| A | 7494 | 6446 | 27 | 27 | 0.36% | 0.42% | 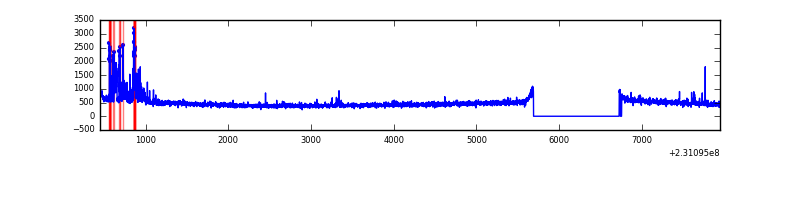 |
| B | 7494 | 6446 | 15 | 15 | 0.20% | 0.23% | 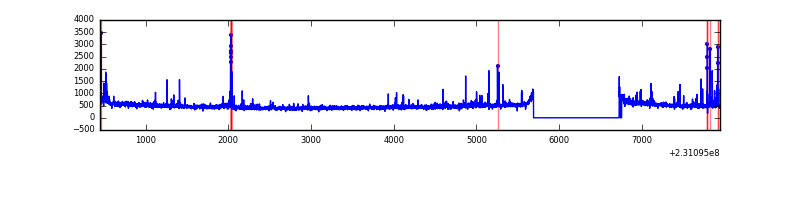 |
| C | 7494 | 6446 | 0 | 0 | 0.00% | 0.00% | 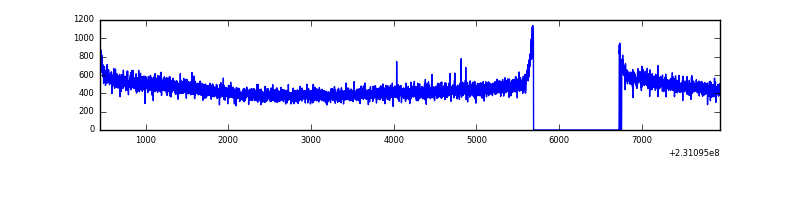 |
| D | 7494 | 6446 | 137 | 137 | 1.83% | 2.13% | 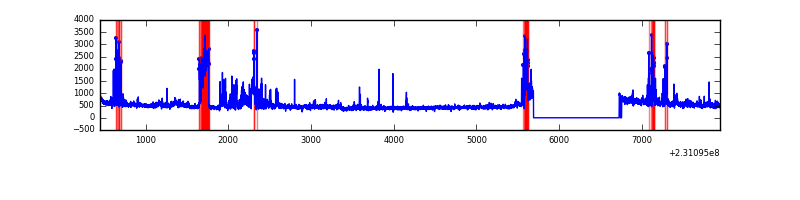 |
Top three noisy pixels from each quadrant. If the there are fewer than three noisy pixels in the level2.evt file, extra rows are filled as -1
| Pixel properties | Quadrant properties | ||||||
|---|---|---|---|---|---|---|---|
| Quadrant | DetID | PixID | Counts | Sigma | Mean | Median | Sigma |
| A | 15 | 223 | 169611 | 1085.64 | 757 | 741 | 155.5 |
| A | 15 | 239 | 60432 | 383.74 | 757 | 741 | 155.5 |
| A | 13 | 14 | 7631 | 44.29 | 757 | 741 | 155.5 |
| B | 10 | 16 | 138539 | 944.22 | 760 | 739 | 145.9 |
| B | 0 | 214 | 31211 | 208.79 | 760 | 739 | 145.9 |
| B | 4 | 97 | 22382 | 148.3 | 760 | 739 | 145.9 |
| C | 13 | 61 | 5420 | 27.09 | 743 | 747 | 172.5 |
| C | 8 | 222 | 2753 | 11.63 | 743 | 747 | 172.5 |
| C | 3 | 202 | 1906 | 6.72 | 743 | 747 | 172.5 |
| D | 1 | 52 | 414521 | 2282.15 | 731 | 709 | 181.3 |
| D | 7 | 71 | 291649 | 1604.52 | 731 | 709 | 181.3 |
| D | 12 | 233 | 126724 | 694.97 | 731 | 709 | 181.3 |
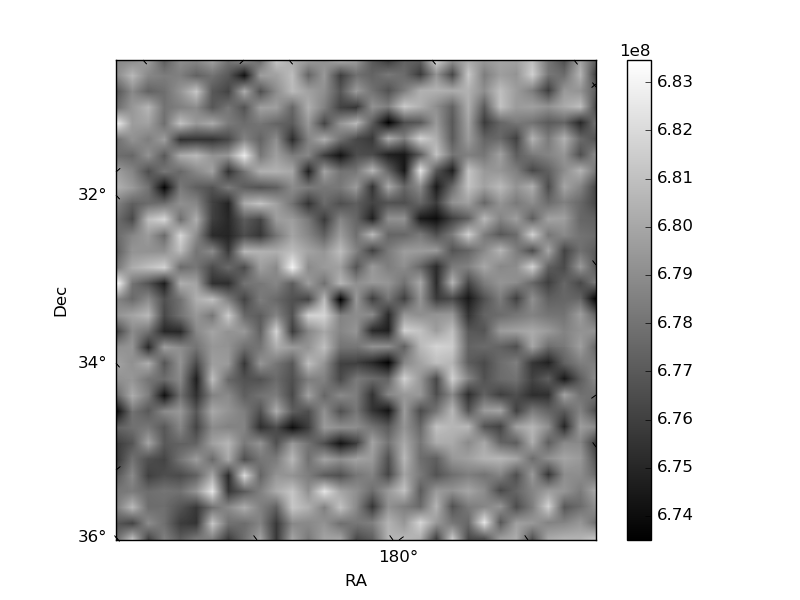
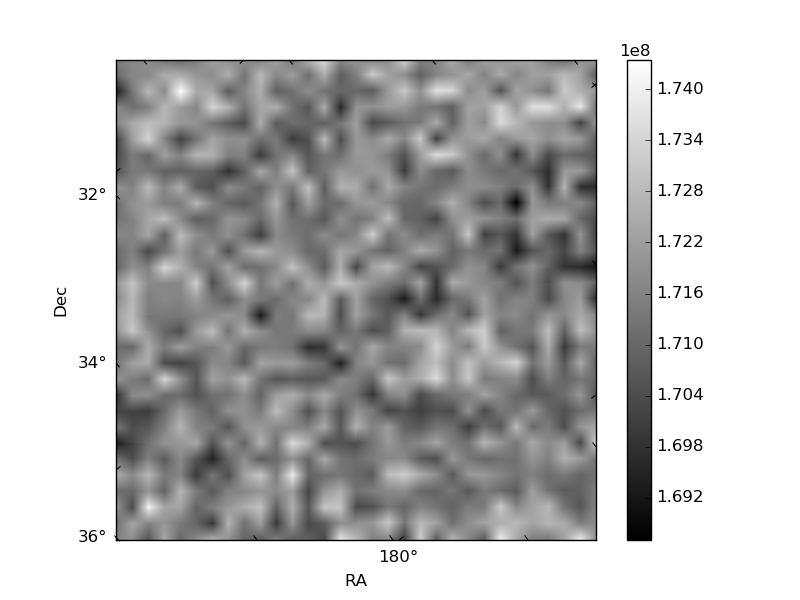
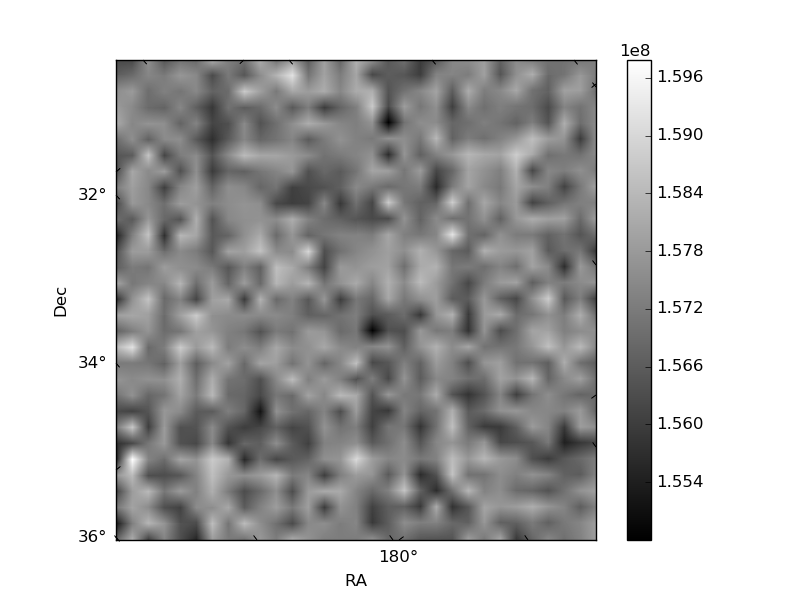
Histogram calculated using DETX and DETY for each event in the final _common_clean file
| Quadrant A | 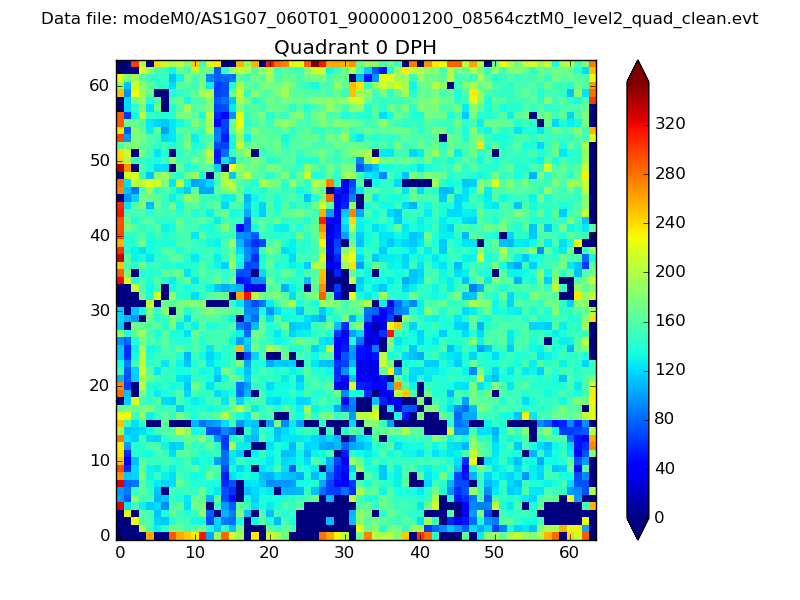 |
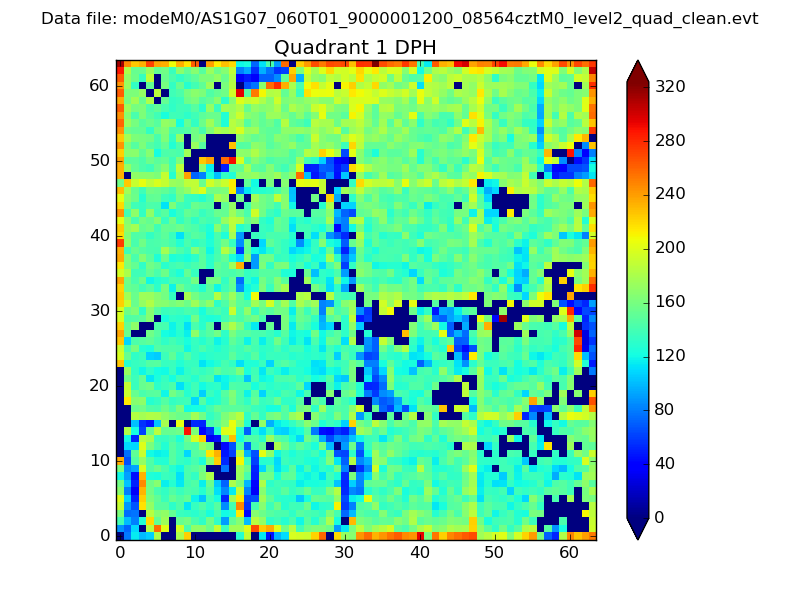 |
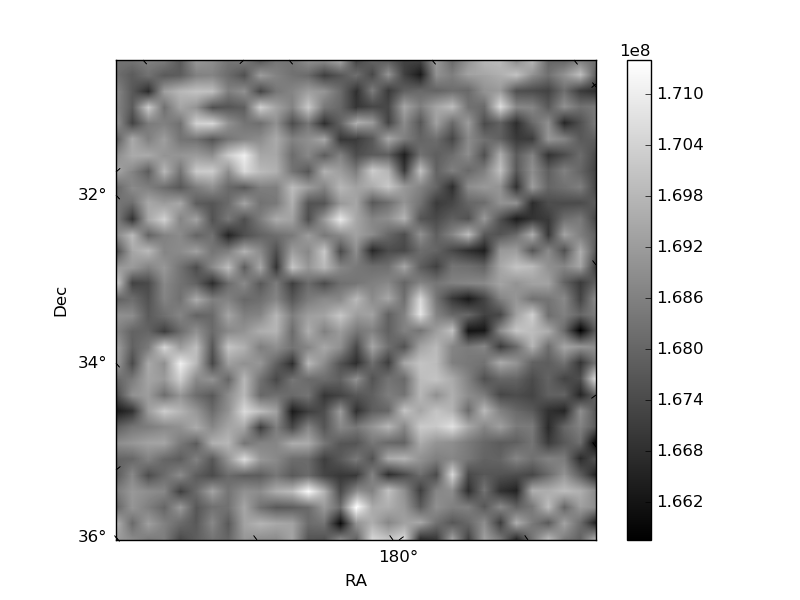
Quadrant B |
|---|---|---|---|
| Quadrant D | 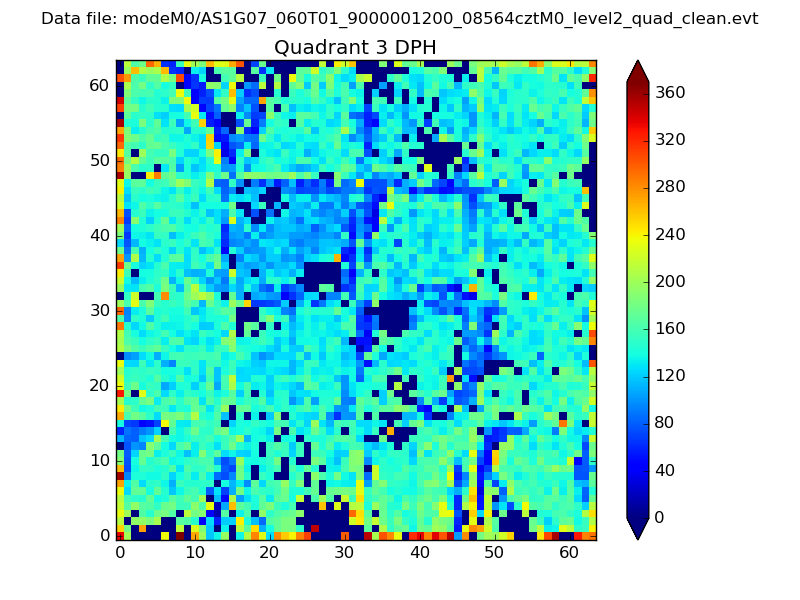 |
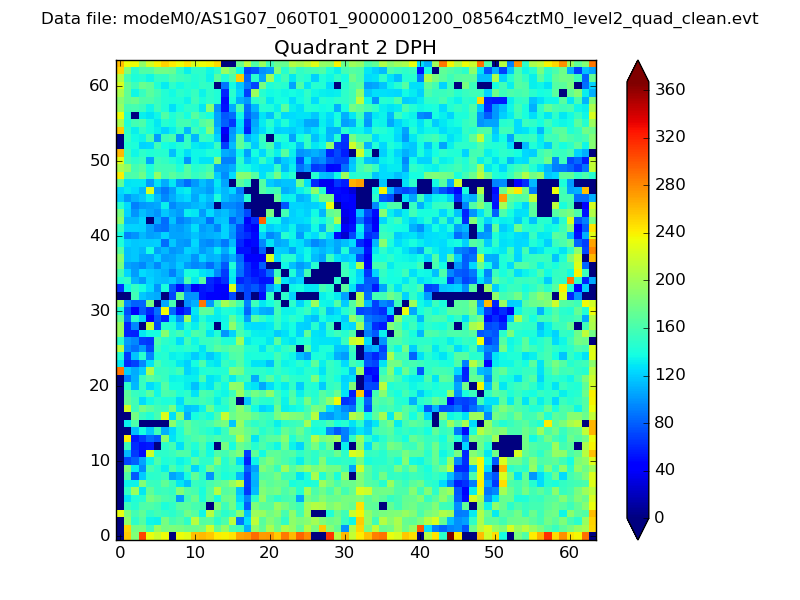 |
Quadrant C |
| Plot type | Count rate plots | Images |
|---|---|---|
| Comparison with Poisson distribution Blue bars denote a histogram of data divided into 1 sec bins. Red curve is a Poisson curve with rate = median count rate of data. |
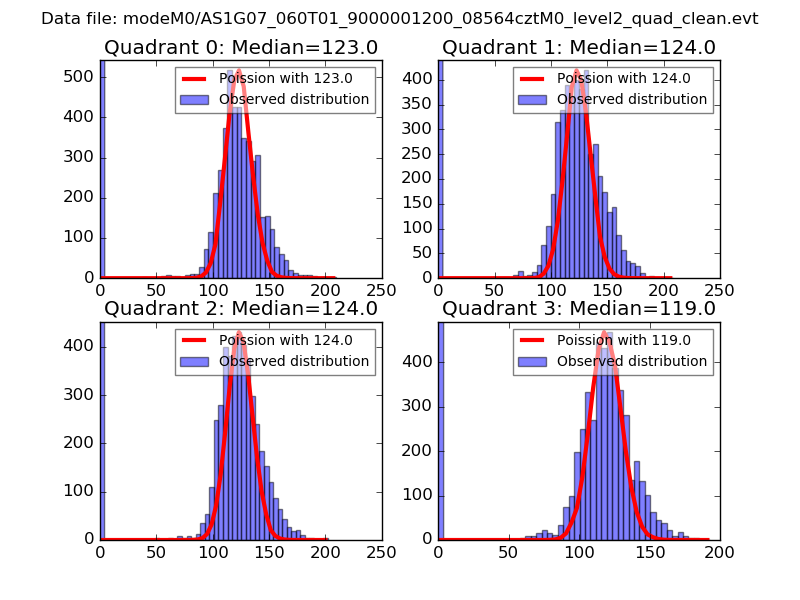 |
 |
| Quadrant-wise count rates Data is divided into 100 sec bins |
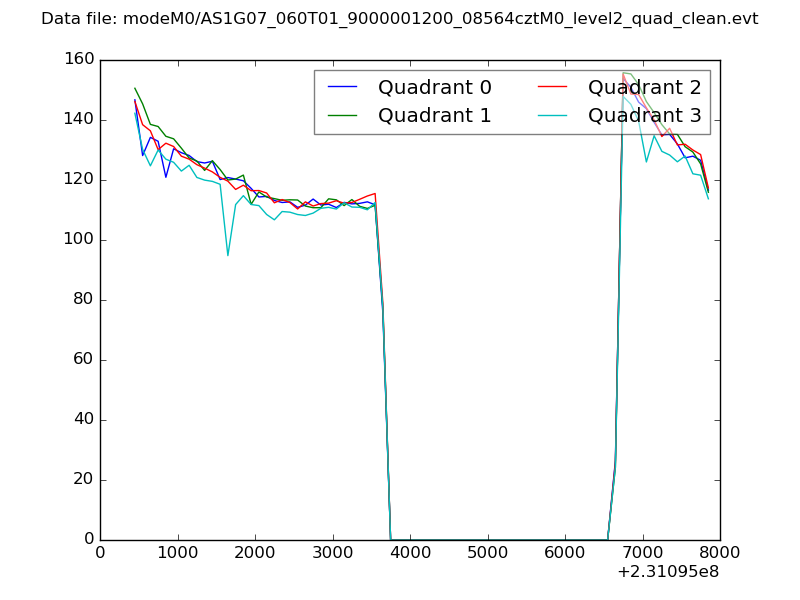 |
|
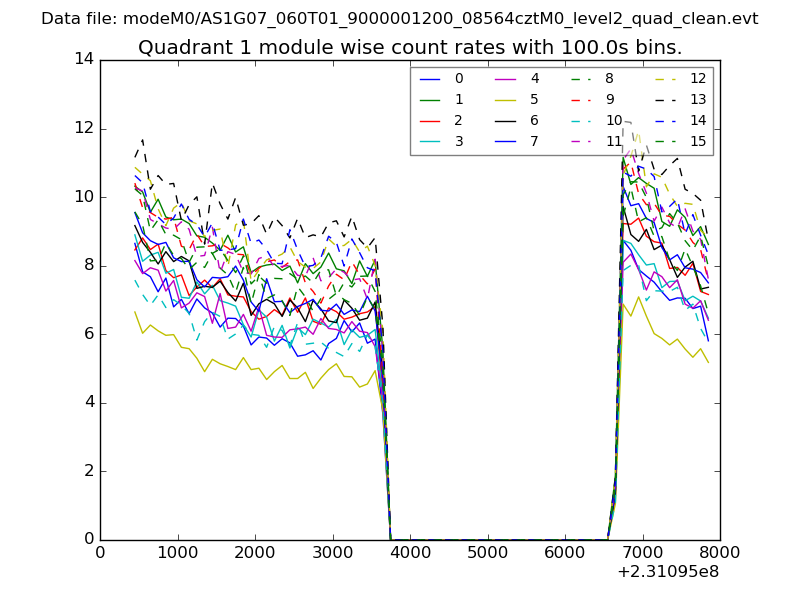
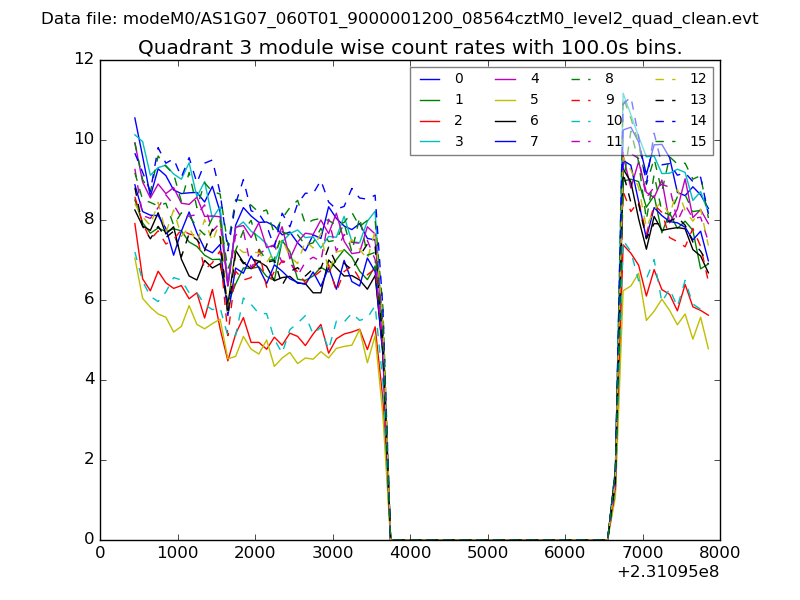
| Module-wise count rates for Quadrant A Data is divided into 100 sec bins |
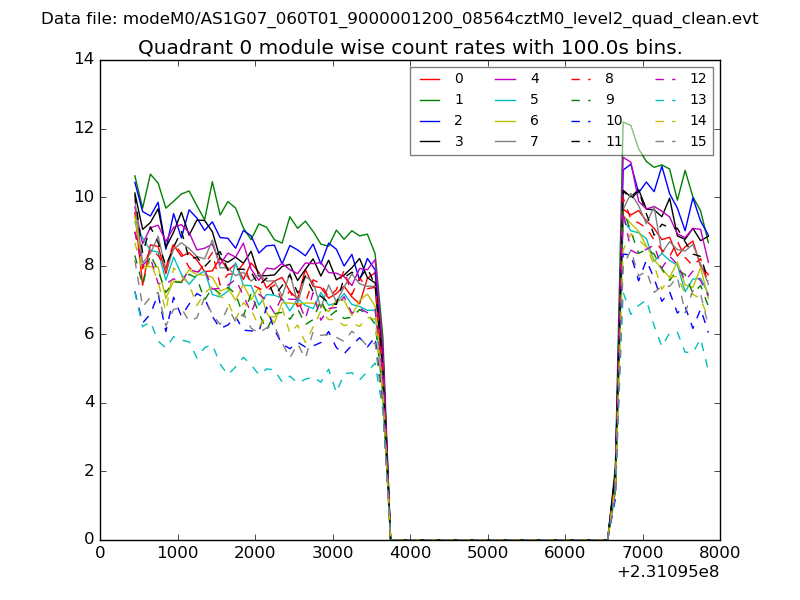 |
 |
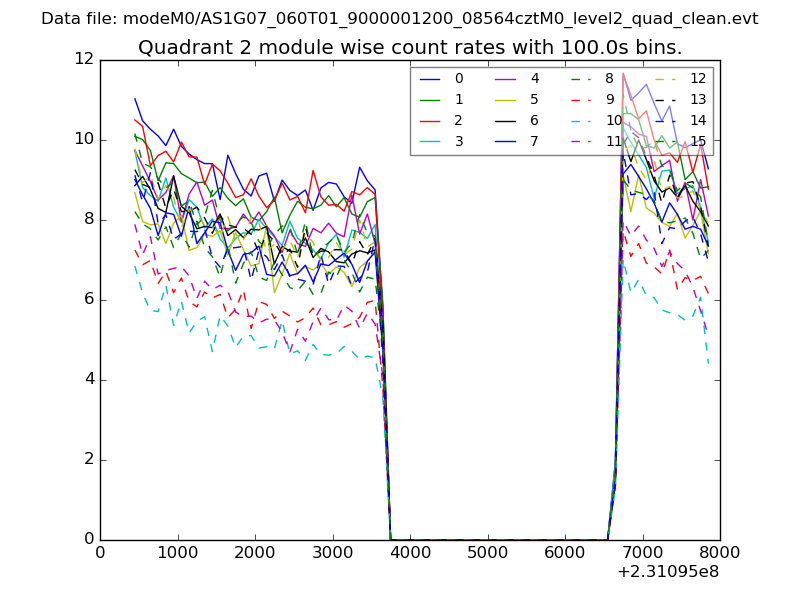
| Module-wise count rates for Quadrant B Data is divided into 100 sec bins |
 |
 |
| Module-wise count rates for Quadrant C Data is divided into 100 sec bins |
 |
 |
| Module-wise count rates for Quadrant D Data is divided into 100 sec bins |
 |
 |
| Parameter | Plot |
|---|---|
| CZT HV Monitor | 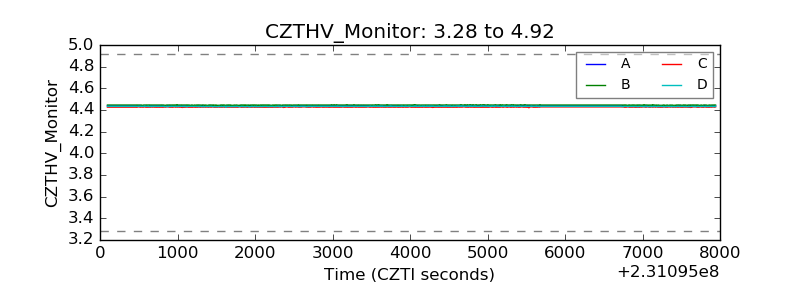 |
| D_VDD | 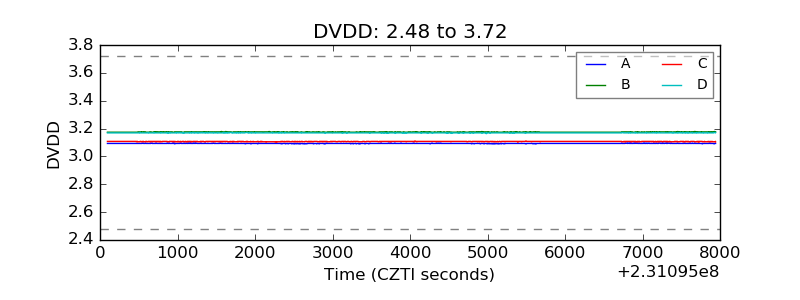 |
| Temperature 1 |  |
| Veto HV Monitor | 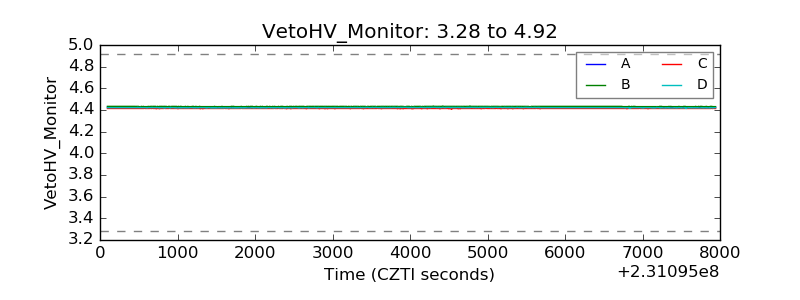 |
| Veto LLD | 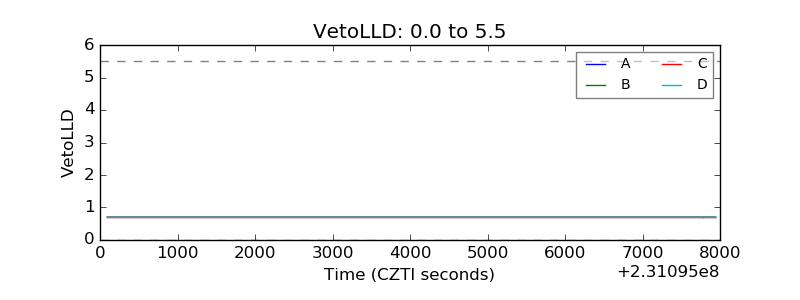 |
| Alpha Counter | 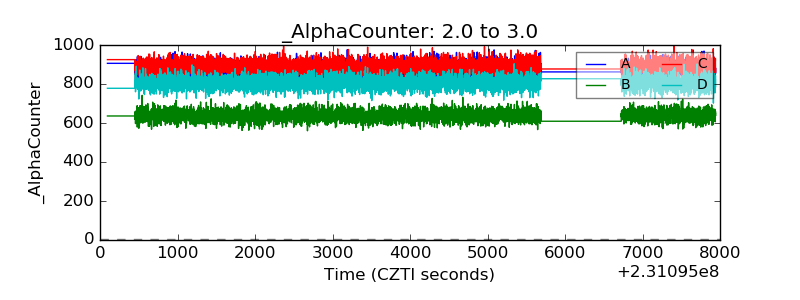 |
| _CPM_Rate | 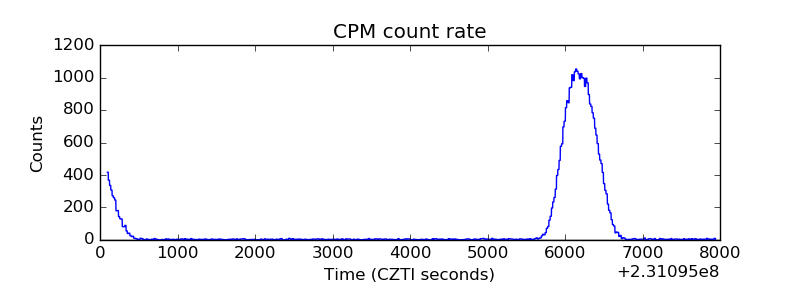 |
| CZT Counter | 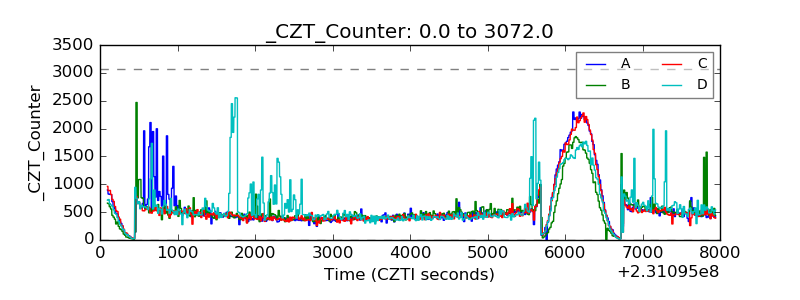 |
| +2.5 Volts monitor |  |
| +5 Volts monitor |  |
| _ROLL_ROT | 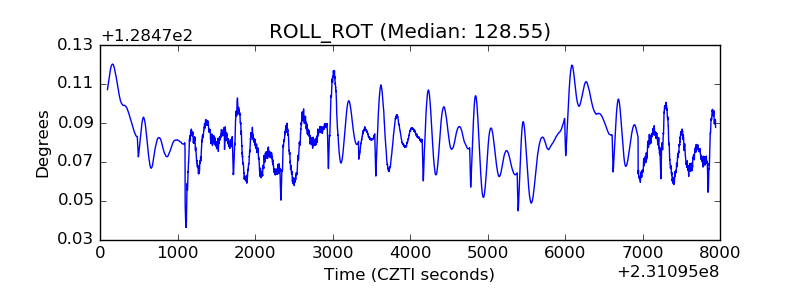 |
| _Roll_DEC | 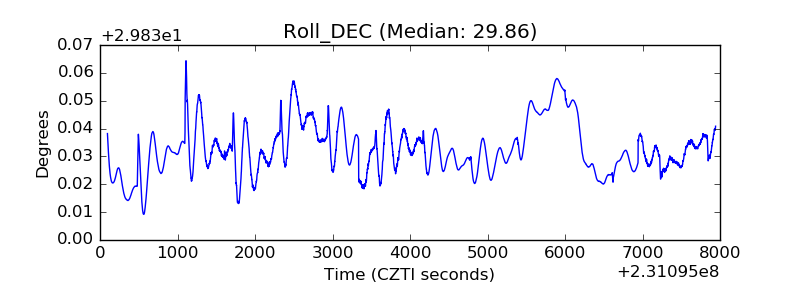 |
| _Roll_RA | 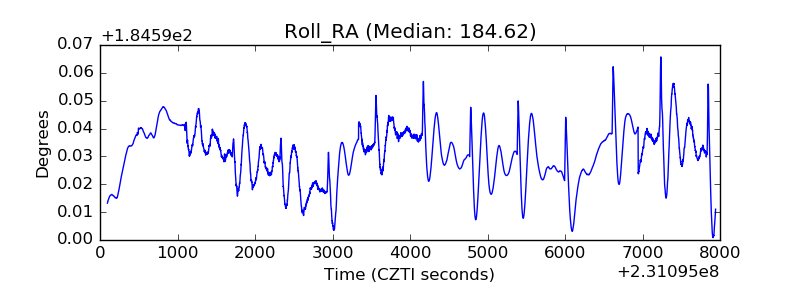 |
| Veto Counter | 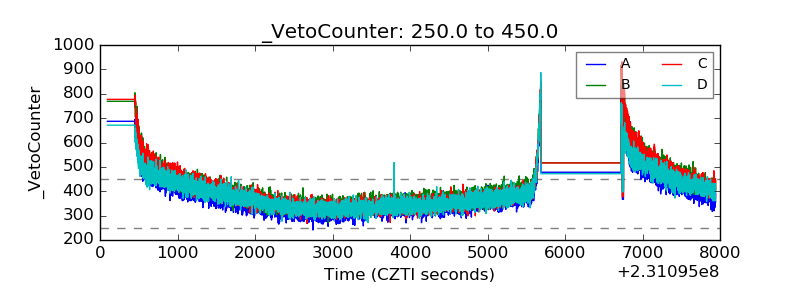 |