| Param | Original file | Final file |
|---|---|---|
| Filename | modeM0/AS1G07_060T01_9000001200_08568cztM0_level2.evt | modeM0/AS1G07_060T01_9000001200_08568cztM0_level2_quad_clean.evt |
| Size (bytes) | 424,255,680 | 87,595,200 |
| Size | 404.6 MB | 83.5 MB |
| Events in quadrant A | 2,909,802 | 559,244 |
| Events in quadrant B | 3,224,847 | 572,277 |
| Events in quadrant C | 2,855,360 | 560,027 |
| Events in quadrant D | 3,434,463 | 525,871 |
| Mode SS | |||
|---|---|---|---|
| Quadrant | BADHDUFLAG | Total packets | Discarded packets |
| A | 0 | 126 | 0 |
| B | 0 | 126 | 0 |
| C | 0 | 126 | 0 |
| D | 0 | 126 | 0 |
| Mode M0 | |||
|---|---|---|---|
| Quadrant | BADHDUFLAG | Total packets | Discarded packets |
| A | 0 | 12816 | 3 |
| B | 0 | 13674 | 2 |
| C | 0 | 12735 | 2 |
| D | 0 | 14521 | 2 |
| Mode M9 | |||
|---|---|---|---|
| Quadrant | BADHDUFLAG | Total packets | Discarded packets |
| A | 0 | 21 | 0 |
| B | 0 | 21 | 0 |
| C | 0 | 21 | 0 |
| D | 0 | 22 | 0 |
| Quadrant | Total seconds | Saturated seconds | Saturation percentage |
|---|---|---|---|
| A | 6238 | 15 | 0.240462% |
| B | 6238 | 57 | 0.913754% |
| C | 6238 | 7 | 0.112215% |
| D | 6238 | 165 | 2.645079% |
Noise dominated data is calculated using 1-second bins in cleaned event files. If a bin has >2000 counts, and if more than 50% of those come from <1% of pixels, then it is considered to be noise-dominated and hence unusable.
| Quadrant | # 1 sec bins | Bins with >0 counts | Bins with >2000 counts | High rate bins dominated by noise | Noise dominated (total time) | Noise dominated (detector-on time) | Marked lightcurve |
|---|---|---|---|---|---|---|---|
| A | 7573 | 6239 | 5 | 5 | 0.07% | 0.08% | 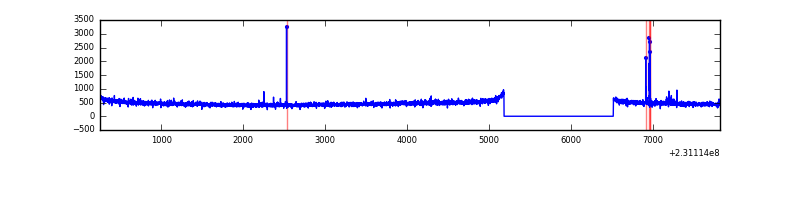 |
| B | 7573 | 6239 | 36 | 36 | 0.48% | 0.58% |  |
| C | 7573 | 6239 | 0 | 0 | 0.00% | 0.00% | 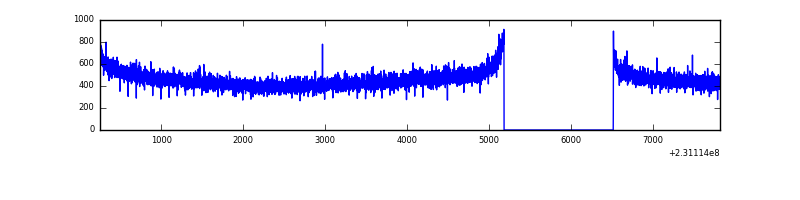 |
| D | 7573 | 6239 | 132 | 132 | 1.74% | 2.12% |  |
Top three noisy pixels from each quadrant. If the there are fewer than three noisy pixels in the level2.evt file, extra rows are filled as -1
| Pixel properties | Quadrant properties | ||||||
|---|---|---|---|---|---|---|---|
| Quadrant | DetID | PixID | Counts | Sigma | Mean | Median | Sigma |
| A | 15 | 223 | 17333 | 109.61 | 747 | 731 | 151.5 |
| A | 15 | 239 | 8692 | 52.56 | 747 | 731 | 151.5 |
| A | 0 | 226 | 7048 | 41.71 | 747 | 731 | 151.5 |
| B | 10 | 16 | 238810 | 1679.34 | 752 | 734 | 141.8 |
| B | 0 | 214 | 26470 | 181.53 | 752 | 734 | 141.8 |
| B | 4 | 97 | 16928 | 114.23 | 752 | 734 | 141.8 |
| C | 13 | 61 | 5530 | 28.28 | 731 | 735 | 169.6 |
| C | 8 | 222 | 2634 | 11.2 | 731 | 735 | 169.6 |
| C | 3 | 202 | 1833 | 6.47 | 731 | 735 | 169.6 |
| D | 1 | 52 | 568740 | 3274.04 | 706 | 687 | 173.5 |
| D | 12 | 233 | 56805 | 323.44 | 706 | 687 | 173.5 |
| D | 2 | 152 | 31542 | 177.84 | 706 | 687 | 173.5 |
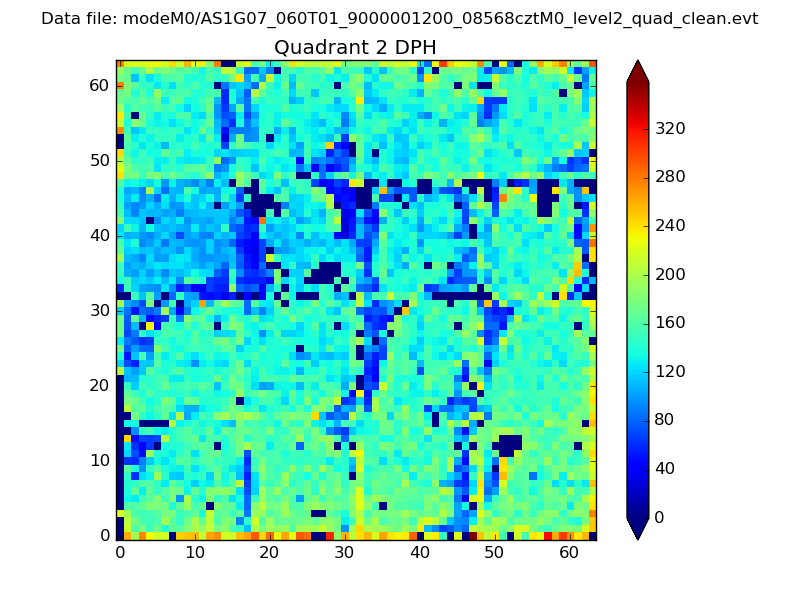
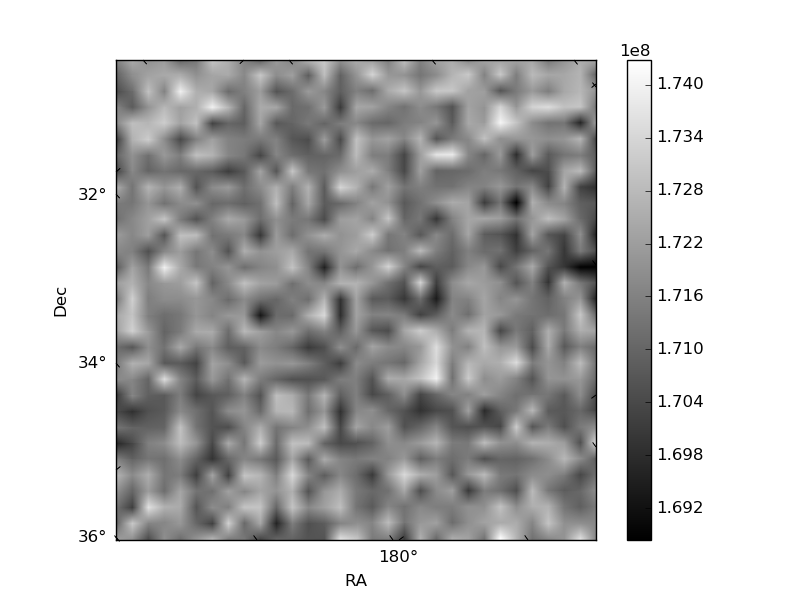
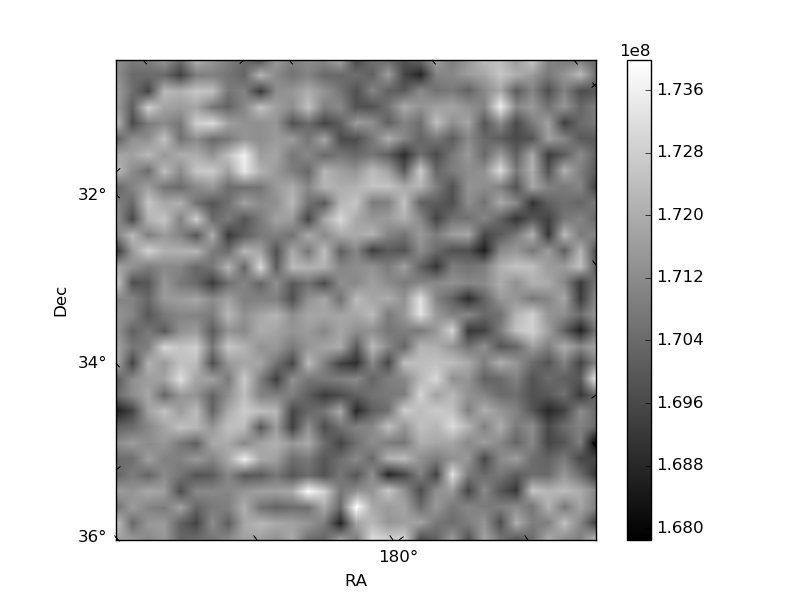
Histogram calculated using DETX and DETY for each event in the final _common_clean file
| Quadrant A | 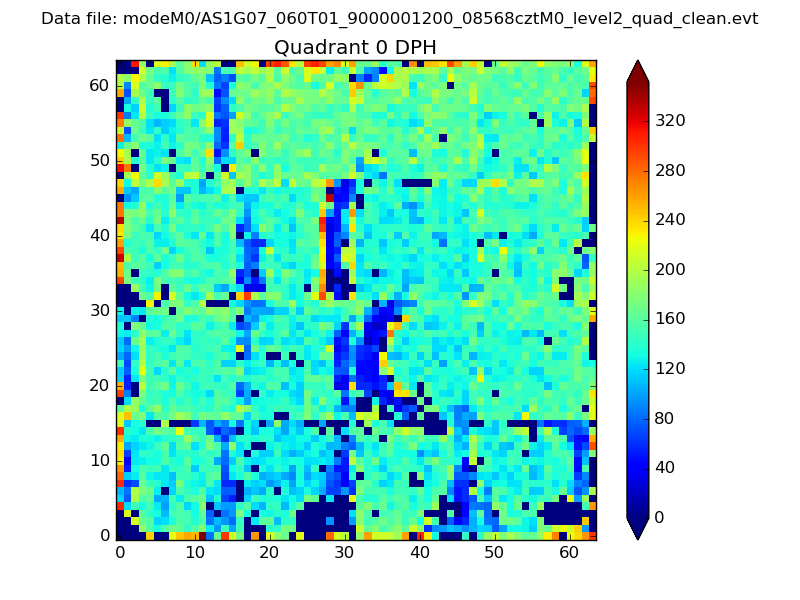 |
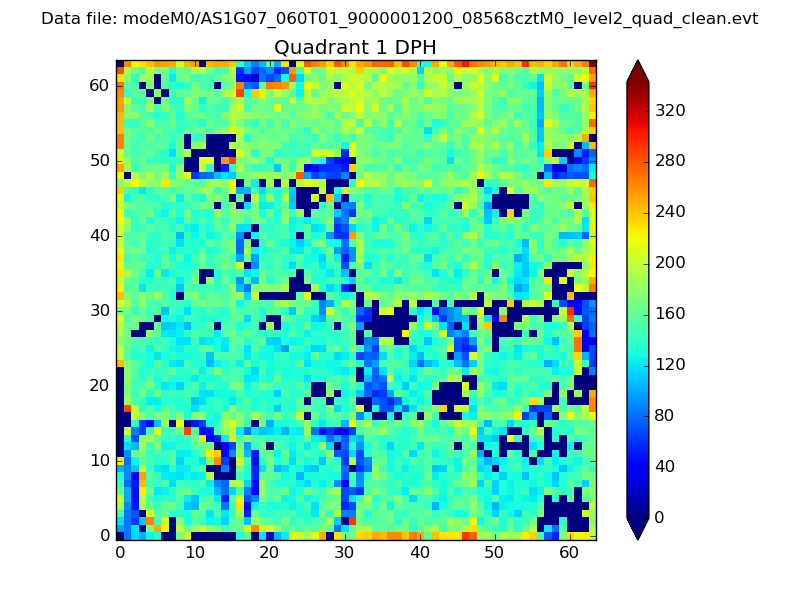 |
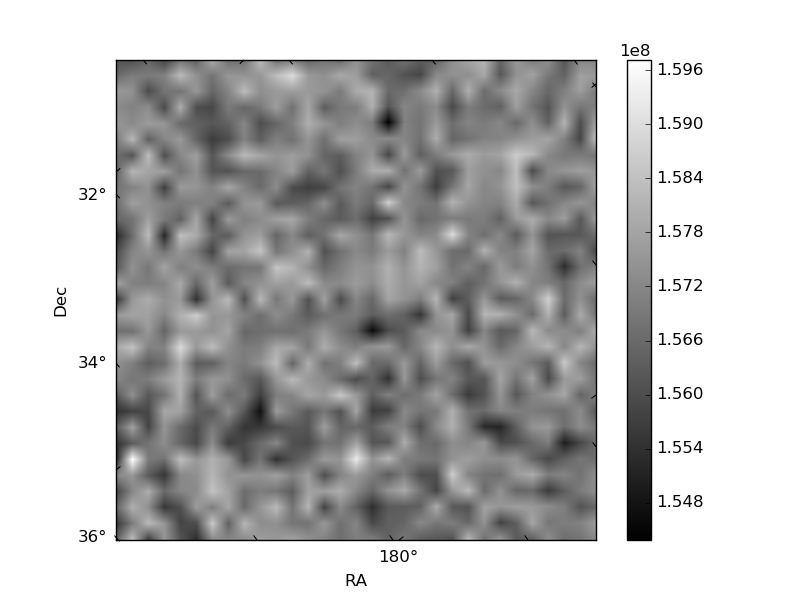
Quadrant B |
|---|---|---|---|
| Quadrant D | 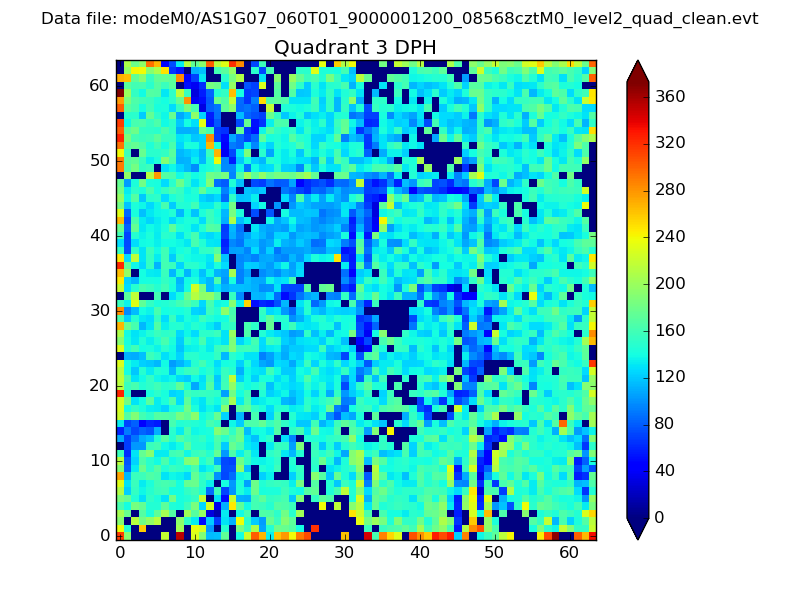 |
 |
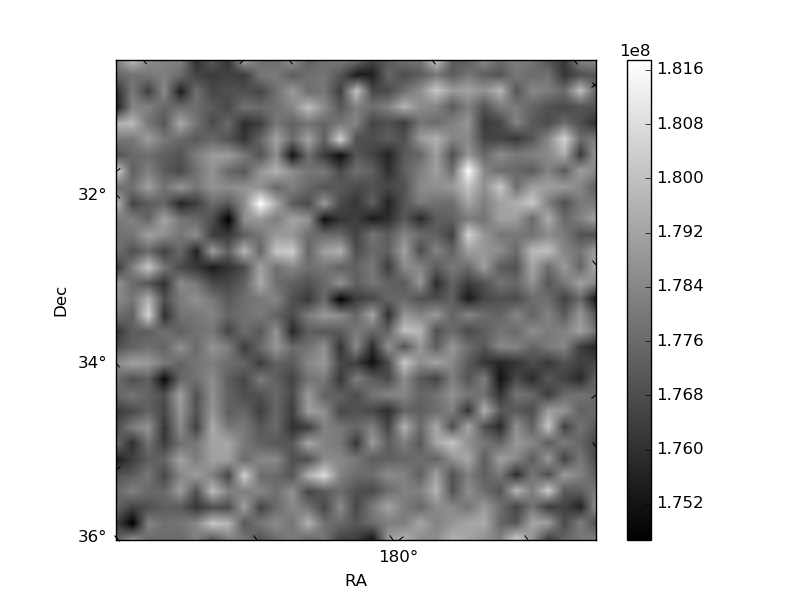
Quadrant C |
| Plot type | Count rate plots | Images |
|---|---|---|
| Comparison with Poisson distribution Blue bars denote a histogram of data divided into 1 sec bins. Red curve is a Poisson curve with rate = median count rate of data. |
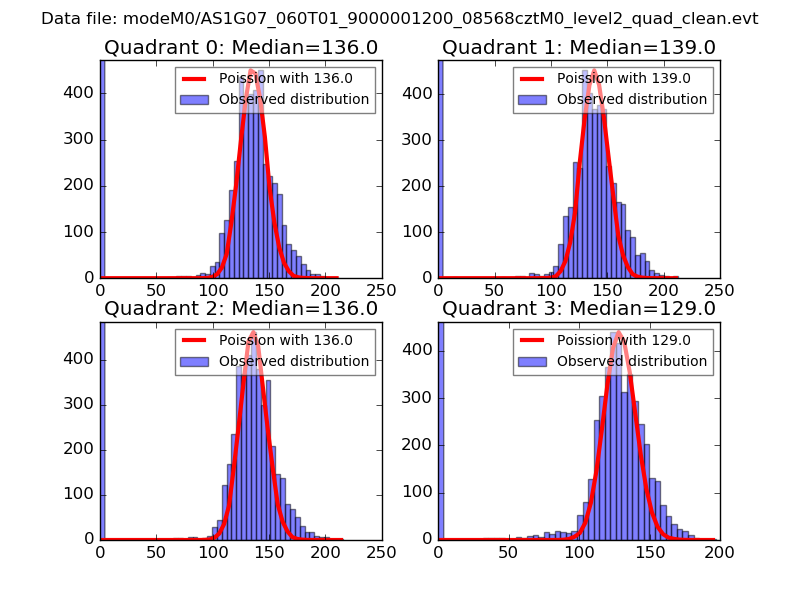 |
 |
| Quadrant-wise count rates Data is divided into 100 sec bins |
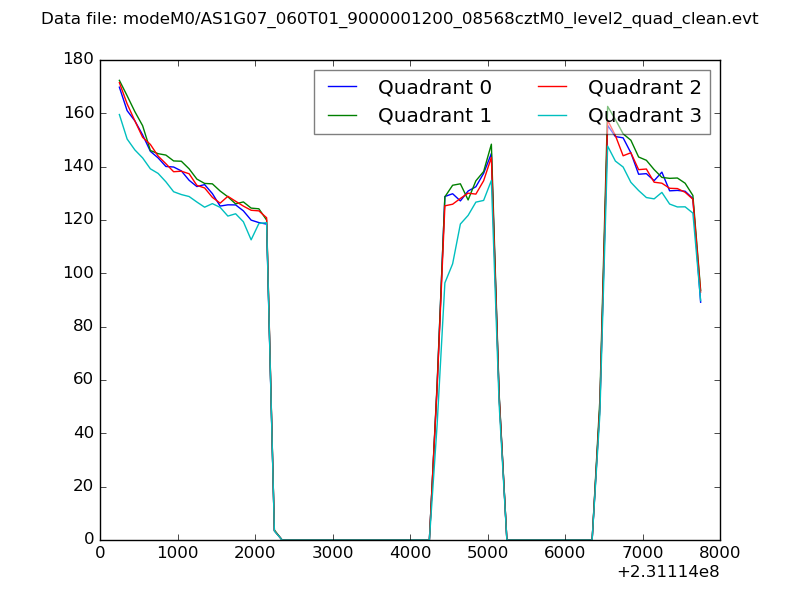 |
|
| Module-wise count rates for Quadrant A Data is divided into 100 sec bins |
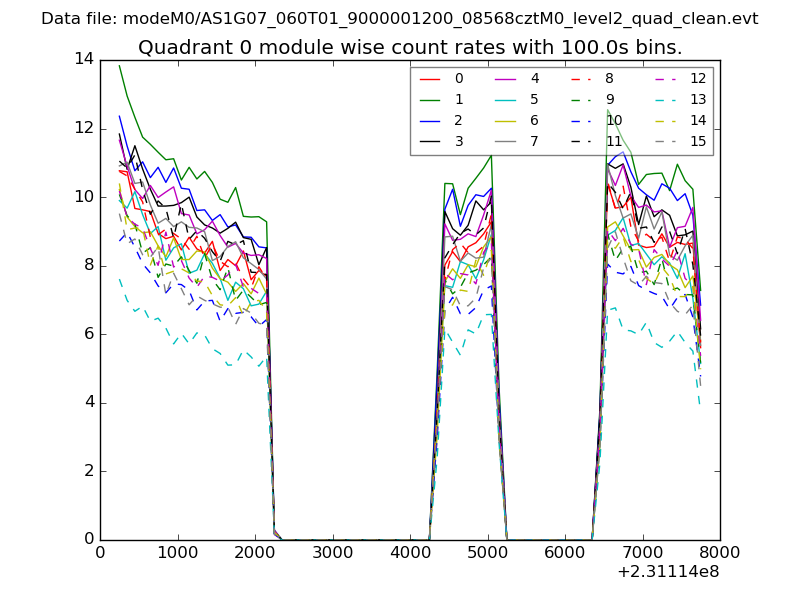 |
 |
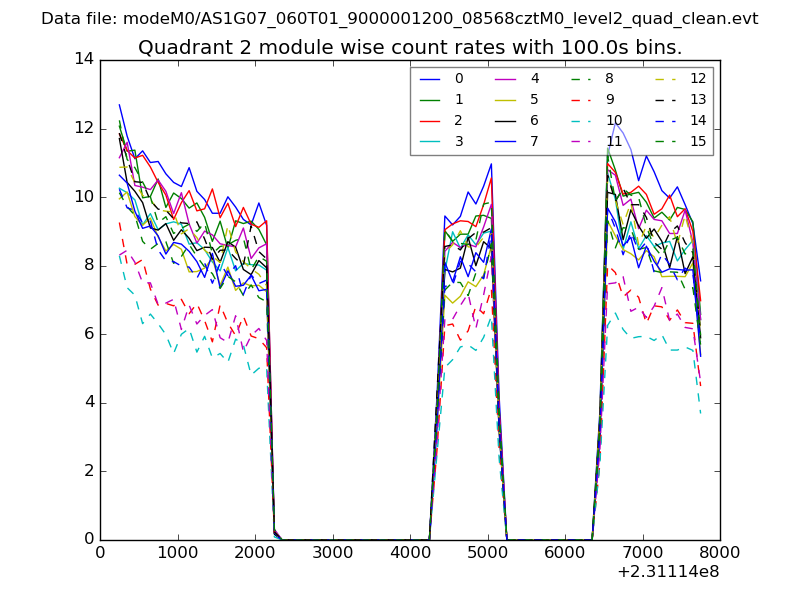
| Module-wise count rates for Quadrant B Data is divided into 100 sec bins |
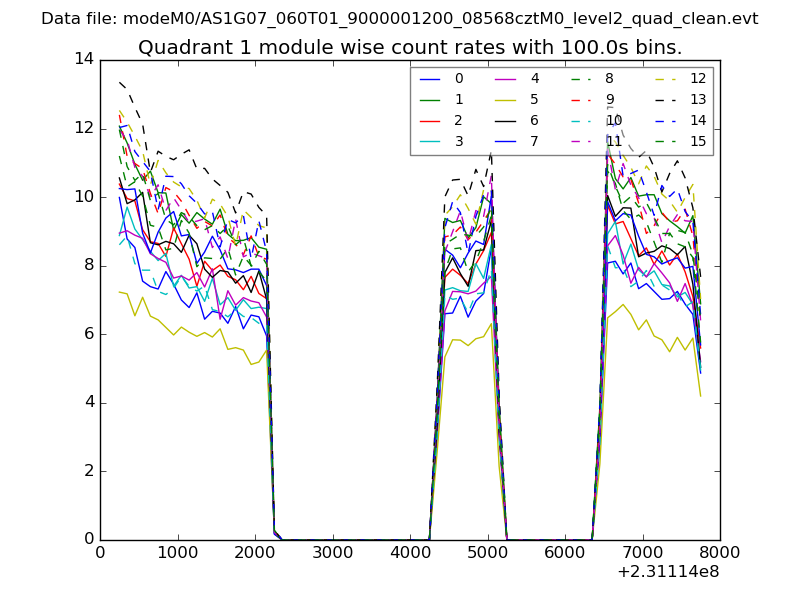 |
 |
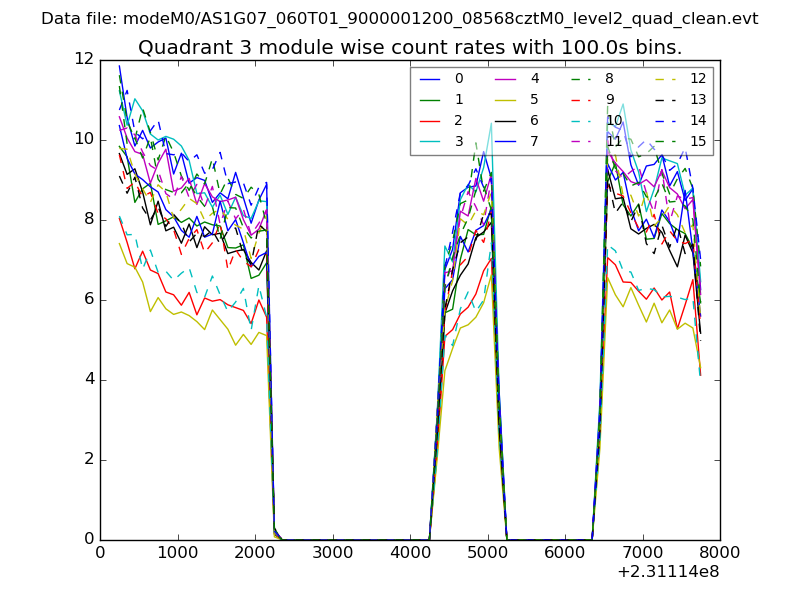
| Module-wise count rates for Quadrant C Data is divided into 100 sec bins |
 |
 |
| Module-wise count rates for Quadrant D Data is divided into 100 sec bins |
 |
 |
| Parameter | Plot |
|---|---|
| CZT HV Monitor | 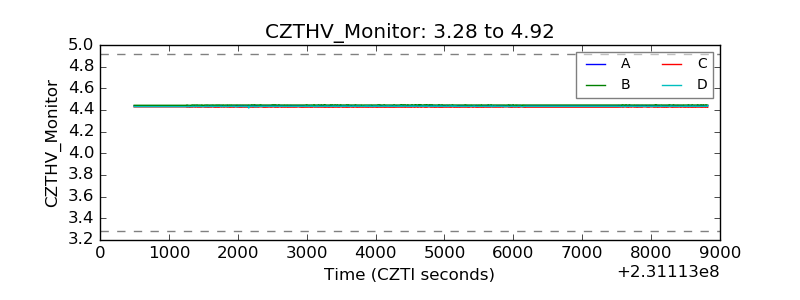 |
| D_VDD | 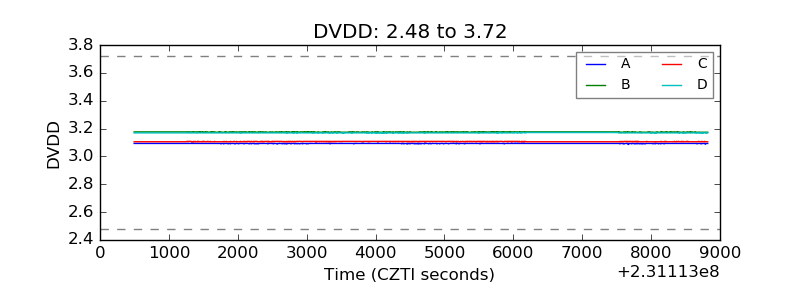 |
| Temperature 1 | 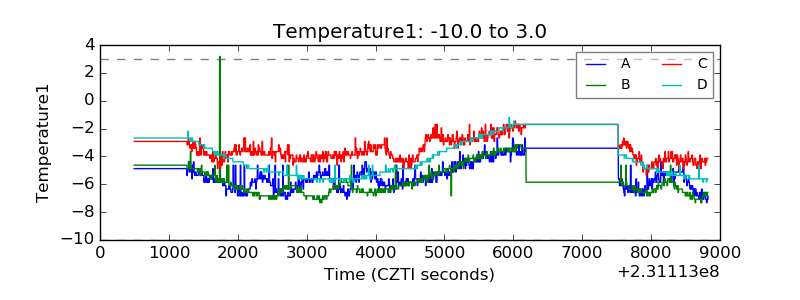 |
| Veto HV Monitor |  |
| Veto LLD | 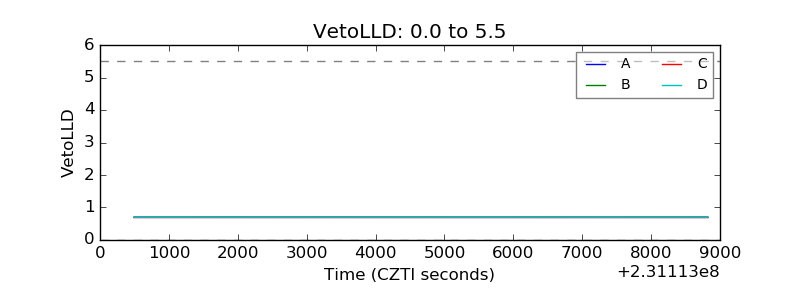 |
| Alpha Counter | 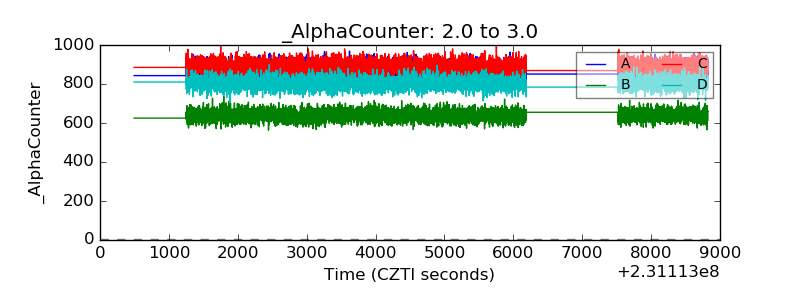 |
| _CPM_Rate | 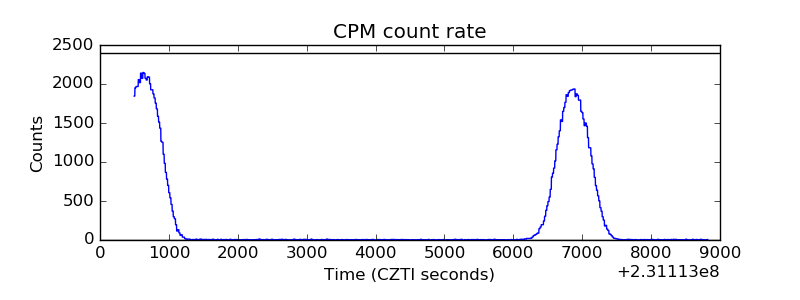 |
| CZT Counter | 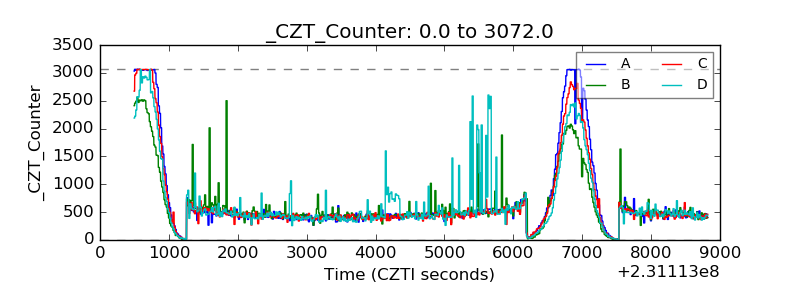 |
| +2.5 Volts monitor |  |
| +5 Volts monitor |  |
| _ROLL_ROT | 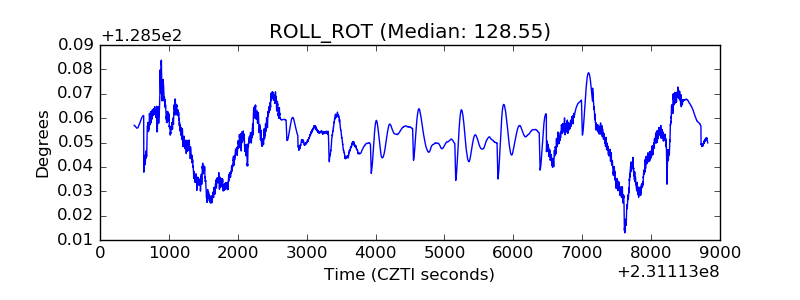 |
| _Roll_DEC | 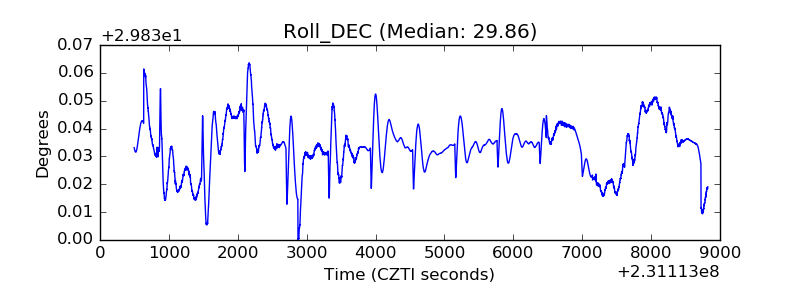 |
| _Roll_RA | 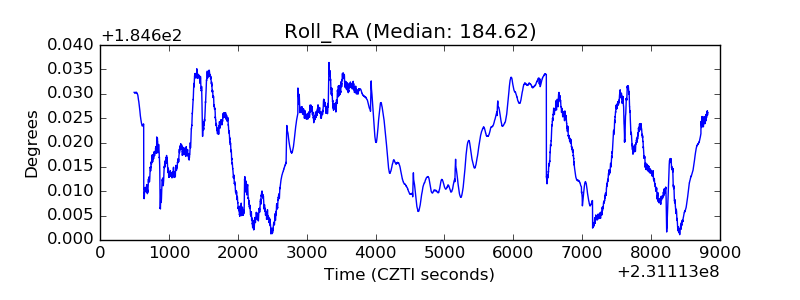 |
| Veto Counter | 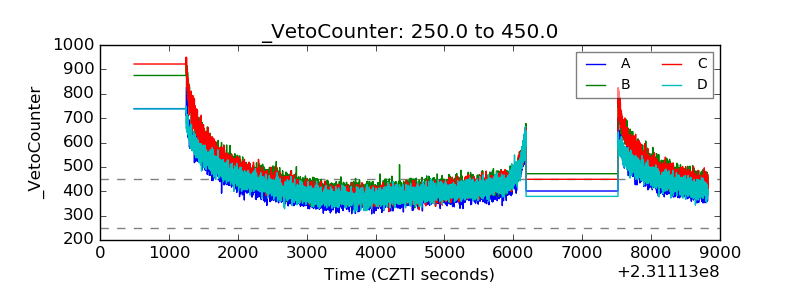 |