| Param | Original file | Final file |
|---|---|---|
| Filename | modeM0/AS1G07_060T01_9000001200_08569cztM0_level2.evt | modeM0/AS1G07_060T01_9000001200_08569cztM0_level2_quad_clean.evt |
| Size (bytes) | 412,914,240 | 85,089,600 |
| Size | 393.8 MB | 81.1 MB |
| Events in quadrant A | 2,955,549 | 537,880 |
| Events in quadrant B | 3,290,006 | 548,532 |
| Events in quadrant C | 2,861,324 | 537,467 |
| Events in quadrant D | 2,969,897 | 513,458 |
| Mode SS | |||
|---|---|---|---|
| Quadrant | BADHDUFLAG | Total packets | Discarded packets |
| A | 0 | 126 | 0 |
| B | 0 | 126 | 0 |
| C | 0 | 126 | 0 |
| D | 0 | 126 | 0 |
| Mode M0 | |||
|---|---|---|---|
| Quadrant | BADHDUFLAG | Total packets | Discarded packets |
| A | 0 | 13050 | 3 |
| B | 0 | 13876 | 2 |
| C | 0 | 12892 | 2 |
| D | 0 | 13224 | 2 |
| Mode M9 | |||
|---|---|---|---|
| Quadrant | BADHDUFLAG | Total packets | Discarded packets |
| A | 0 | 17 | 0 |
| B | 0 | 17 | 0 |
| C | 0 | 17 | 0 |
| D | 0 | 18 | 0 |
| Quadrant | Total seconds | Saturated seconds | Saturation percentage |
|---|---|---|---|
| A | 6303 | 28 | 0.444233% |
| B | 6303 | 103 | 1.634142% |
| C | 6303 | 17 | 0.269713% |
| D | 6303 | 9 | 0.142789% |
Noise dominated data is calculated using 1-second bins in cleaned event files. If a bin has >2000 counts, and if more than 50% of those come from <1% of pixels, then it is considered to be noise-dominated and hence unusable.
| Quadrant | # 1 sec bins | Bins with >0 counts | Bins with >2000 counts | High rate bins dominated by noise | Noise dominated (total time) | Noise dominated (detector-on time) | Marked lightcurve |
|---|---|---|---|---|---|---|---|
| A | 7568 | 6304 | 4 | 4 | 0.05% | 0.06% |  |
| B | 7568 | 6304 | 56 | 56 | 0.74% | 0.89% | 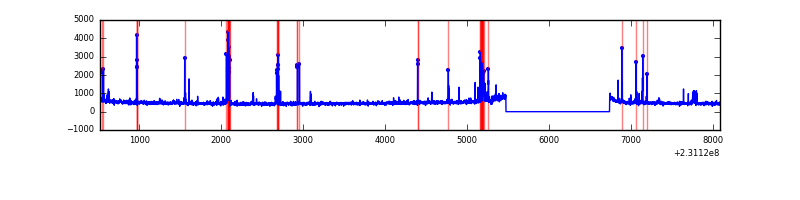 |
| C | 7568 | 6304 | 0 | 0 | 0.00% | 0.00% | 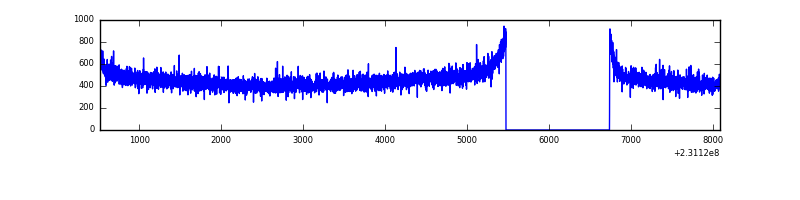 |
| D | 7568 | 6304 | 3 | 3 | 0.04% | 0.05% | 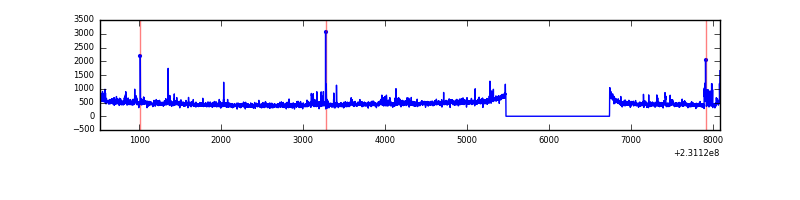 |
Top three noisy pixels from each quadrant. If the there are fewer than three noisy pixels in the level2.evt file, extra rows are filled as -1
| Pixel properties | Quadrant properties | ||||||
|---|---|---|---|---|---|---|---|
| Quadrant | DetID | PixID | Counts | Sigma | Mean | Median | Sigma |
| A | 5 | 112 | 32472 | 208.37 | 750 | 735 | 152.3 |
| A | 15 | 223 | 17012 | 106.87 | 750 | 735 | 152.3 |
| A | 14 | 111 | 12193 | 75.23 | 750 | 735 | 152.3 |
| B | 10 | 16 | 304543 | 2122.6 | 756 | 738 | 143.1 |
| B | 12 | 111 | 16515 | 110.23 | 756 | 738 | 143.1 |
| B | 0 | 214 | 15929 | 106.14 | 756 | 738 | 143.1 |
| C | 13 | 61 | 5439 | 27.7 | 733 | 734 | 169.9 |
| C | 8 | 222 | 2285 | 9.13 | 733 | 734 | 169.9 |
| C | 14 | 64 | 1805 | 6.31 | 733 | 734 | 169.9 |
| D | 1 | 52 | 136000 | 738.23 | 717 | 698 | 183.3 |
| D | 8 | 195 | 36775 | 196.84 | 717 | 698 | 183.3 |
| D | 12 | 233 | 30715 | 163.78 | 717 | 698 | 183.3 |
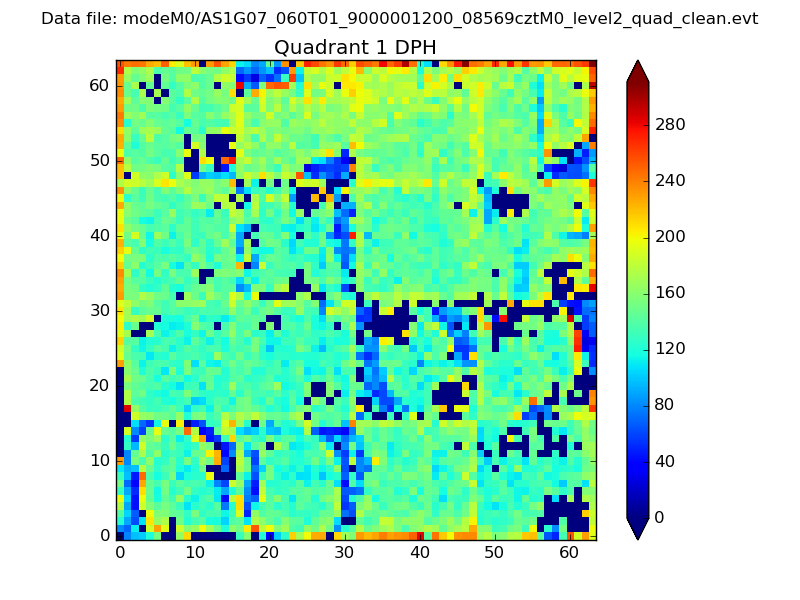
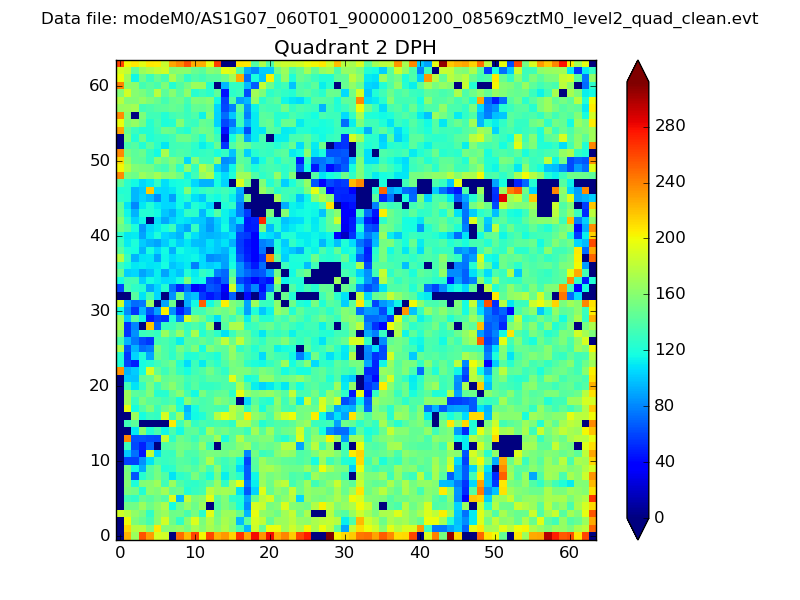
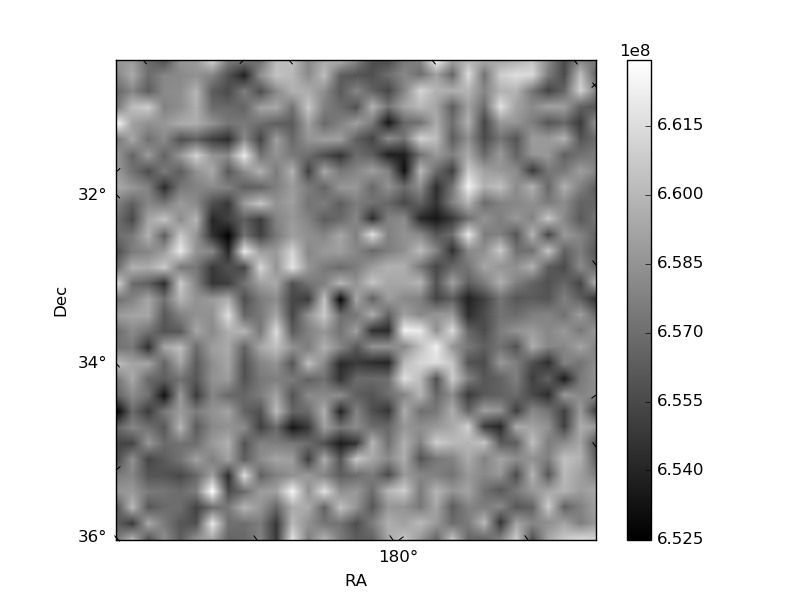
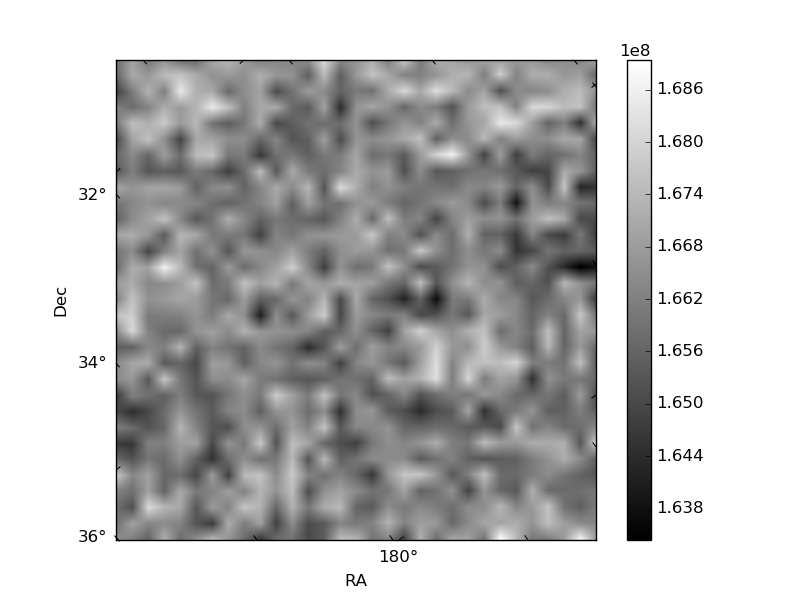
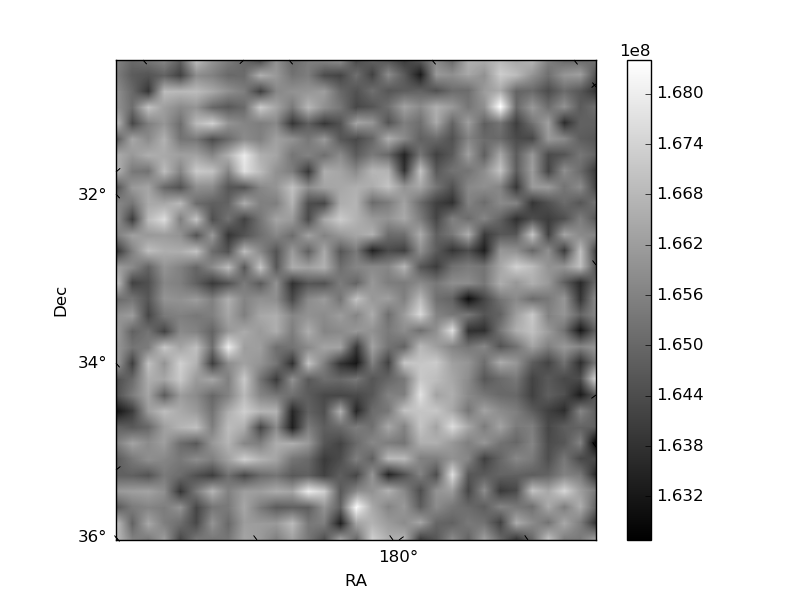
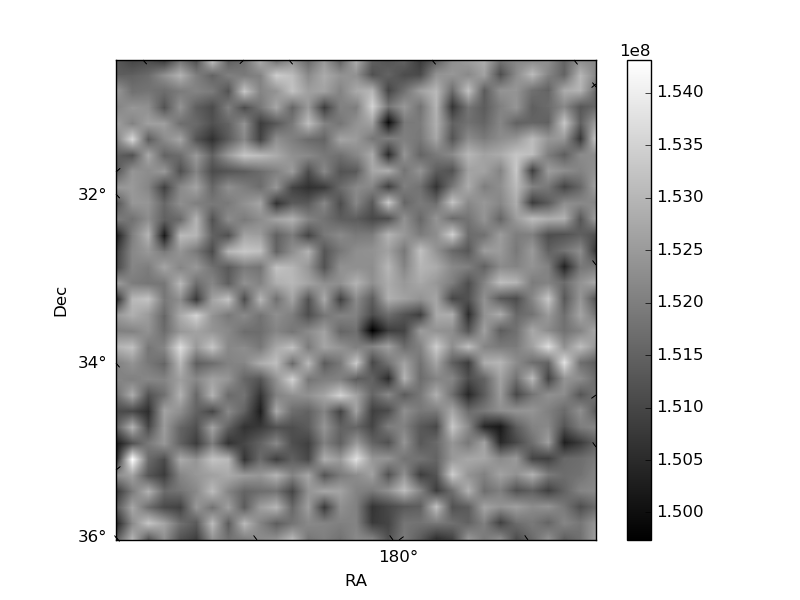
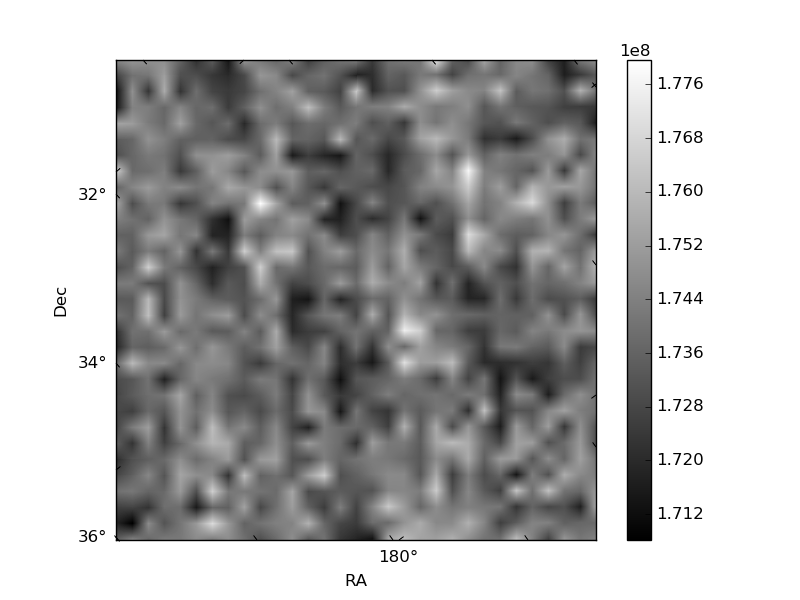
Histogram calculated using DETX and DETY for each event in the final _common_clean file
| Quadrant A | 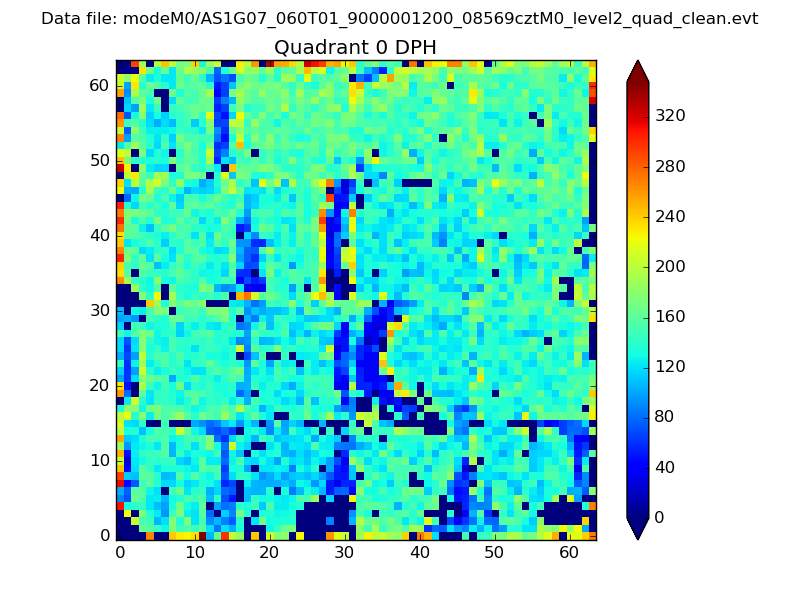 |
 |
Quadrant B |
|---|---|---|---|
| Quadrant D | 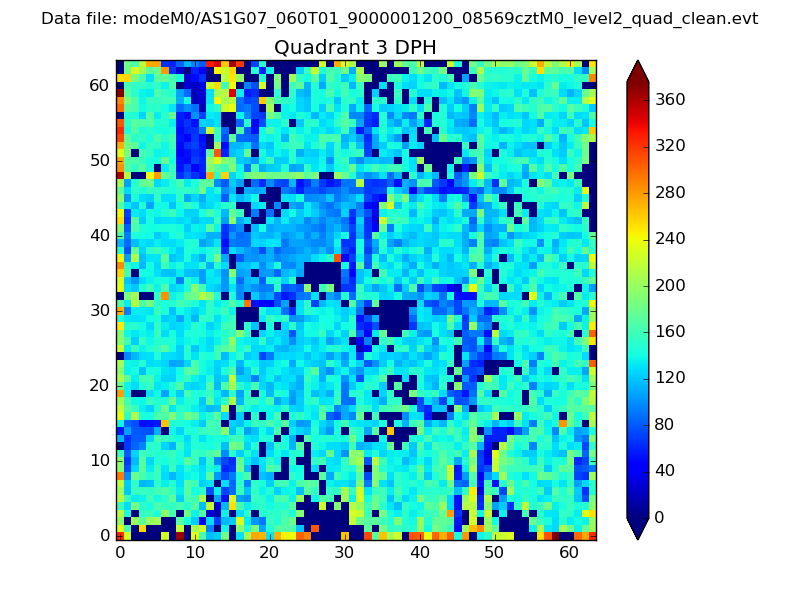 |
 |
Quadrant C |
| Plot type | Count rate plots | Images |
|---|---|---|
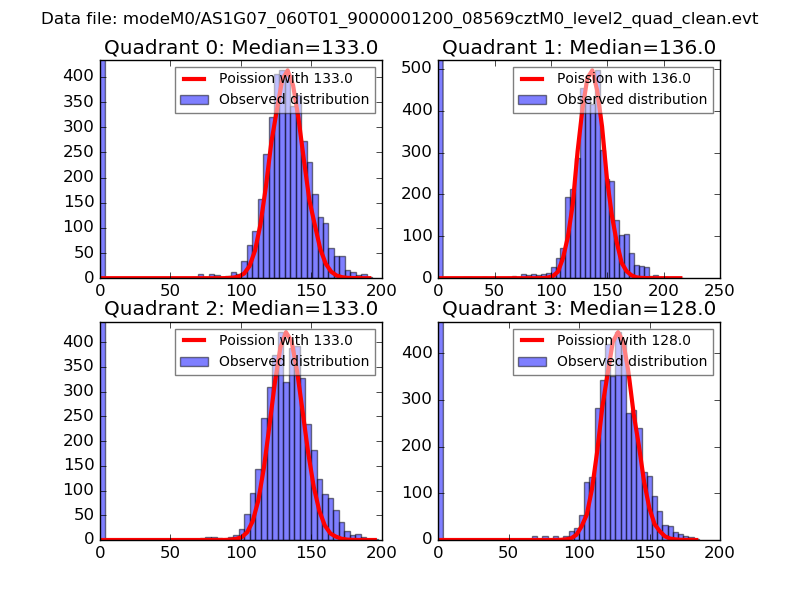
| Comparison with Poisson distribution Blue bars denote a histogram of data divided into 1 sec bins. Red curve is a Poisson curve with rate = median count rate of data. |
 |
 |
| Quadrant-wise count rates Data is divided into 100 sec bins |
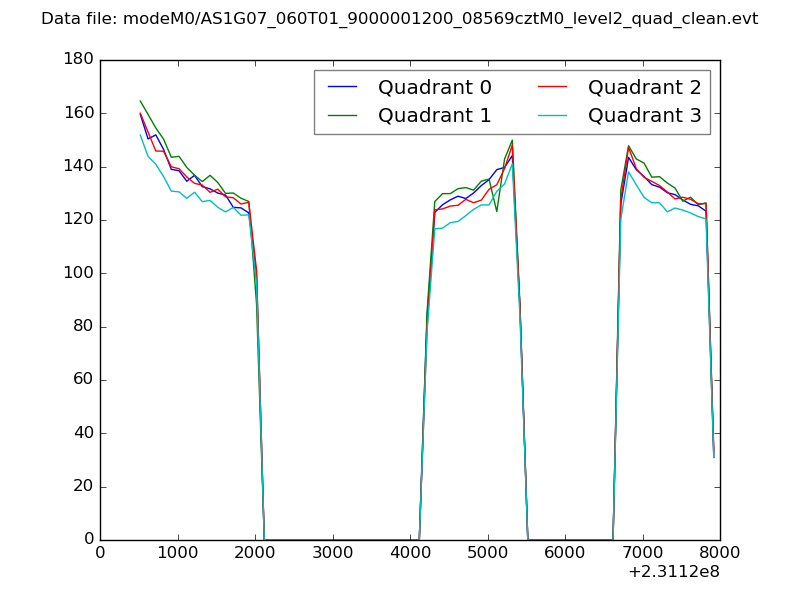 |
|
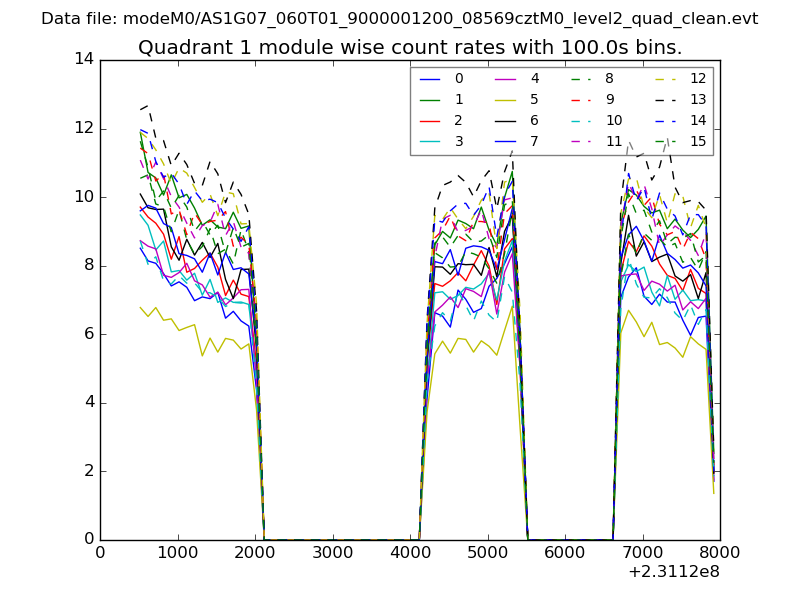
| Module-wise count rates for Quadrant A Data is divided into 100 sec bins |
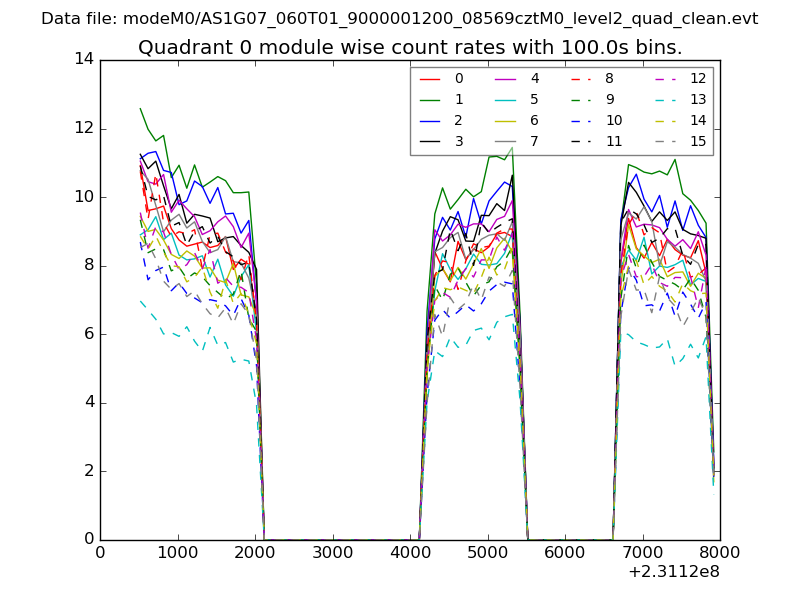 |
 |
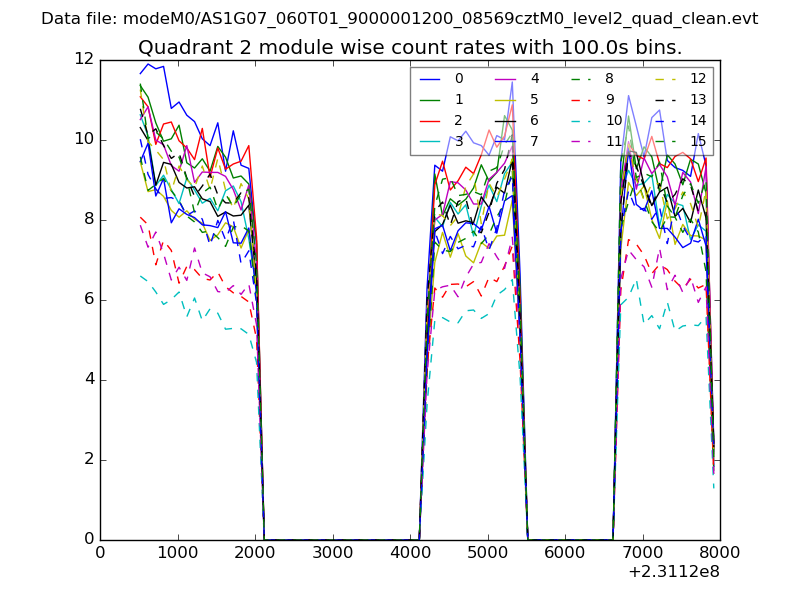
| Module-wise count rates for Quadrant B Data is divided into 100 sec bins |
 |
 |
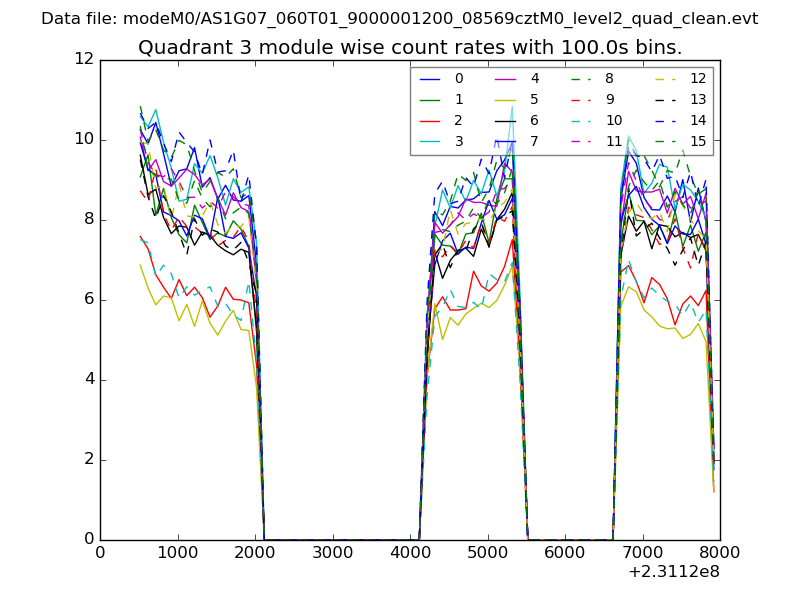
| Module-wise count rates for Quadrant C Data is divided into 100 sec bins |
 |
 |
| Module-wise count rates for Quadrant D Data is divided into 100 sec bins |
 |
 |
| Parameter | Plot |
|---|---|
| CZT HV Monitor | 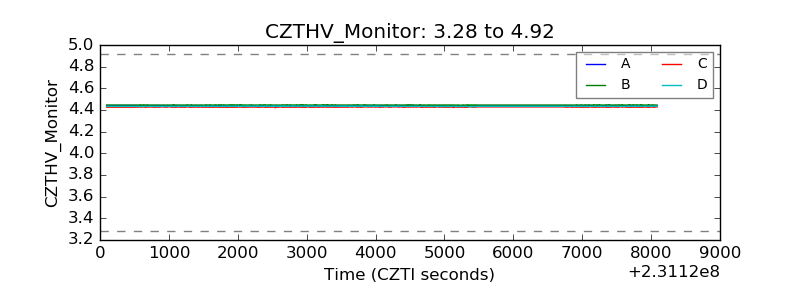 |
| D_VDD | 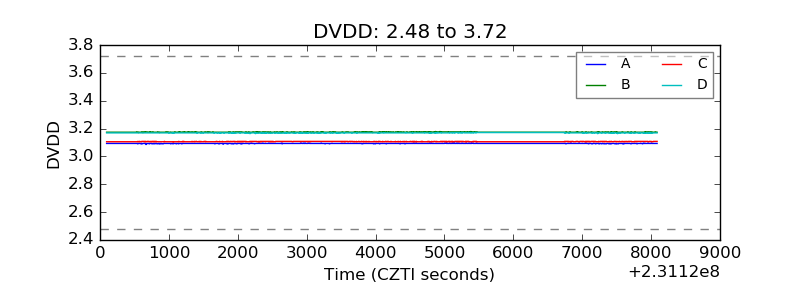 |
| Temperature 1 | 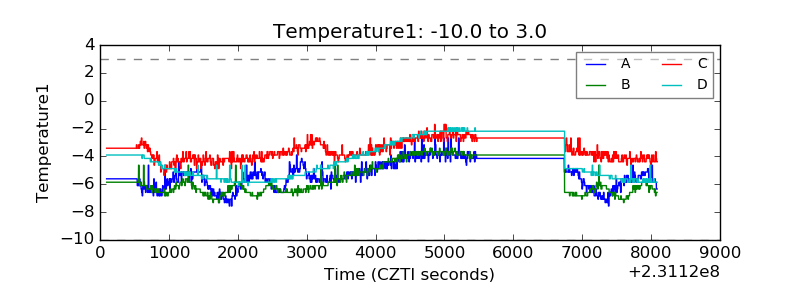 |
| Veto HV Monitor |  |
| Veto LLD | 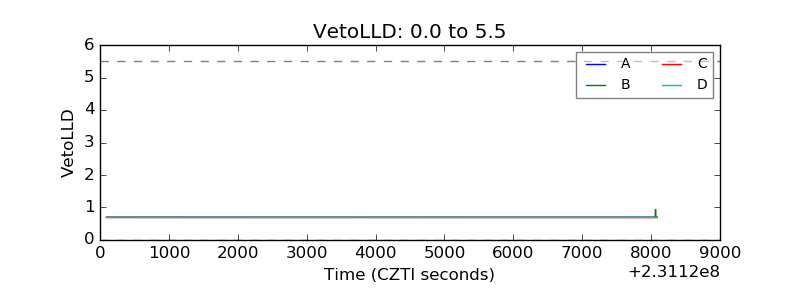 |
| Alpha Counter | 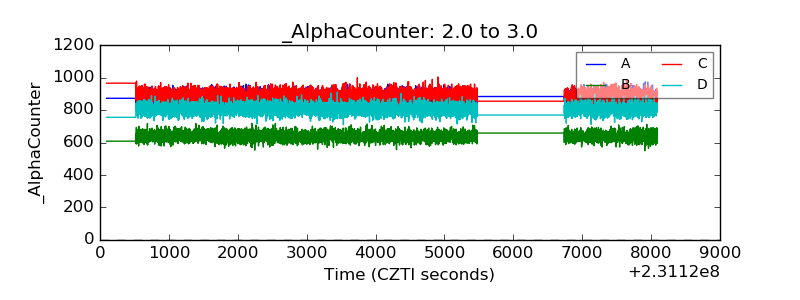 |
| _CPM_Rate | 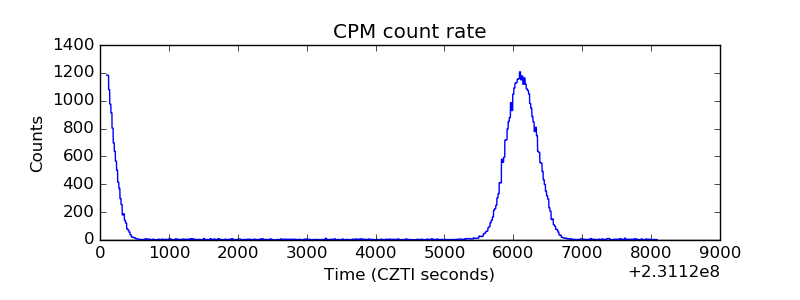 |
| CZT Counter | 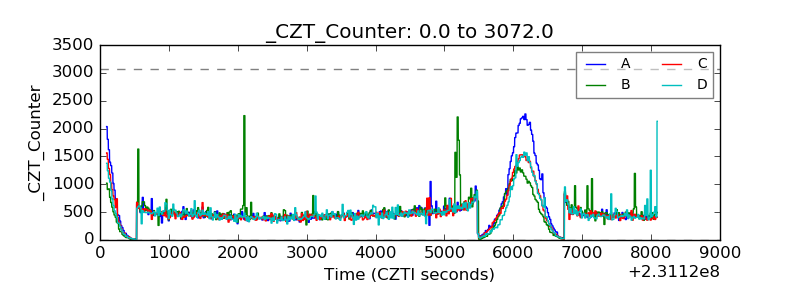 |
| +2.5 Volts monitor |  |
| +5 Volts monitor |  |
| _ROLL_ROT | 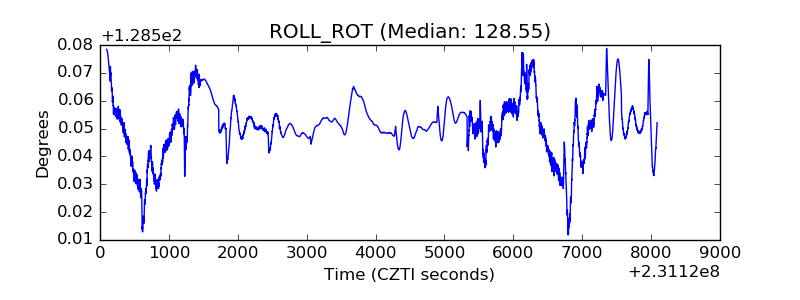 |
| _Roll_DEC | 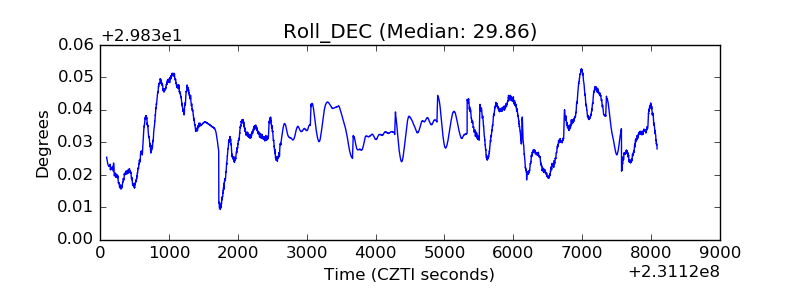 |
| _Roll_RA | 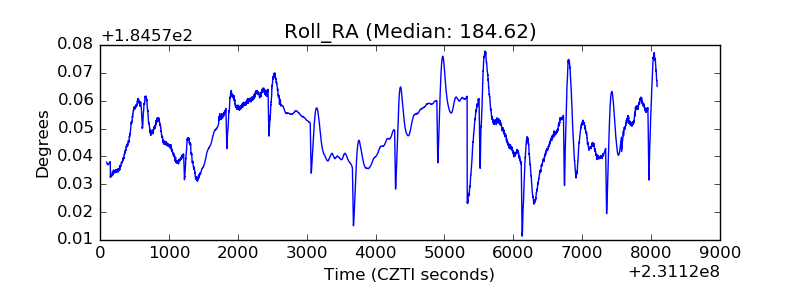 |
| Veto Counter | 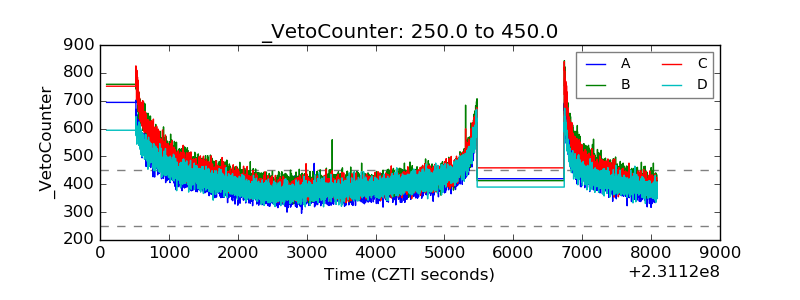 |