| Param | Original file | Final file |
|---|---|---|
| Filename | modeM0/AS1G07_060T01_9000001200_08570cztM0_level2.evt | modeM0/AS1G07_060T01_9000001200_08570cztM0_level2_quad_clean.evt |
| Size (bytes) | 414,671,040 | 79,015,680 |
| Size | 395.5 MB | 75.4 MB |
| Events in quadrant A | 2,944,930 | 489,275 |
| Events in quadrant B | 3,190,118 | 498,849 |
| Events in quadrant C | 2,886,303 | 488,704 |
| Events in quadrant D | 3,099,142 | 466,921 |
| Mode SS | |||
|---|---|---|---|
| Quadrant | BADHDUFLAG | Total packets | Discarded packets |
| A | 0 | 132 | 0 |
| B | 0 | 132 | 0 |
| C | 0 | 132 | 0 |
| D | 0 | 132 | 0 |
| Mode M0 | |||
|---|---|---|---|
| Quadrant | BADHDUFLAG | Total packets | Discarded packets |
| A | 0 | 13196 | 2 |
| B | 0 | 13740 | 1 |
| C | 0 | 13144 | 1 |
| D | 0 | 13802 | 1 |
| Mode M9 | |||
|---|---|---|---|
| Quadrant | BADHDUFLAG | Total packets | Discarded packets |
| A | 0 | 25 | 0 |
| B | 0 | 25 | 0 |
| C | 0 | 25 | 0 |
| D | 0 | 25 | 0 |
| Quadrant | Total seconds | Saturated seconds | Saturation percentage |
|---|---|---|---|
| A | 6437 | 31 | 0.481591% |
| B | 6437 | 64 | 0.994252% |
| C | 6437 | 15 | 0.233028% |
| D | 6437 | 22 | 0.341774% |
Noise dominated data is calculated using 1-second bins in cleaned event files. If a bin has >2000 counts, and if more than 50% of those come from <1% of pixels, then it is considered to be noise-dominated and hence unusable.
| Quadrant | # 1 sec bins | Bins with >0 counts | Bins with >2000 counts | High rate bins dominated by noise | Noise dominated (total time) | Noise dominated (detector-on time) | Marked lightcurve |
|---|---|---|---|---|---|---|---|
| A | 8852 | 6439 | 0 | 0 | 0.00% | 0.00% | 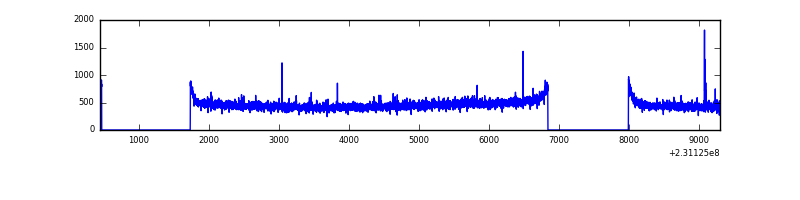 |
| B | 8852 | 6439 | 13 | 13 | 0.15% | 0.20% | 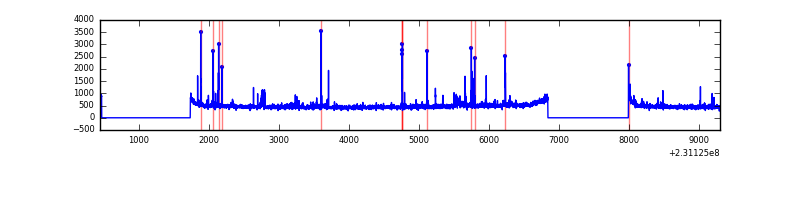 |
| C | 8852 | 6439 | 0 | 0 | 0.00% | 0.00% | 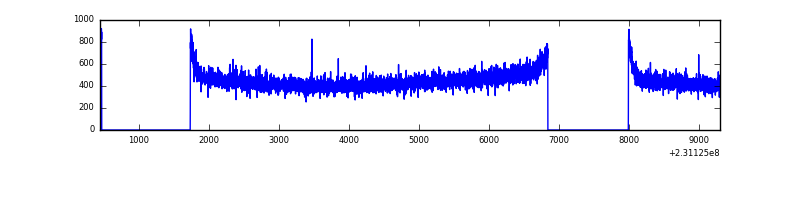 |
| D | 8852 | 6439 | 12 | 12 | 0.14% | 0.19% | 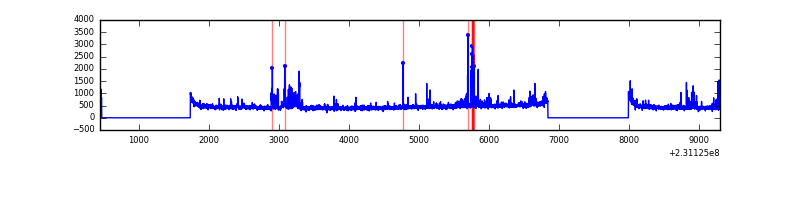 |
Top three noisy pixels from each quadrant. If the there are fewer than three noisy pixels in the level2.evt file, extra rows are filled as -1
| Pixel properties | Quadrant properties | ||||||
|---|---|---|---|---|---|---|---|
| Quadrant | DetID | PixID | Counts | Sigma | Mean | Median | Sigma |
| A | 15 | 223 | 8018 | 47.1 | 760 | 745 | 154.4 |
| A | 0 | 226 | 7052 | 40.85 | 760 | 745 | 154.4 |
| A | 12 | 194 | 6519 | 37.4 | 760 | 745 | 154.4 |
| B | 10 | 16 | 155566 | 1058.29 | 765 | 747 | 146.3 |
| B | 0 | 214 | 28493 | 189.66 | 765 | 747 | 146.3 |
| B | 12 | 111 | 16711 | 109.12 | 765 | 747 | 146.3 |
| C | 13 | 61 | 5678 | 28.72 | 739 | 743 | 171.9 |
| C | 8 | 222 | 2996 | 13.11 | 739 | 743 | 171.9 |
| C | 3 | 202 | 1746 | 5.84 | 739 | 743 | 171.9 |
| D | 1 | 52 | 244452 | 1290.34 | 725 | 710 | 188.9 |
| D | 12 | 233 | 54878 | 286.76 | 725 | 710 | 188.9 |
| D | 2 | 234 | 19408 | 98.98 | 725 | 710 | 188.9 |
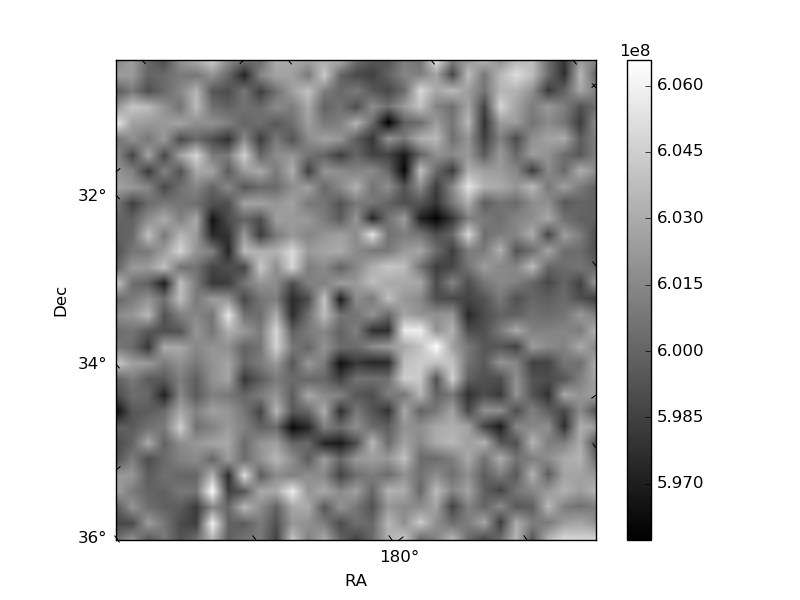
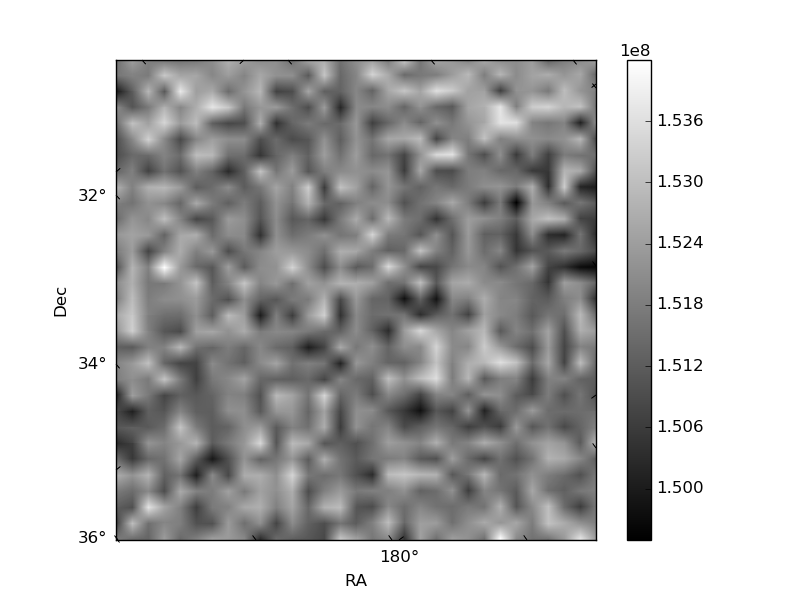
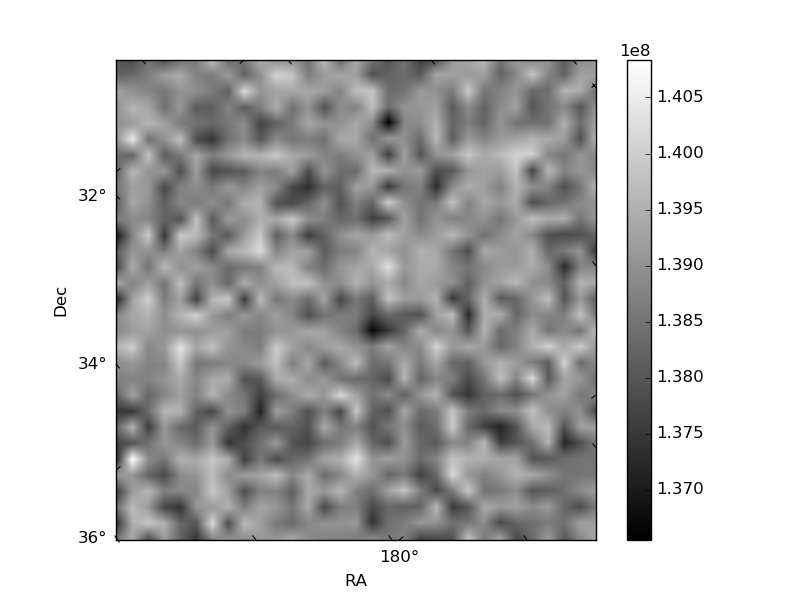
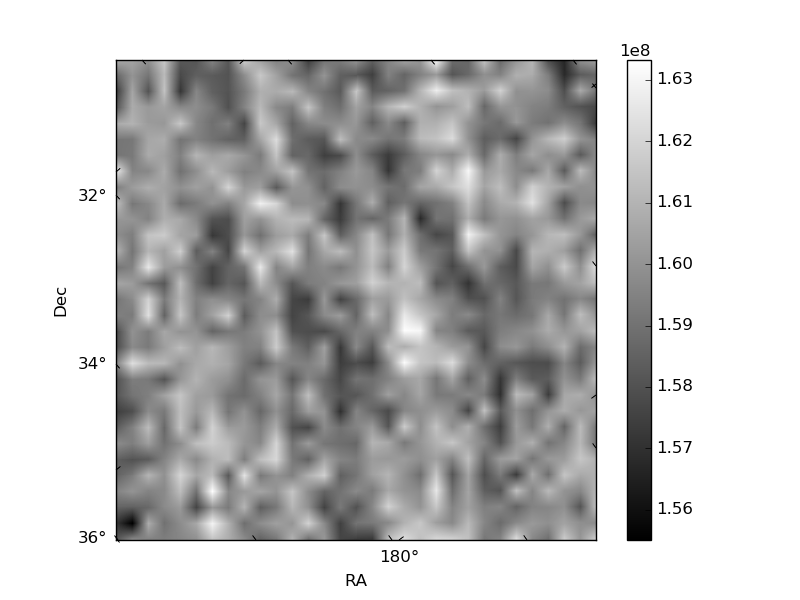
Histogram calculated using DETX and DETY for each event in the final _common_clean file
| Quadrant A | 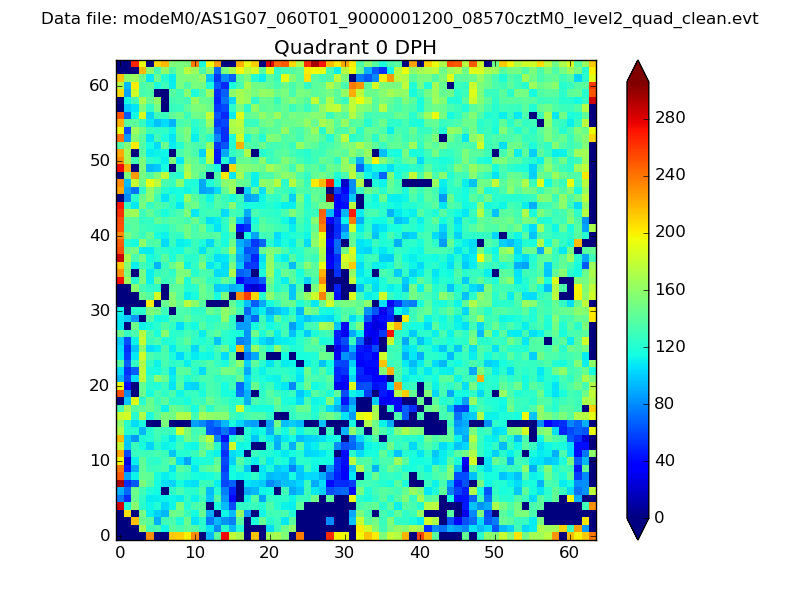 |
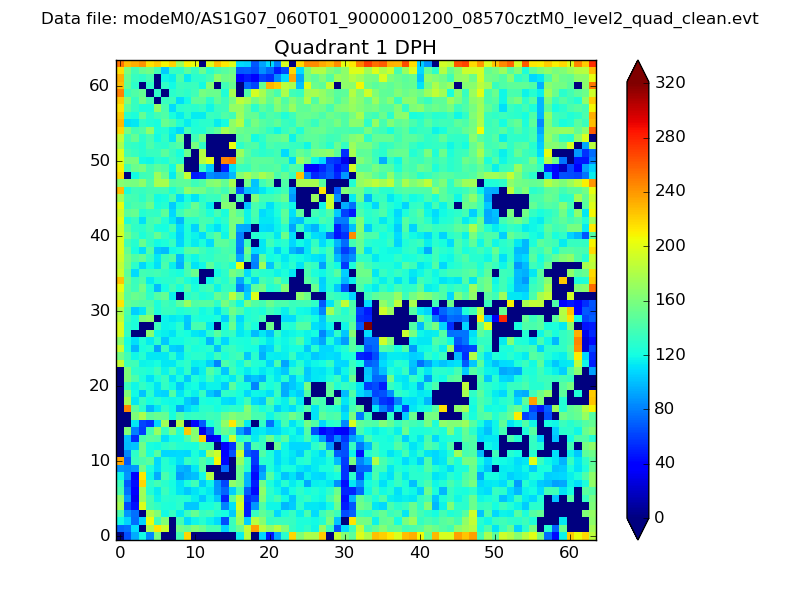 |
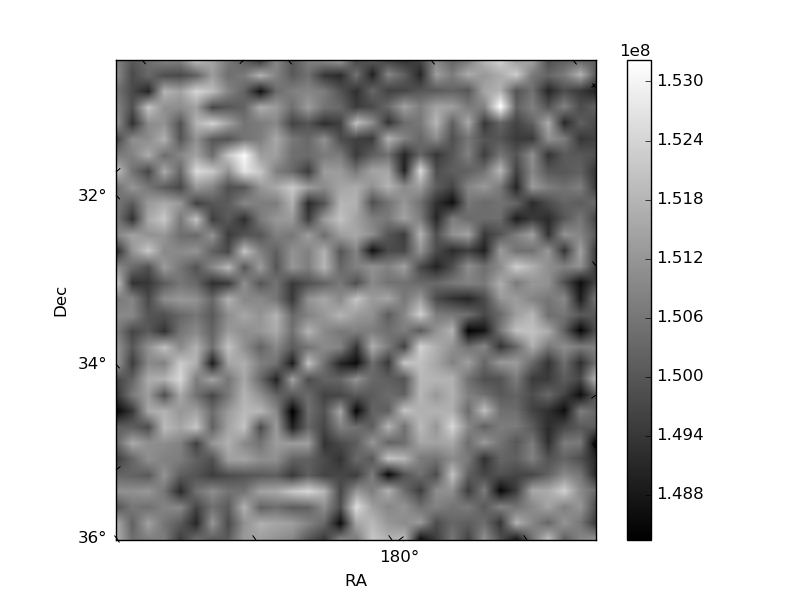
Quadrant B |
|---|---|---|---|
| Quadrant D | 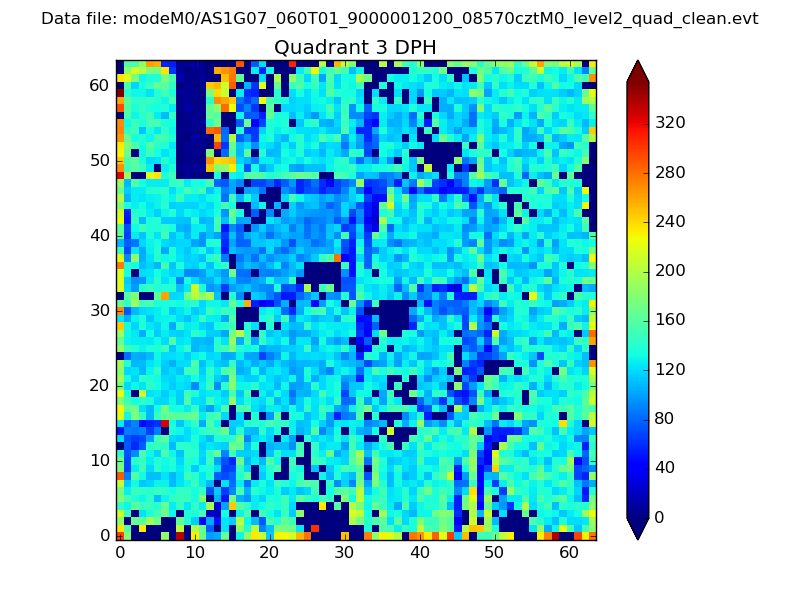 |
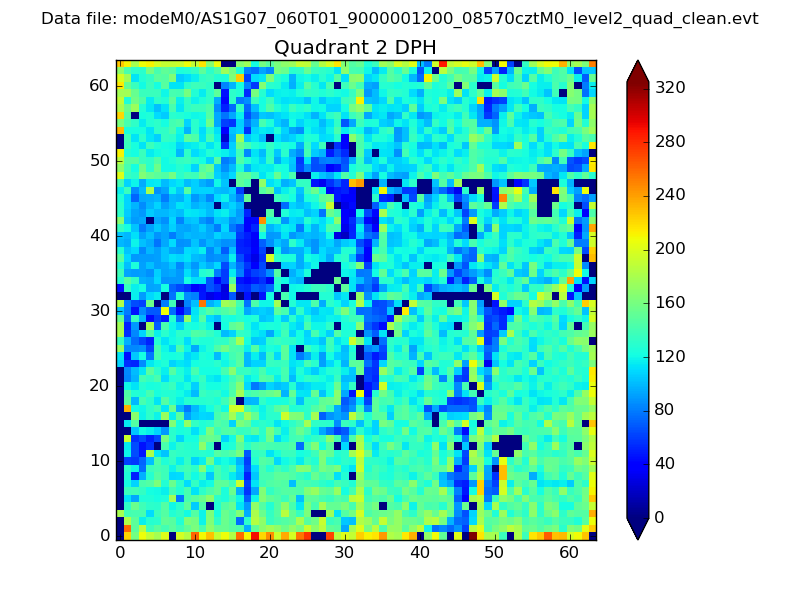 |
Quadrant C |
| Plot type | Count rate plots | Images |
|---|---|---|
| Comparison with Poisson distribution Blue bars denote a histogram of data divided into 1 sec bins. Red curve is a Poisson curve with rate = median count rate of data. |
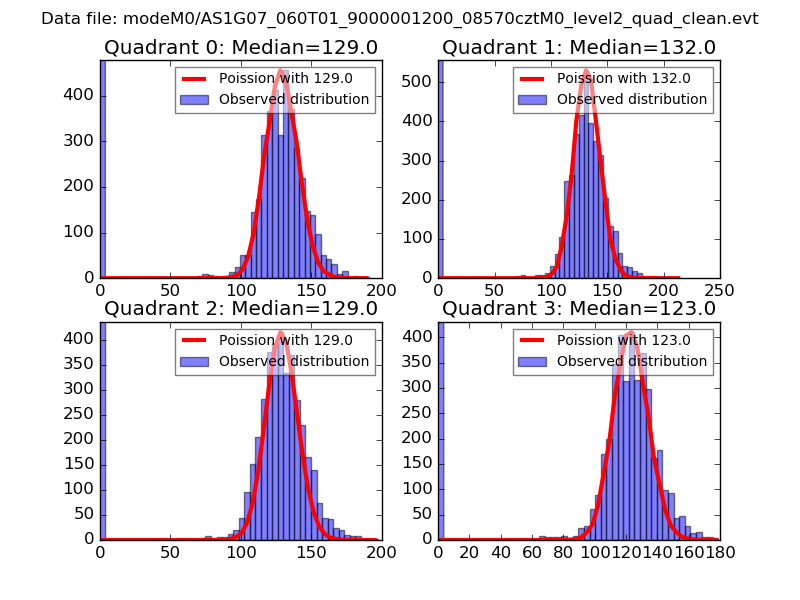 |
 |
| Quadrant-wise count rates Data is divided into 100 sec bins |
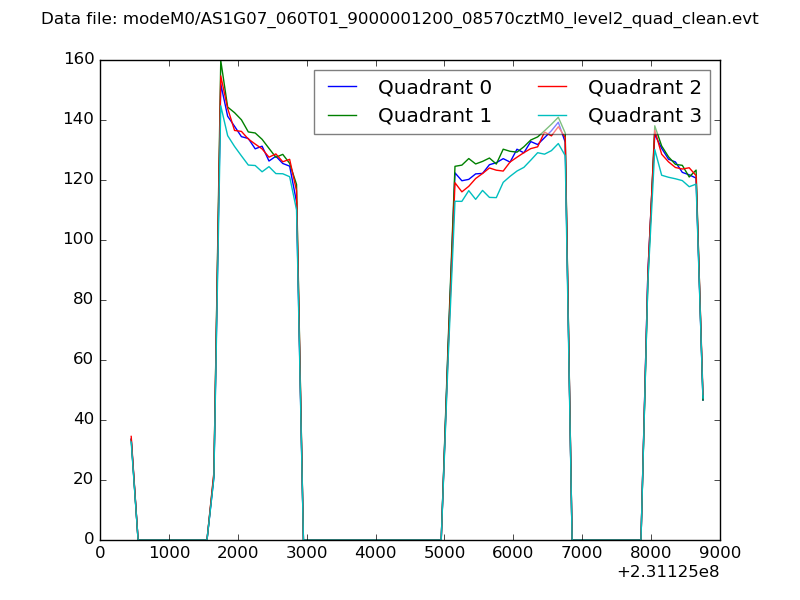 |
|
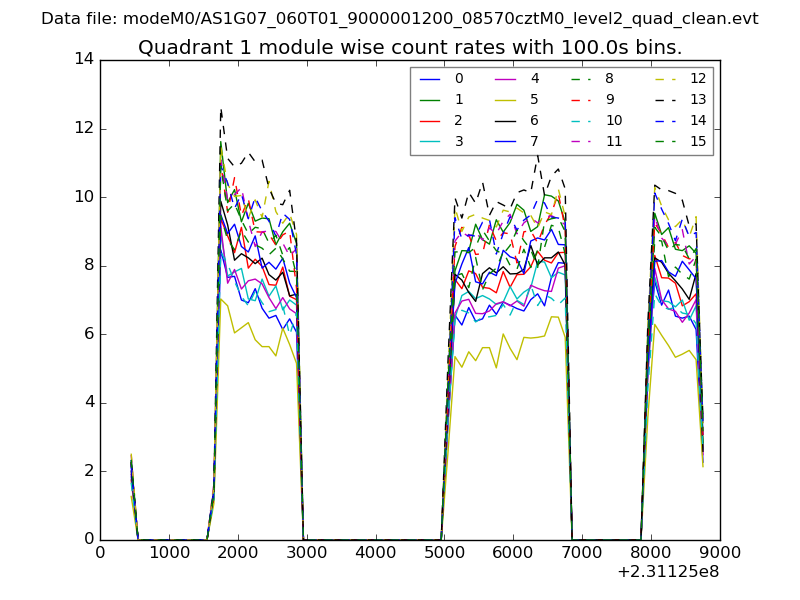
| Module-wise count rates for Quadrant A Data is divided into 100 sec bins |
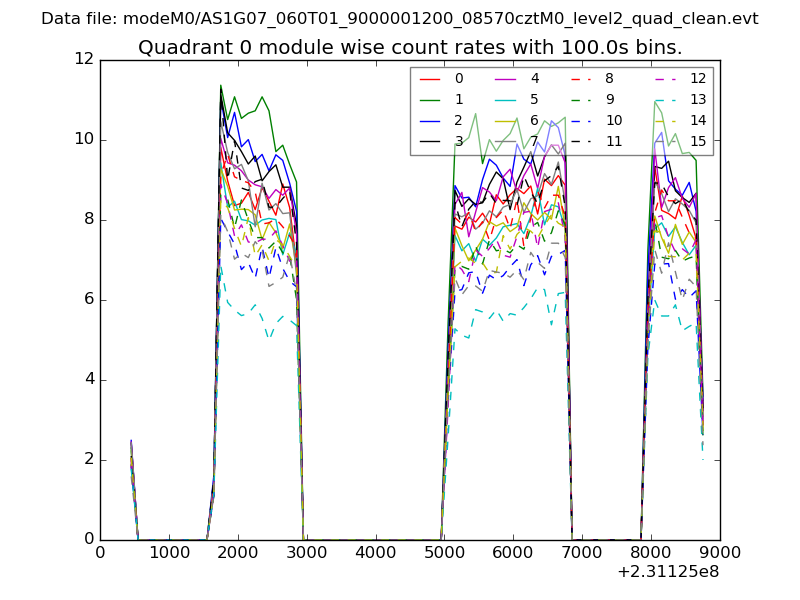 |
 |
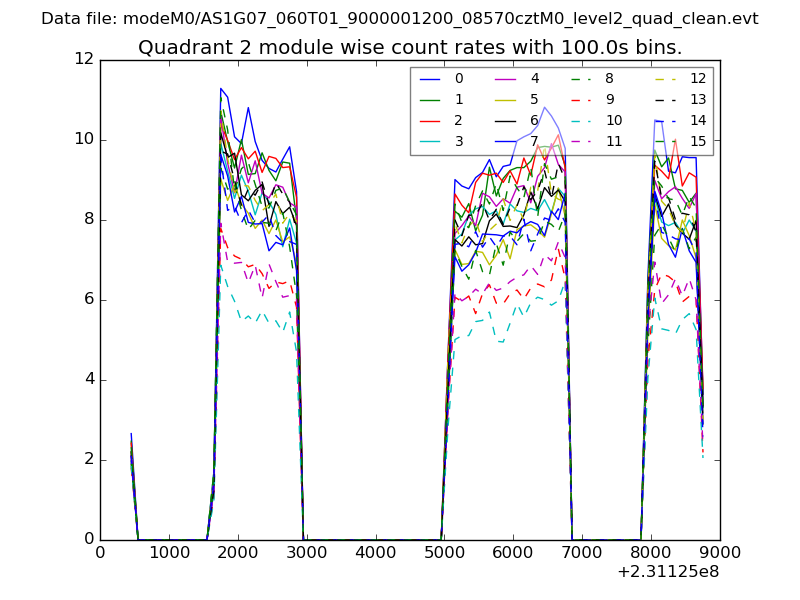
| Module-wise count rates for Quadrant B Data is divided into 100 sec bins |
 |
 |
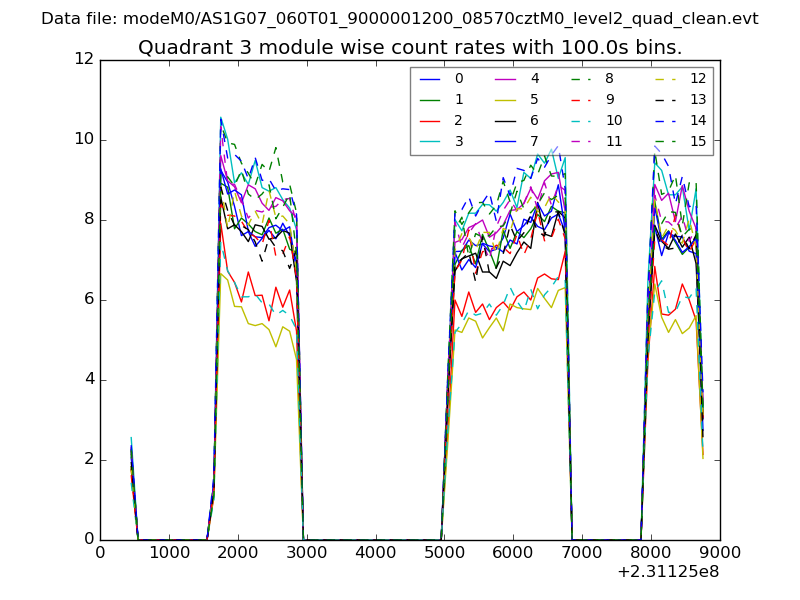
| Module-wise count rates for Quadrant C Data is divided into 100 sec bins |
 |
 |
| Module-wise count rates for Quadrant D Data is divided into 100 sec bins |
 |
 |
| Parameter | Plot |
|---|---|
| CZT HV Monitor | 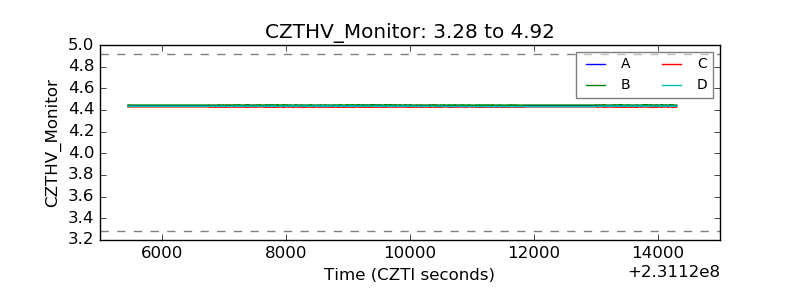 |
| D_VDD |  |
| Temperature 1 | 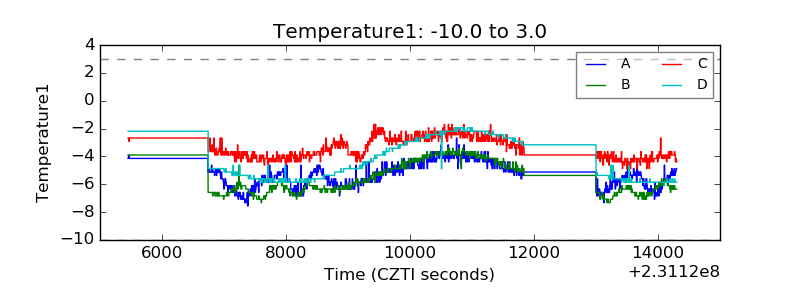 |
| Veto HV Monitor | 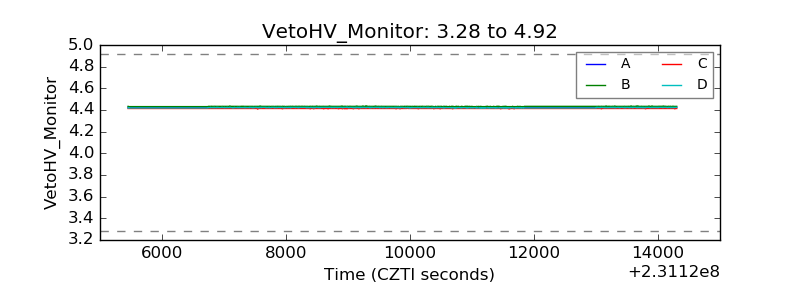 |
| Veto LLD | 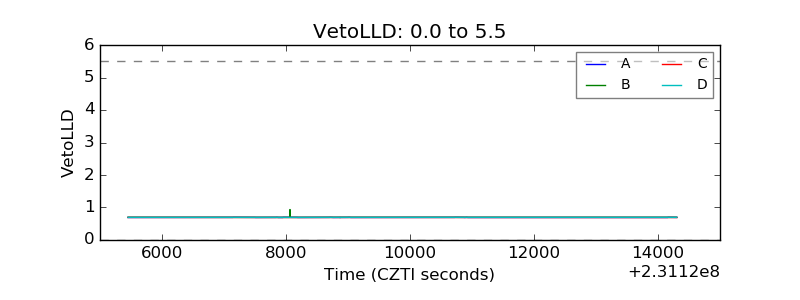 |
| Alpha Counter | 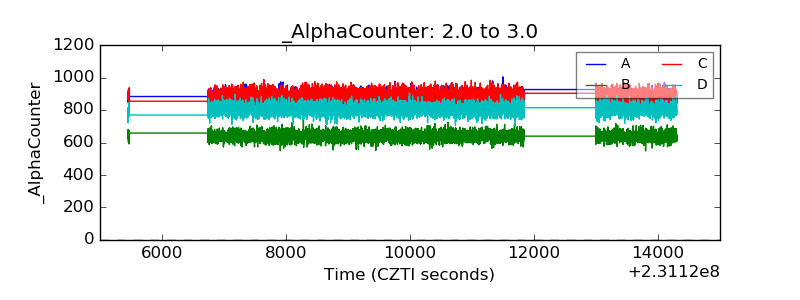 |
| _CPM_Rate | 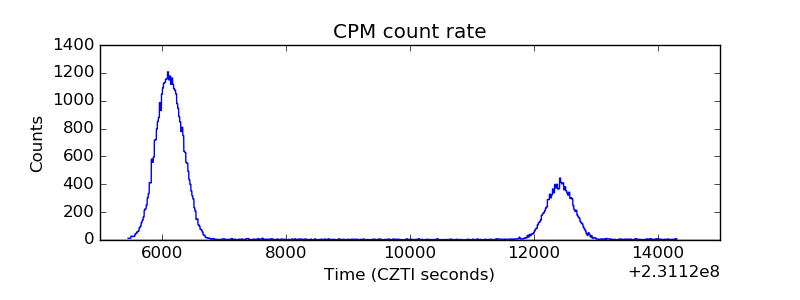 |
| CZT Counter | 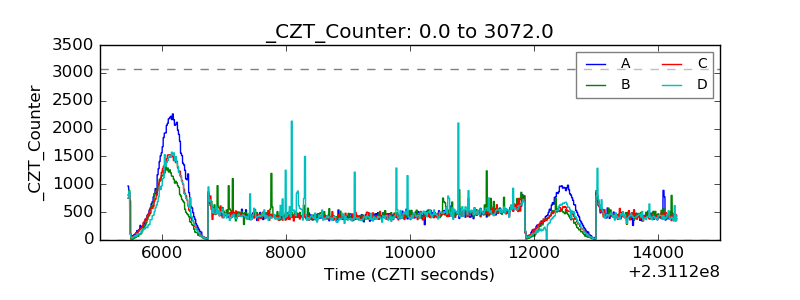 |
| +2.5 Volts monitor |  |
| +5 Volts monitor | 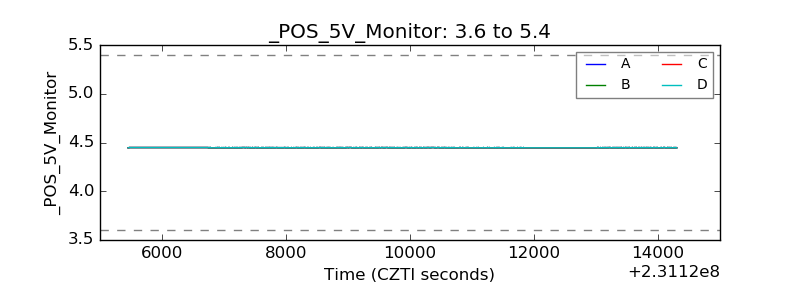 |
| _ROLL_ROT | 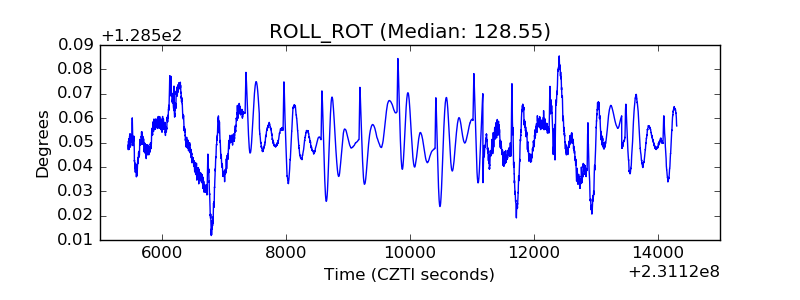 |
| _Roll_DEC | 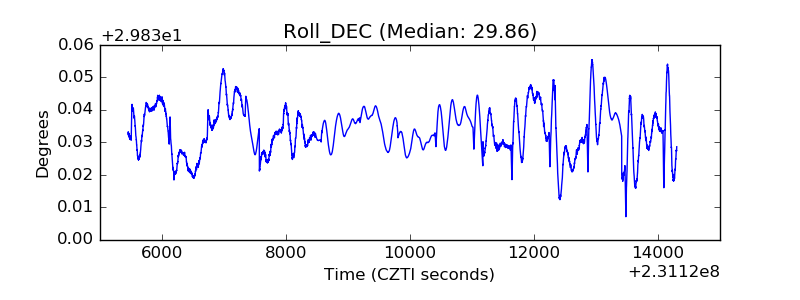 |
| _Roll_RA | 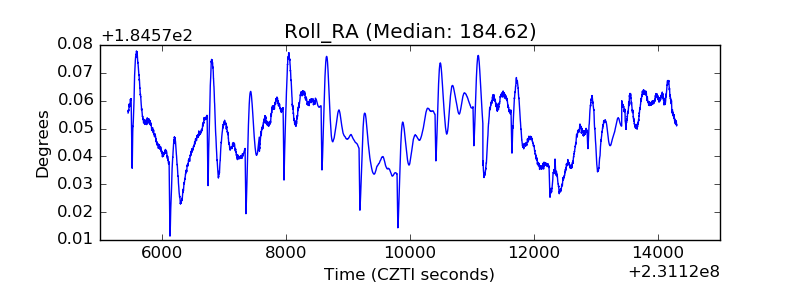 |
| Veto Counter | 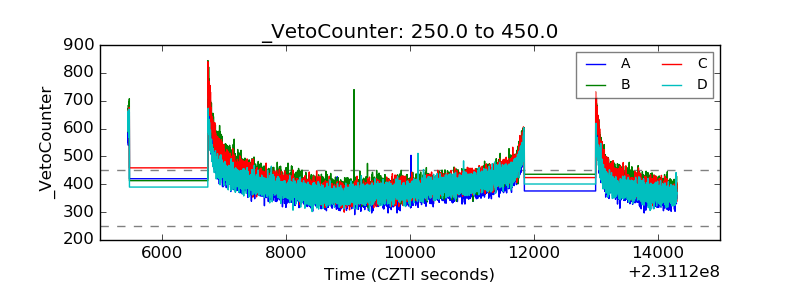 |