| Param | Original file | Final file |
|---|---|---|
| Filename | modeM0/AS1G07_060T01_9000001200_08571cztM0_level2.evt | modeM0/AS1G07_060T01_9000001200_08571cztM0_level2_quad_clean.evt |
| Size (bytes) | 428,129,280 | 75,706,560 |
| Size | 408.3 MB | 72.2 MB |
| Events in quadrant A | 3,083,137 | 459,446 |
| Events in quadrant B | 3,314,048 | 463,827 |
| Events in quadrant C | 2,966,862 | 460,319 |
| Events in quadrant D | 3,146,995 | 442,672 |
| Mode SS | |||
|---|---|---|---|
| Quadrant | BADHDUFLAG | Total packets | Discarded packets |
| A | 0 | 134 | 0 |
| B | 0 | 134 | 0 |
| C | 0 | 134 | 0 |
| D | 0 | 134 | 0 |
| Mode M0 | |||
|---|---|---|---|
| Quadrant | BADHDUFLAG | Total packets | Discarded packets |
| A | 0 | 13883 | 2 |
| B | 0 | 14313 | 1 |
| C | 0 | 13637 | 1 |
| D | 0 | 14155 | 1 |
| Mode M9 | |||
|---|---|---|---|
| Quadrant | BADHDUFLAG | Total packets | Discarded packets |
| A | 0 | 18 | 0 |
| B | 0 | 18 | 0 |
| C | 0 | 18 | 0 |
| D | 0 | 19 | 0 |
| Quadrant | Total seconds | Saturated seconds | Saturation percentage |
|---|---|---|---|
| A | 6691 | 45 | 0.672545% |
| B | 6691 | 105 | 1.569272% |
| C | 6691 | 12 | 0.179345% |
| D | 6691 | 22 | 0.328800% |
Noise dominated data is calculated using 1-second bins in cleaned event files. If a bin has >2000 counts, and if more than 50% of those come from <1% of pixels, then it is considered to be noise-dominated and hence unusable.
| Quadrant | # 1 sec bins | Bins with >0 counts | Bins with >2000 counts | High rate bins dominated by noise | Noise dominated (total time) | Noise dominated (detector-on time) | Marked lightcurve |
|---|---|---|---|---|---|---|---|
| A | 7526 | 6692 | 3 | 3 | 0.04% | 0.04% | 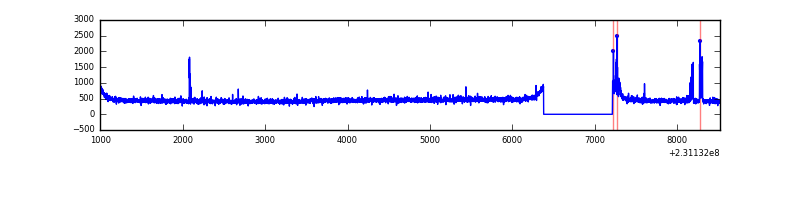 |
| B | 7526 | 6692 | 25 | 25 | 0.33% | 0.37% |  |
| C | 7526 | 6692 | 0 | 0 | 0.00% | 0.00% | 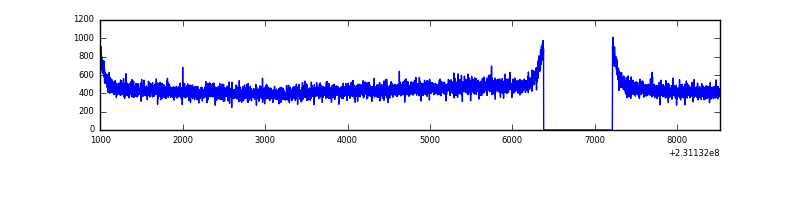 |
| D | 7526 | 6692 | 13 | 13 | 0.17% | 0.19% | 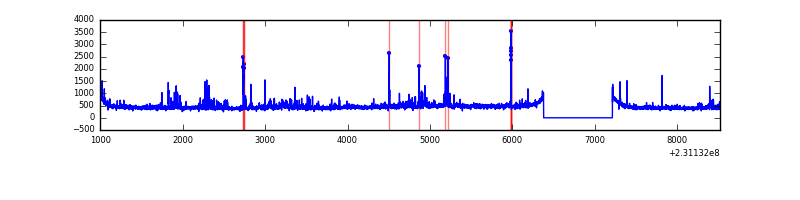 |
Top three noisy pixels from each quadrant. If the there are fewer than three noisy pixels in the level2.evt file, extra rows are filled as -1
| Pixel properties | Quadrant properties | ||||||
|---|---|---|---|---|---|---|---|
| Quadrant | DetID | PixID | Counts | Sigma | Mean | Median | Sigma |
| A | 5 | 112 | 54897 | 343.14 | 778 | 761 | 157.8 |
| A | 15 | 223 | 22167 | 135.68 | 778 | 761 | 157.8 |
| A | 15 | 239 | 10804 | 63.66 | 778 | 761 | 157.8 |
| B | 10 | 16 | 208252 | 1388.07 | 783 | 764 | 149.5 |
| B | 0 | 214 | 21525 | 138.89 | 783 | 764 | 149.5 |
| B | 10 | 252 | 20251 | 130.37 | 783 | 764 | 149.5 |
| C | 13 | 61 | 5759 | 28.31 | 760 | 762 | 176.5 |
| C | 8 | 222 | 3042 | 12.92 | 760 | 762 | 176.5 |
| C | 3 | 202 | 1848 | 6.15 | 760 | 762 | 176.5 |
| D | 1 | 52 | 195527 | 1020.01 | 748 | 726 | 191.0 |
| D | 12 | 233 | 37546 | 192.79 | 748 | 726 | 191.0 |
| D | 7 | 71 | 23499 | 119.24 | 748 | 726 | 191.0 |
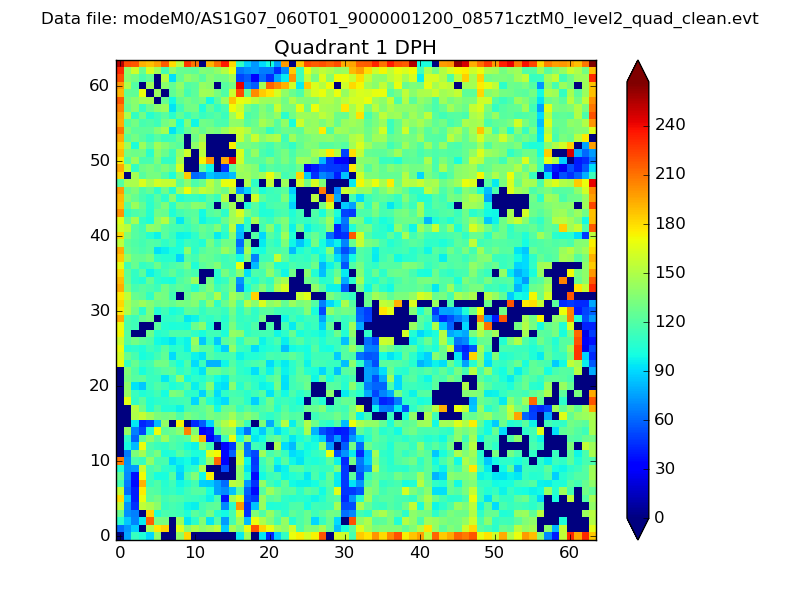
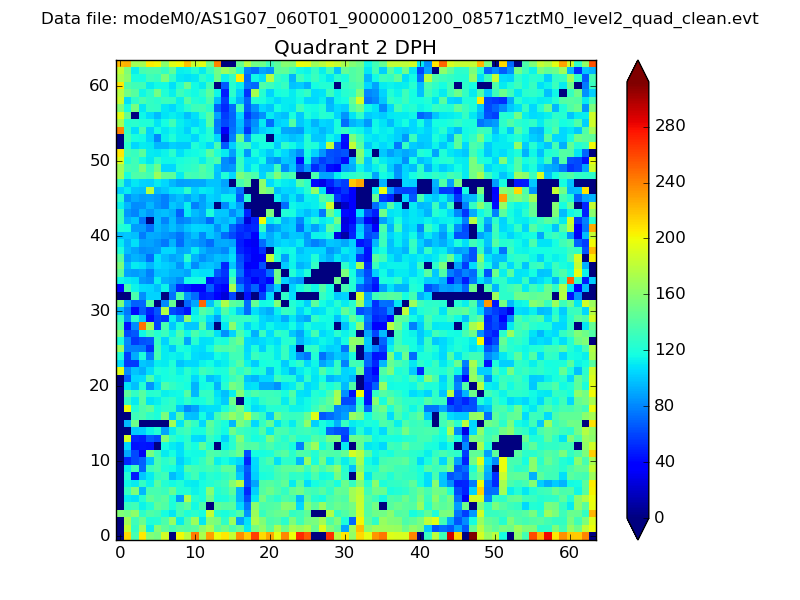
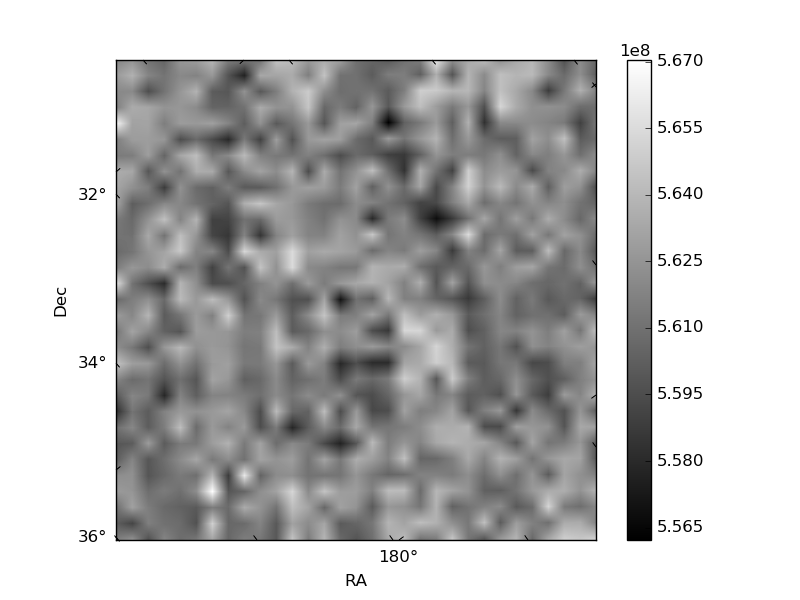
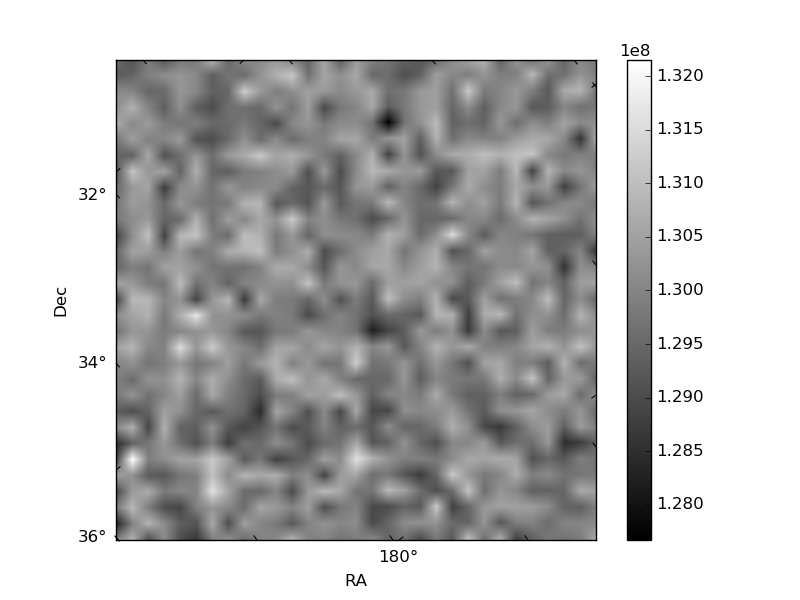
Histogram calculated using DETX and DETY for each event in the final _common_clean file
| Quadrant A | 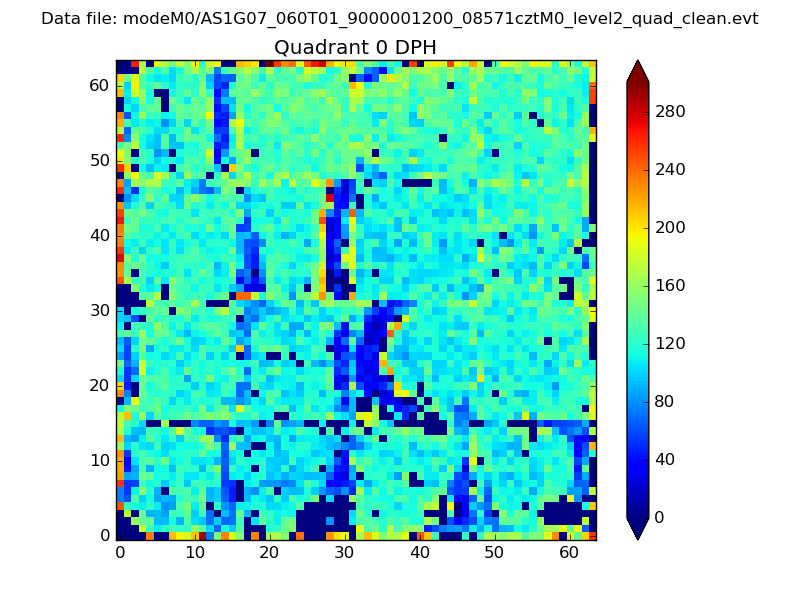 |
 |
Quadrant B |
|---|---|---|---|
| Quadrant D | 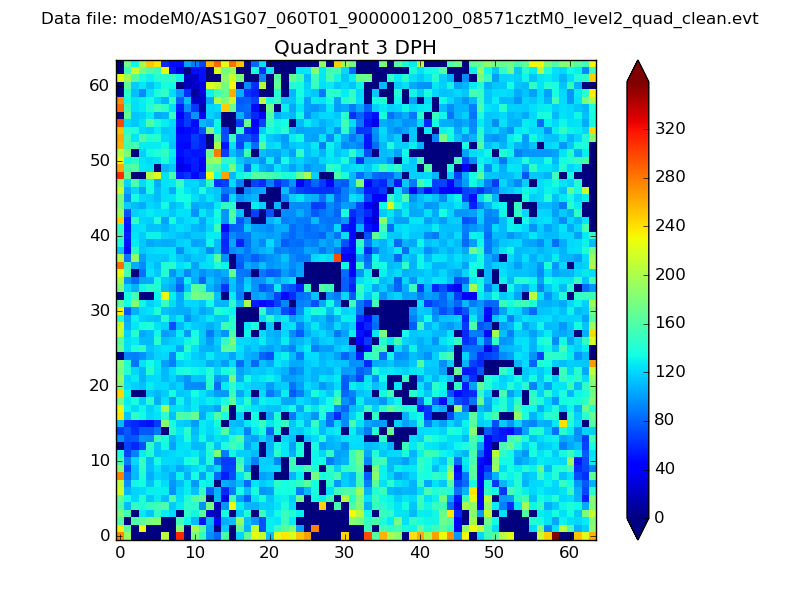 |
 |
Quadrant C |
| Plot type | Count rate plots | Images |
|---|---|---|
| Comparison with Poisson distribution Blue bars denote a histogram of data divided into 1 sec bins. Red curve is a Poisson curve with rate = median count rate of data. |
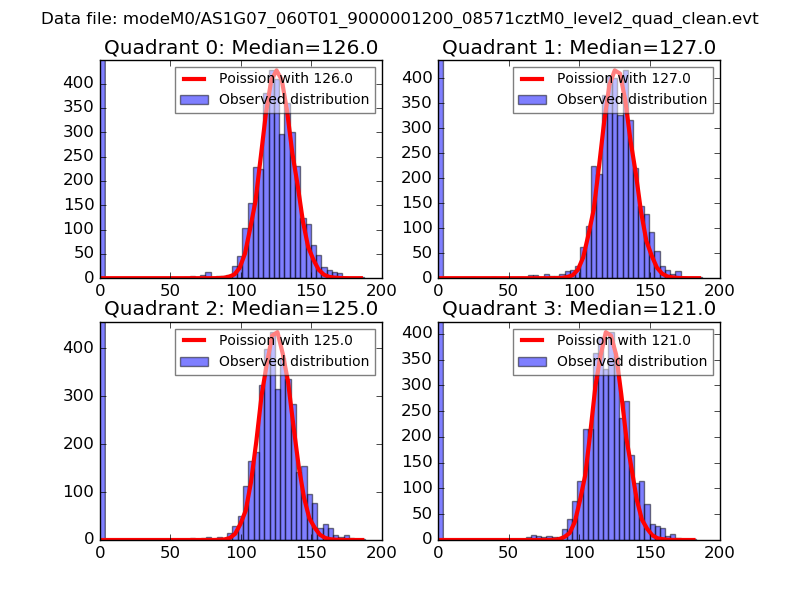 |
 |
| Quadrant-wise count rates Data is divided into 100 sec bins |
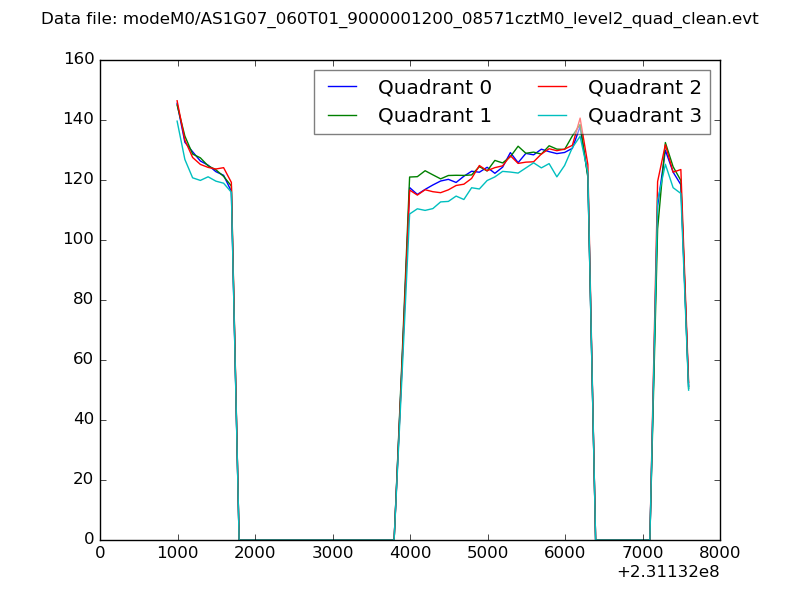 |
|
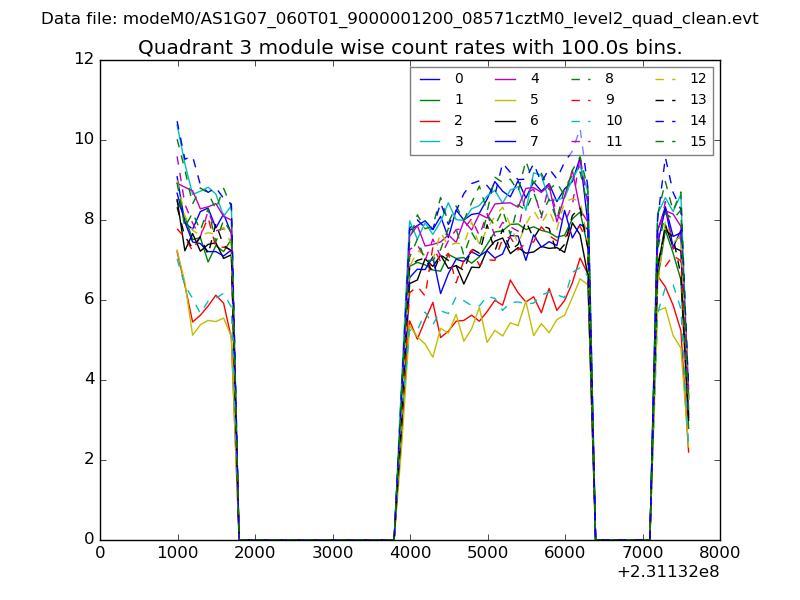
| Module-wise count rates for Quadrant A Data is divided into 100 sec bins |
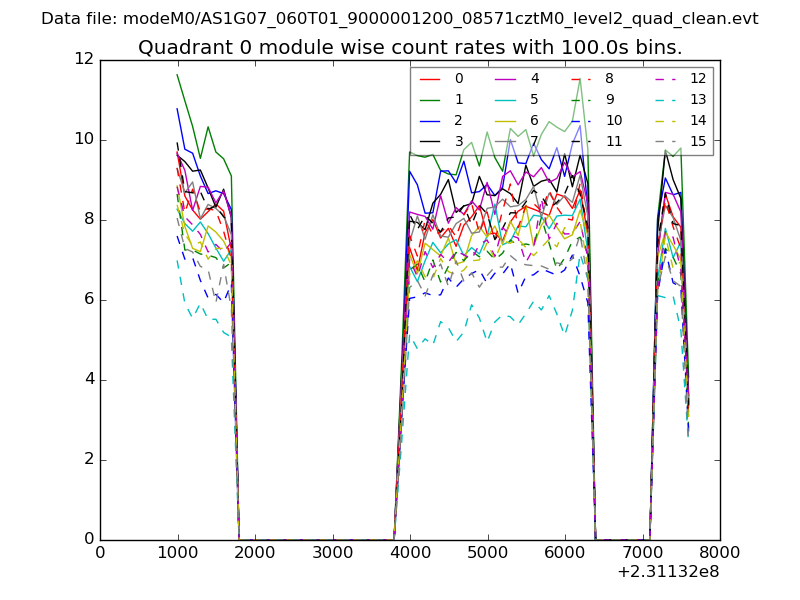 |
 |
| Module-wise count rates for Quadrant B Data is divided into 100 sec bins |
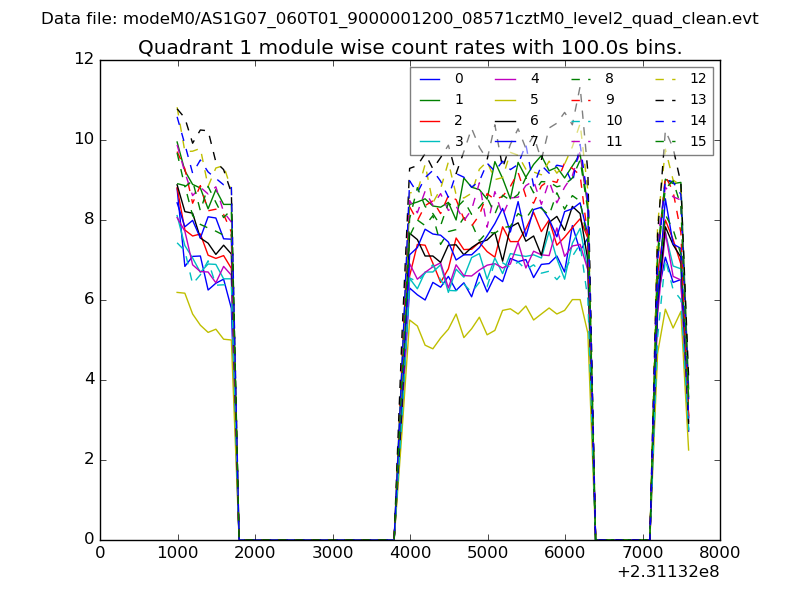 |
 |
| Module-wise count rates for Quadrant C Data is divided into 100 sec bins |
 |
 |
| Module-wise count rates for Quadrant D Data is divided into 100 sec bins |
 |
 |
| Parameter | Plot |
|---|---|
| CZT HV Monitor | 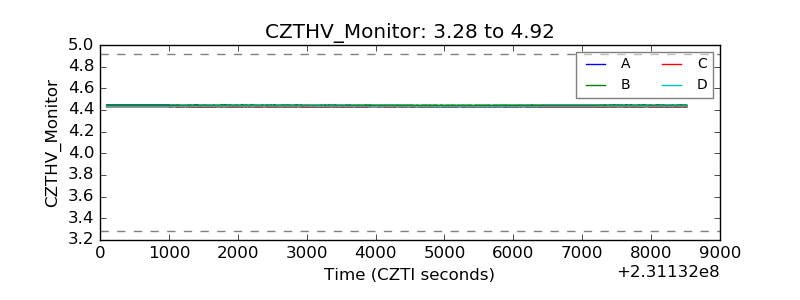 |
| D_VDD | 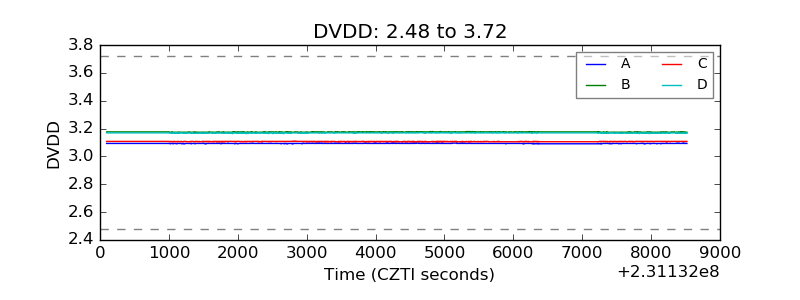 |
| Temperature 1 | 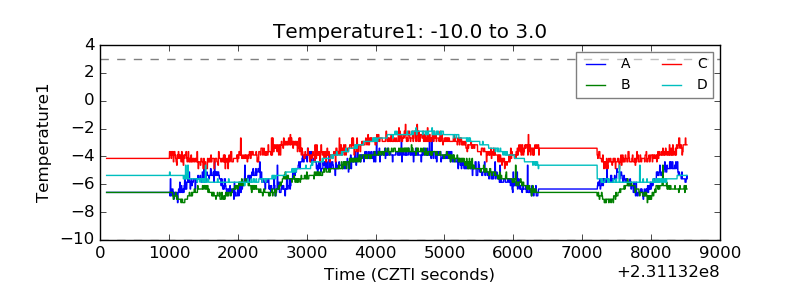 |
| Veto HV Monitor | 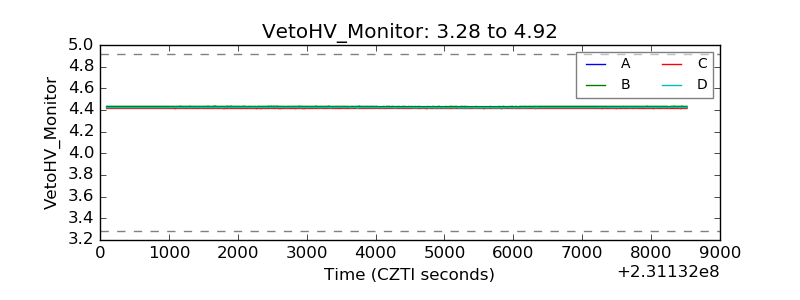 |
| Veto LLD | 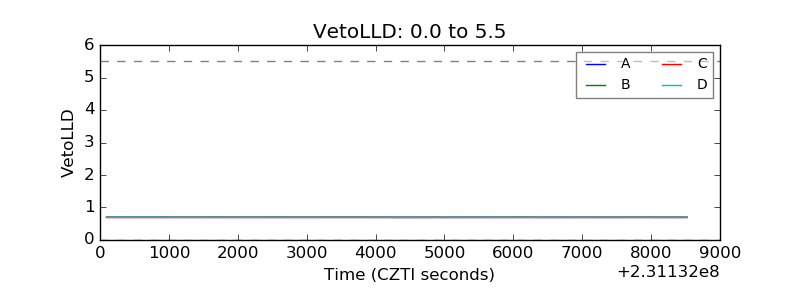 |
| Alpha Counter |  |
| _CPM_Rate |  |
| CZT Counter | 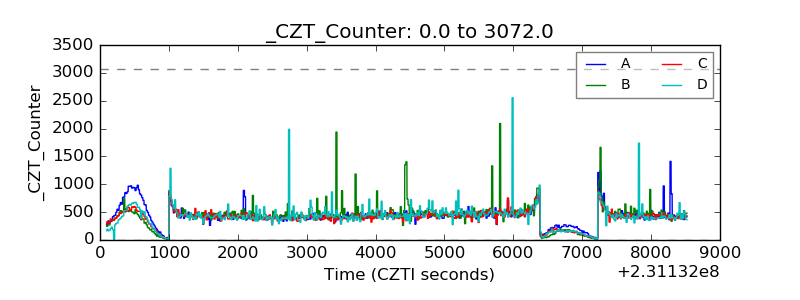 |
| +2.5 Volts monitor |  |
| +5 Volts monitor |  |
| _ROLL_ROT | 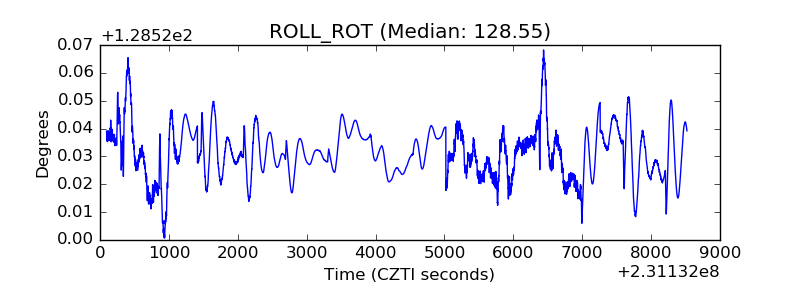 |
| _Roll_DEC | 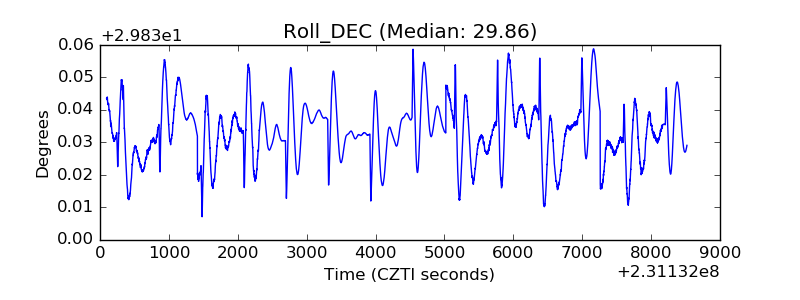 |
| _Roll_RA | 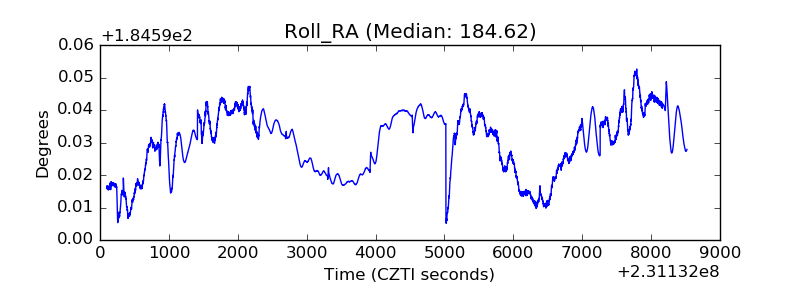 |
| Veto Counter | 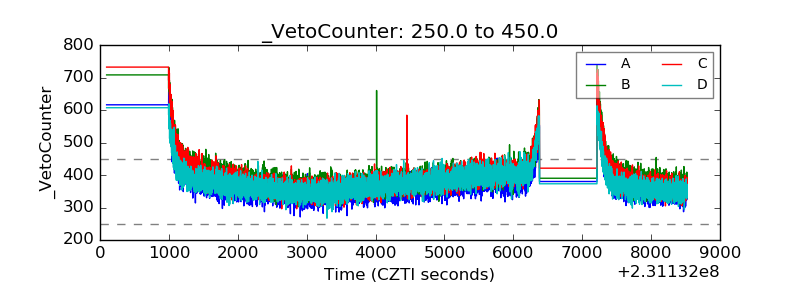 |