| Param | Original file | Final file |
|---|---|---|
| Filename | modeM0/AS1G07_060T01_9000001200_08572cztM0_level2.evt | modeM0/AS1G07_060T01_9000001200_08572cztM0_level2_quad_clean.evt |
| Size (bytes) | 495,855,360 | 78,192,000 |
| Size | 472.9 MB | 74.6 MB |
| Events in quadrant A | 3,480,347 | 464,422 |
| Events in quadrant B | 3,830,681 | 470,806 |
| Events in quadrant C | 3,354,905 | 468,595 |
| Events in quadrant D | 3,848,391 | 448,942 |
| Mode SS | |||
|---|---|---|---|
| Quadrant | BADHDUFLAG | Total packets | Discarded packets |
| A | 0 | 150 | 0 |
| B | 0 | 150 | 0 |
| C | 0 | 150 | 0 |
| D | 0 | 150 | 0 |
| Mode M0 | |||
|---|---|---|---|
| Quadrant | BADHDUFLAG | Total packets | Discarded packets |
| A | 0 | 15568 | 3 |
| B | 0 | 16305 | 2 |
| C | 0 | 15328 | 2 |
| D | 0 | 16739 | 2 |
| Mode M9 | |||
|---|---|---|---|
| Quadrant | BADHDUFLAG | Total packets | Discarded packets |
| A | 0 | 7 | 0 |
| B | 0 | 7 | 0 |
| C | 0 | 7 | 0 |
| D | 0 | 8 | 0 |
| Quadrant | Total seconds | Saturated seconds | Saturation percentage |
|---|---|---|---|
| A | 7392 | 234 | 3.165584% |
| B | 7392 | 289 | 3.909632% |
| C | 7392 | 140 | 1.893939% |
| D | 7392 | 180 | 2.435065% |
Noise dominated data is calculated using 1-second bins in cleaned event files. If a bin has >2000 counts, and if more than 50% of those come from <1% of pixels, then it is considered to be noise-dominated and hence unusable.
| Quadrant | # 1 sec bins | Bins with >0 counts | Bins with >2000 counts | High rate bins dominated by noise | Noise dominated (total time) | Noise dominated (detector-on time) | Marked lightcurve |
|---|---|---|---|---|---|---|---|
| A | 7682 | 7392 | 3 | 3 | 0.04% | 0.04% | 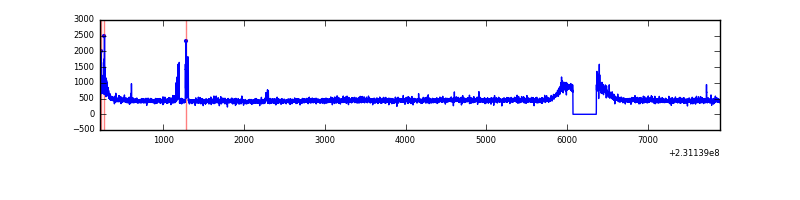 |
| B | 7682 | 7392 | 36 | 36 | 0.47% | 0.49% | 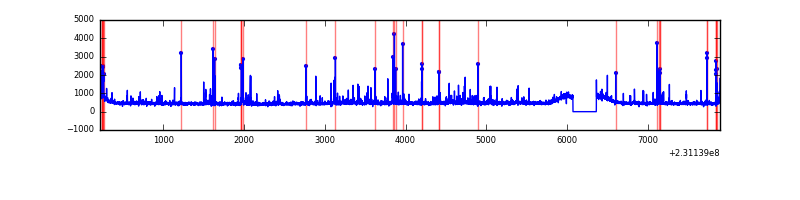 |
| C | 7682 | 7393 | 0 | 0 | 0.00% | 0.00% | 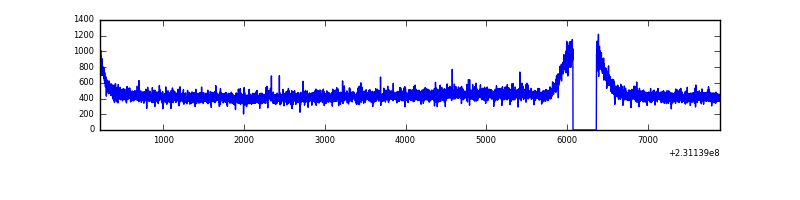 |
| D | 7682 | 7392 | 10 | 10 | 0.13% | 0.14% | 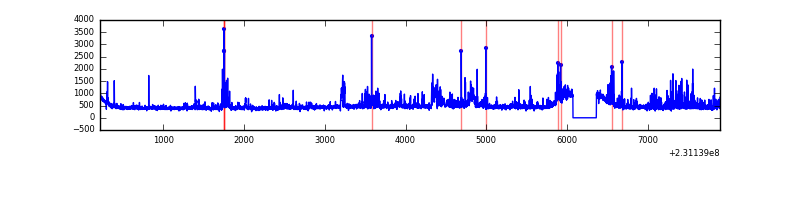 |
Top three noisy pixels from each quadrant. If the there are fewer than three noisy pixels in the level2.evt file, extra rows are filled as -1
| Pixel properties | Quadrant properties | ||||||
|---|---|---|---|---|---|---|---|
| Quadrant | DetID | PixID | Counts | Sigma | Mean | Median | Sigma |
| A | 5 | 112 | 62981 | 343.09 | 878 | 858 | 181.1 |
| A | 15 | 223 | 20013 | 105.79 | 878 | 858 | 181.1 |
| A | 15 | 239 | 10192 | 51.55 | 878 | 858 | 181.1 |
| B | 10 | 16 | 338944 | 1960.91 | 879 | 855 | 172.4 |
| B | 0 | 214 | 44414 | 252.64 | 879 | 855 | 172.4 |
| B | 12 | 111 | 20353 | 113.09 | 879 | 855 | 172.4 |
| C | 13 | 61 | 6629 | 28.84 | 857 | 859 | 200.1 |
| C | 2 | 244 | 6479 | 28.09 | 857 | 859 | 200.1 |
| C | 8 | 222 | 3951 | 15.45 | 857 | 859 | 200.1 |
| D | 1 | 52 | 290581 | 1315.98 | 846 | 826 | 220.2 |
| D | 14 | 34 | 135100 | 609.83 | 846 | 826 | 220.2 |
| D | 13 | 105 | 76028 | 341.55 | 846 | 826 | 220.2 |
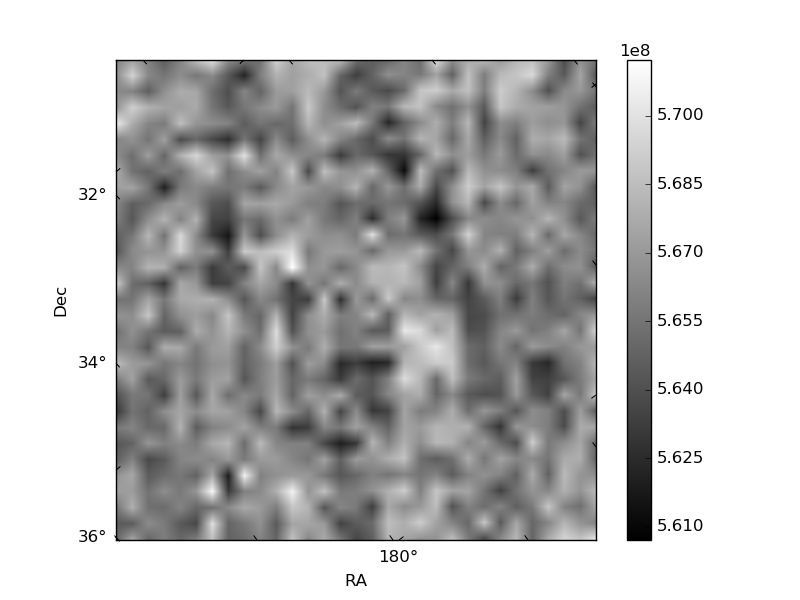
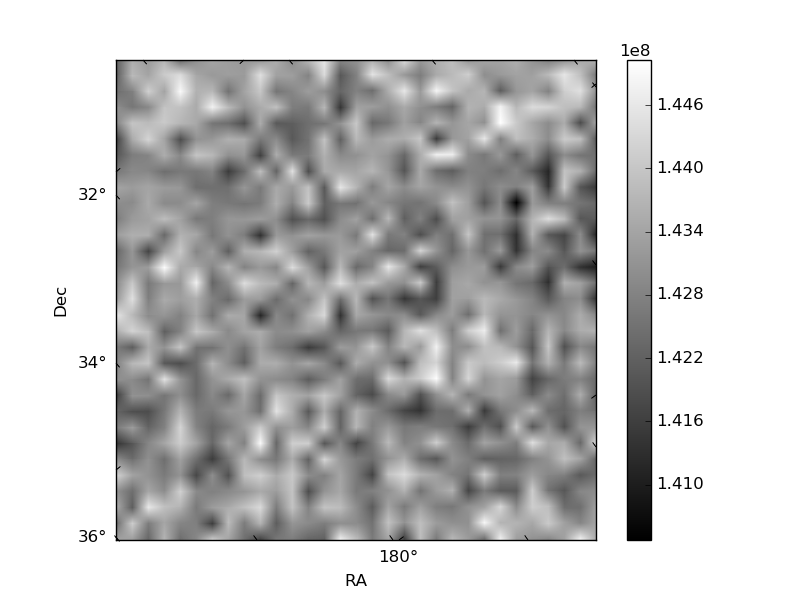
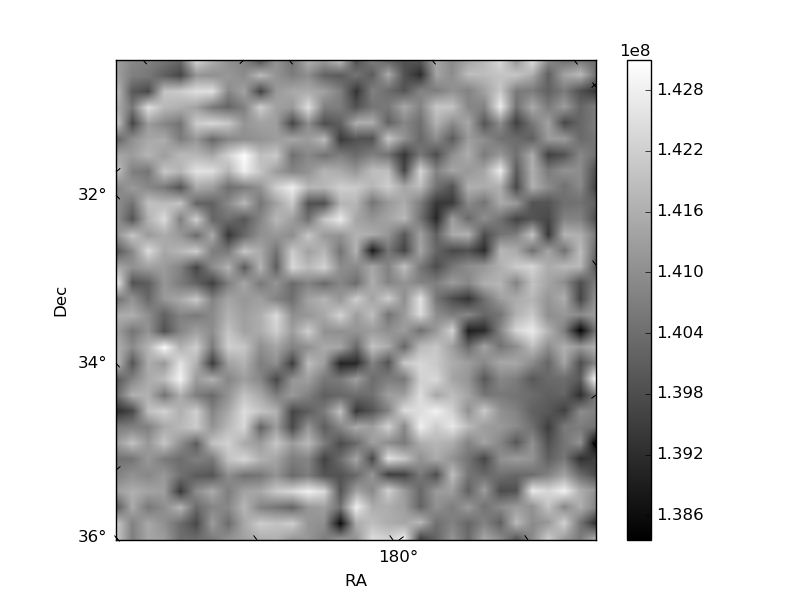
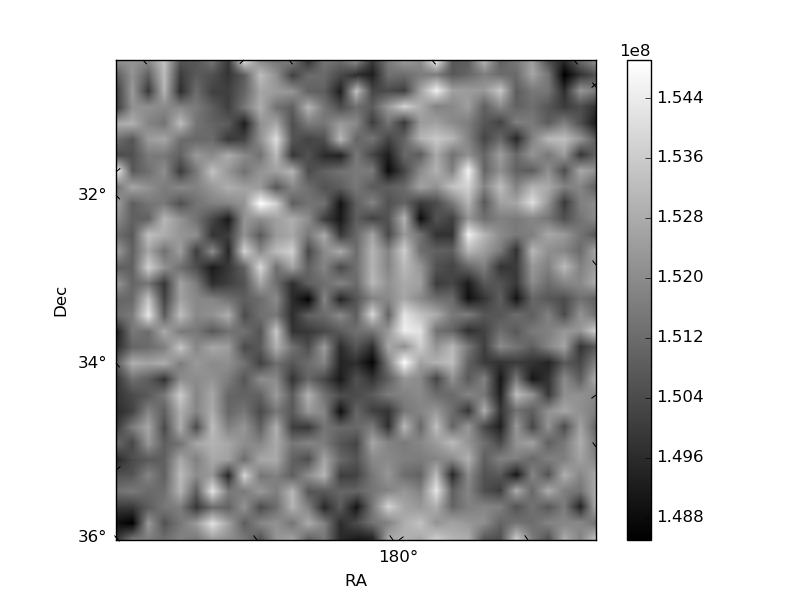
Histogram calculated using DETX and DETY for each event in the final _common_clean file
| Quadrant A | 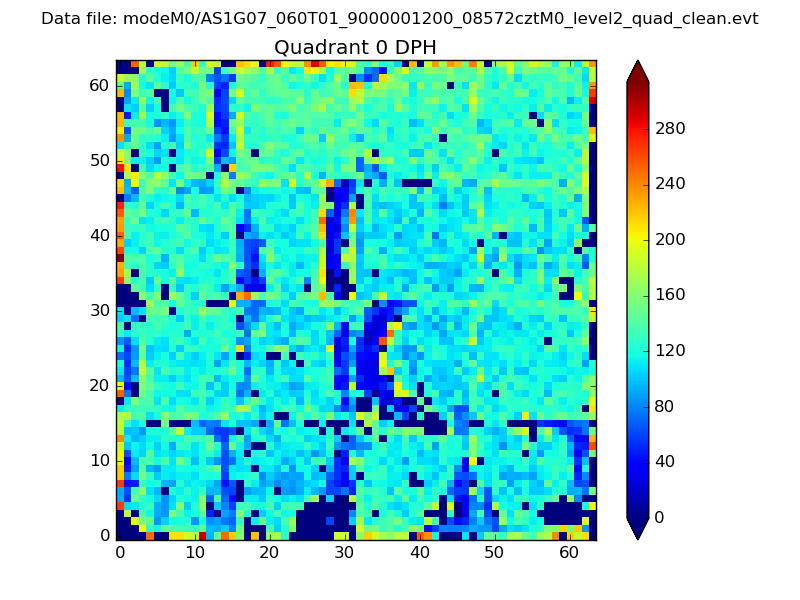 |
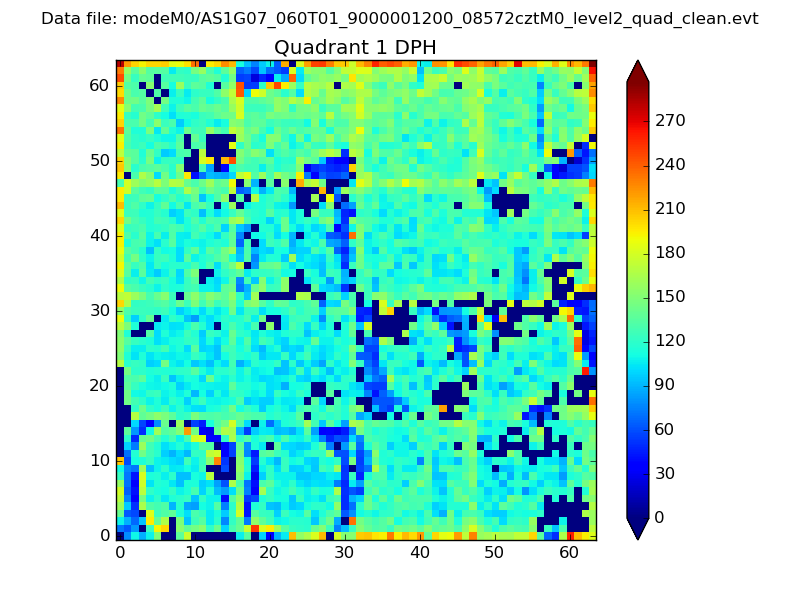 |
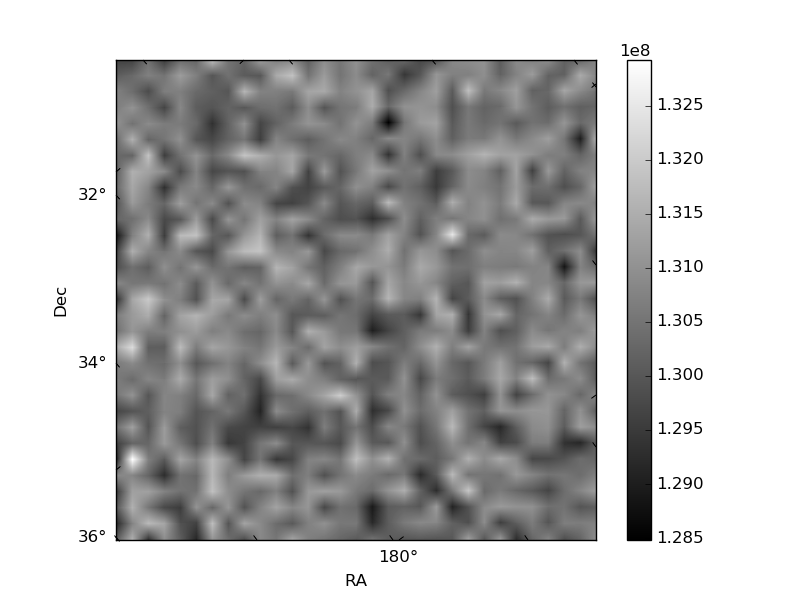
Quadrant B |
|---|---|---|---|
| Quadrant D | 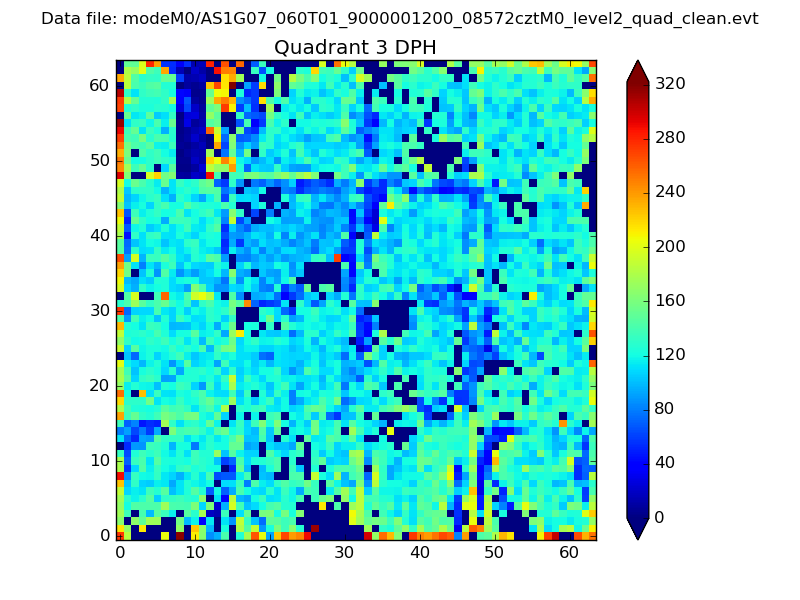 |
 |
Quadrant C |
| Plot type | Count rate plots | Images |
|---|---|---|
| Comparison with Poisson distribution Blue bars denote a histogram of data divided into 1 sec bins. Red curve is a Poisson curve with rate = median count rate of data. |
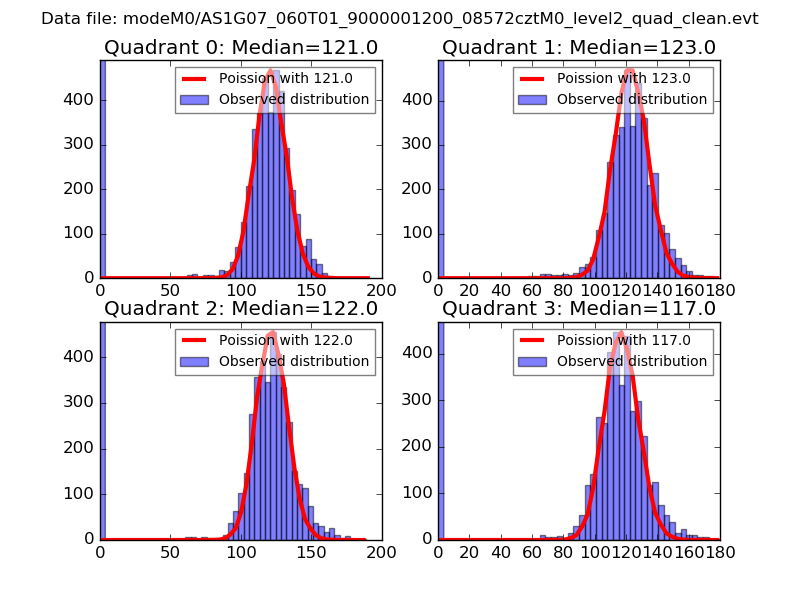 |
 |
| Quadrant-wise count rates Data is divided into 100 sec bins |
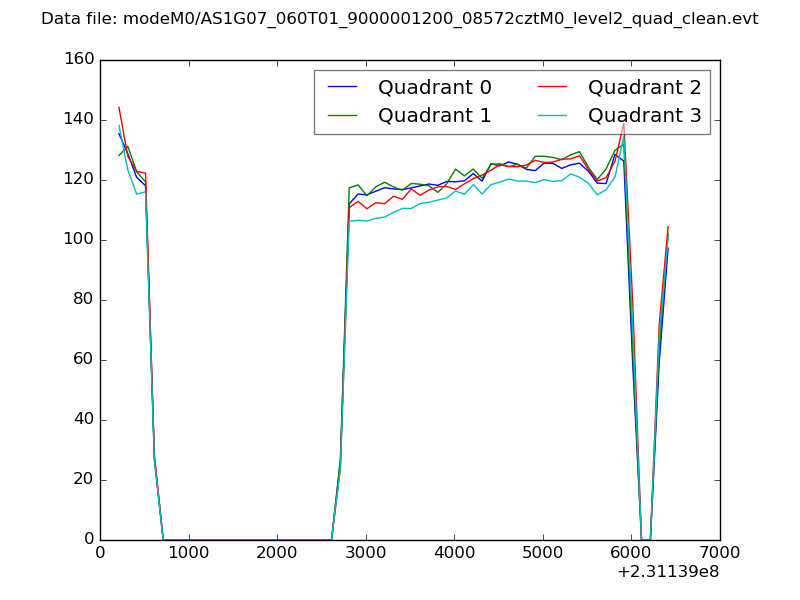 |
|
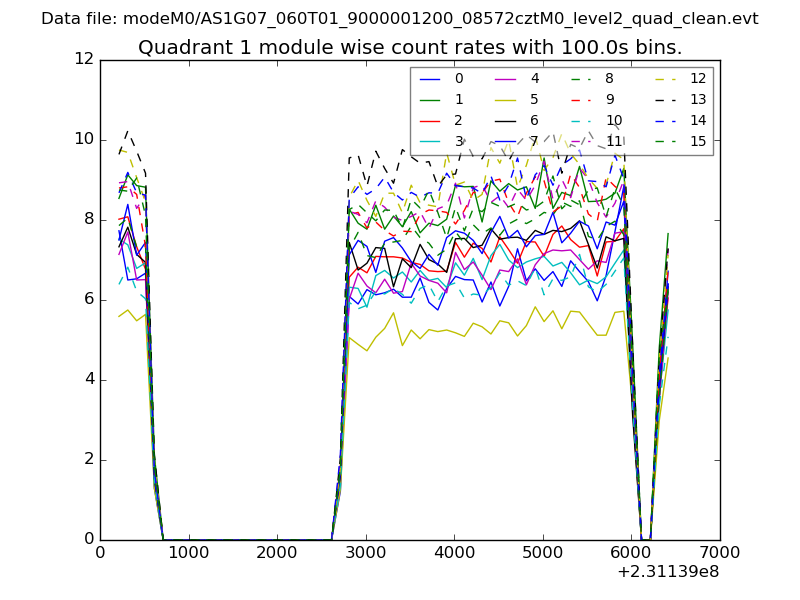
| Module-wise count rates for Quadrant A Data is divided into 100 sec bins |
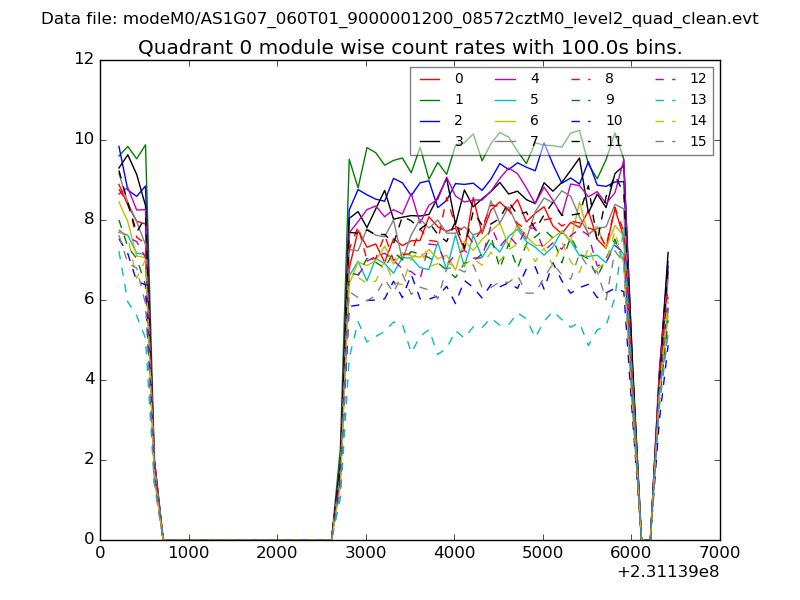 |
 |
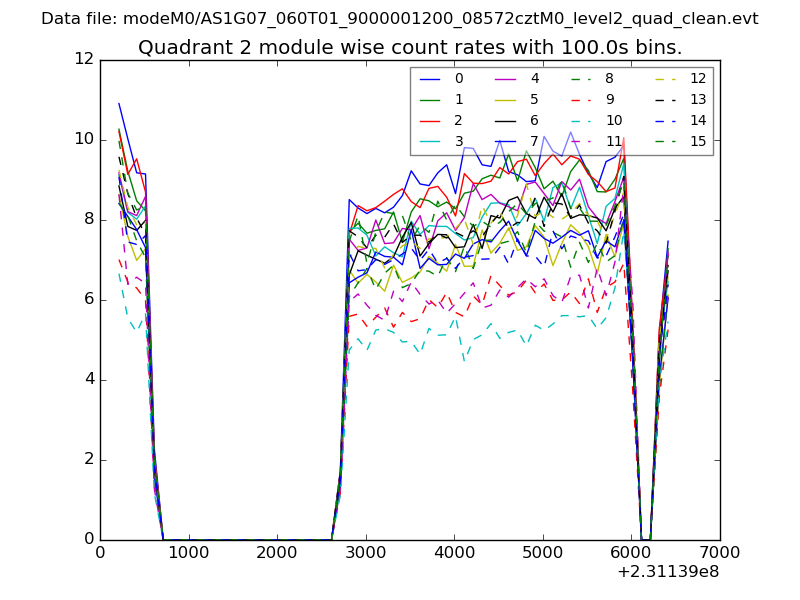
| Module-wise count rates for Quadrant B Data is divided into 100 sec bins |
 |
 |
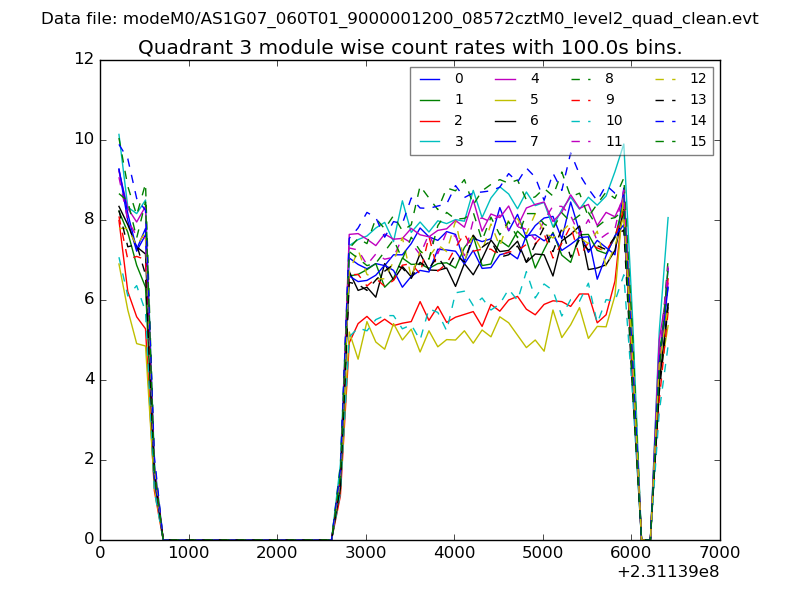
| Module-wise count rates for Quadrant C Data is divided into 100 sec bins |
 |
 |
| Module-wise count rates for Quadrant D Data is divided into 100 sec bins |
 |
 |
| Parameter | Plot |
|---|---|
| CZT HV Monitor | 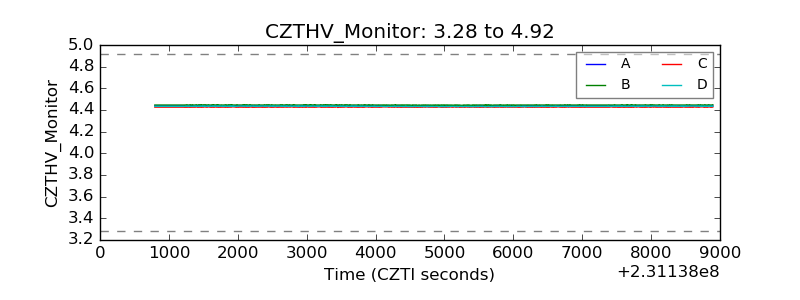 |
| D_VDD | 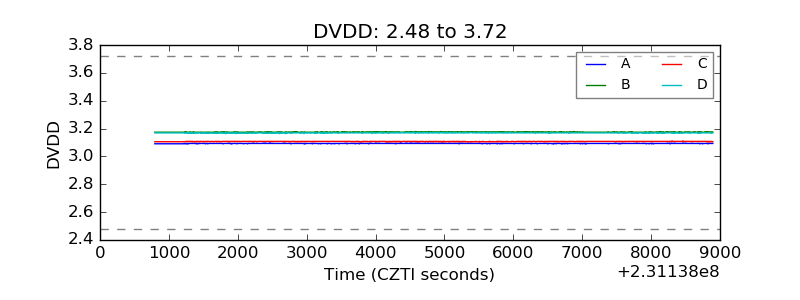 |
| Temperature 1 | 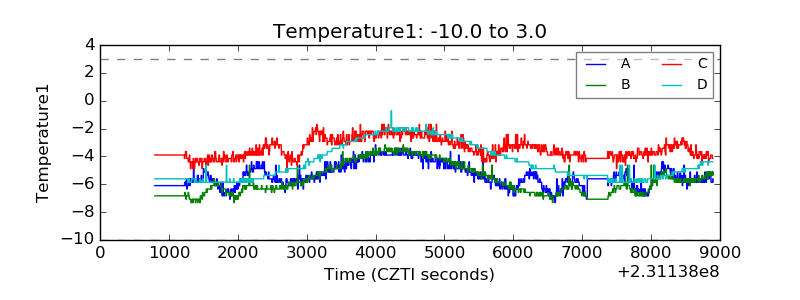 |
| Veto HV Monitor | 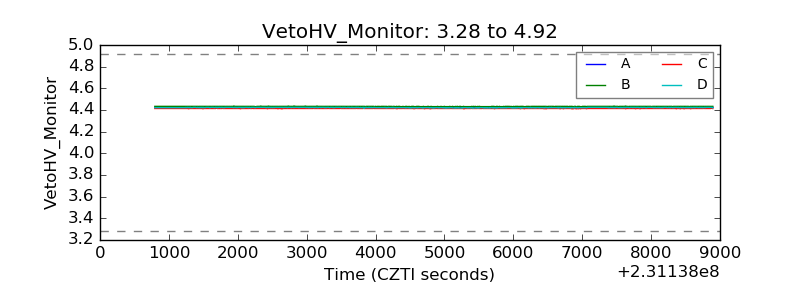 |
| Veto LLD | 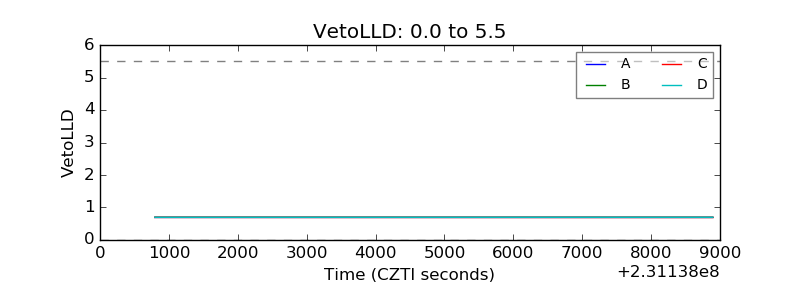 |
| Alpha Counter | 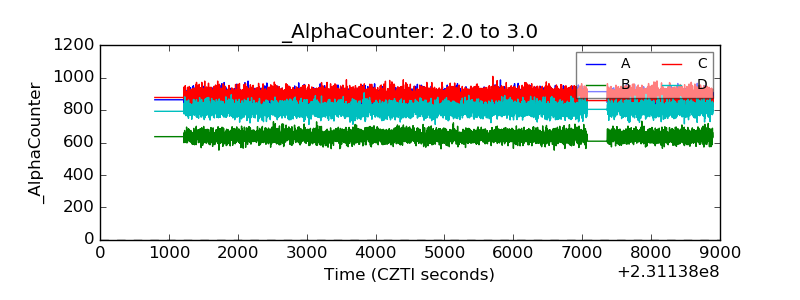 |
| _CPM_Rate | 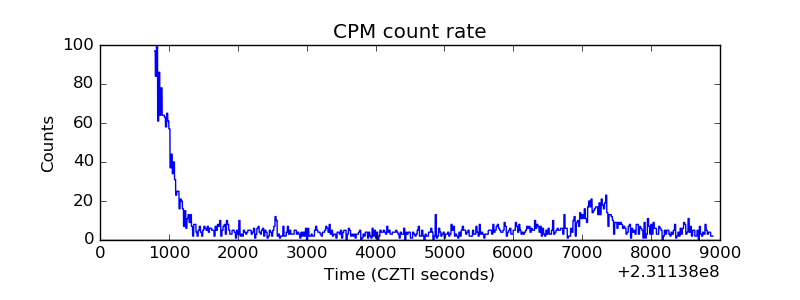 |
| CZT Counter |  |
| +2.5 Volts monitor |  |
| +5 Volts monitor |  |
| _ROLL_ROT | 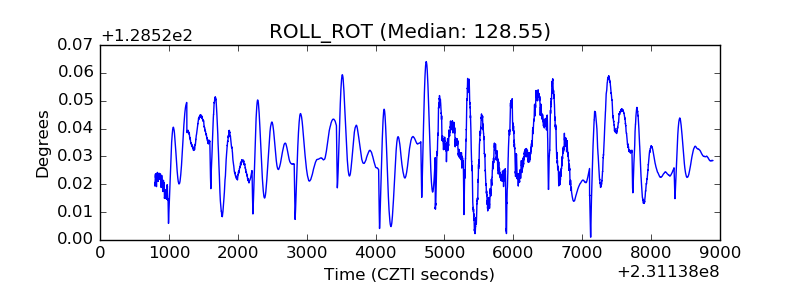 |
| _Roll_DEC | 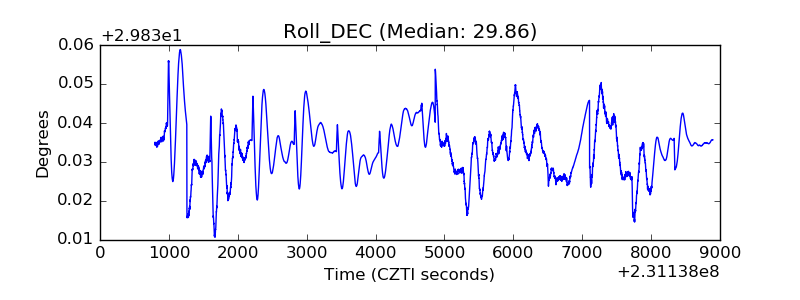 |
| _Roll_RA | 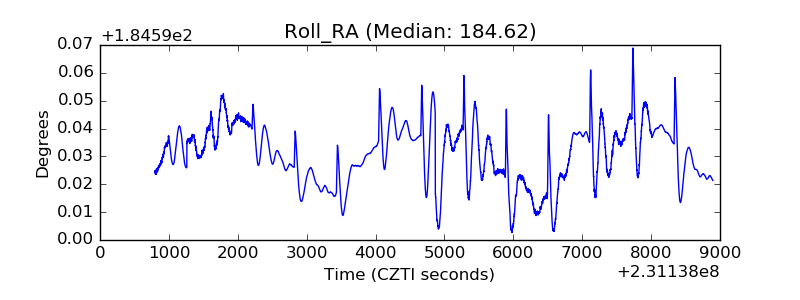 |
| Veto Counter | 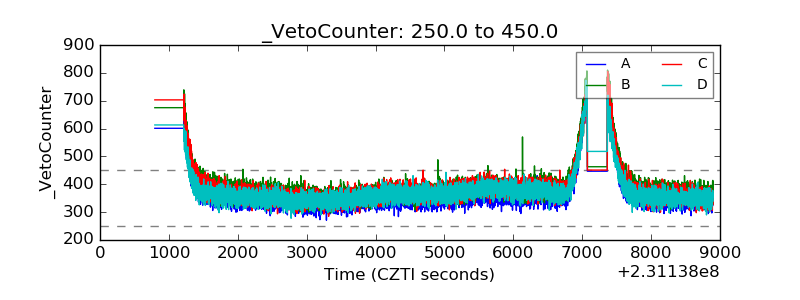 |