| Param | Original file | Final file |
|---|---|---|
| Filename | modeM0/AS1G07_060T01_9000001200_08573cztM0_level2.evt | modeM0/AS1G07_060T01_9000001200_08573cztM0_level2_quad_clean.evt |
| Size (bytes) | 568,045,440 | 82,920,960 |
| Size | 541.7 MB | 79.1 MB |
| Events in quadrant A | 3,980,076 | 485,025 |
| Events in quadrant B | 4,277,369 | 492,573 |
| Events in quadrant C | 3,855,078 | 490,253 |
| Events in quadrant D | 4,533,309 | 472,925 |
| Mode SS | |||
|---|---|---|---|
| Quadrant | BADHDUFLAG | Total packets | Discarded packets |
| A | 0 | 166 | 0 |
| B | 0 | 166 | 0 |
| C | 0 | 166 | 0 |
| D | 0 | 166 | 0 |
| Mode M0 | |||
|---|---|---|---|
| Quadrant | BADHDUFLAG | Total packets | Discarded packets |
| A | 0 | 17617 | 5 |
| B | 0 | 18220 | 2 |
| C | 0 | 17339 | 4 |
| D | 0 | 18892 | 2 |
| Mode M9 | |||
|---|---|---|---|
| Quadrant | BADHDUFLAG | Total packets | Discarded packets |
| A | 0 | 3 | 0 |
| B | 0 | 3 | 0 |
| C | 0 | 3 | 0 |
| D | 0 | 3 | 0 |
| Quadrant | Total seconds | Saturated seconds | Saturation percentage |
|---|---|---|---|
| A | 8199 | 512 | 6.244664% |
| B | 8200 | 554 | 6.756098% |
| C | 8199 | 343 | 4.183437% |
| D | 8200 | 471 | 5.743902% |
Noise dominated data is calculated using 1-second bins in cleaned event files. If a bin has >2000 counts, and if more than 50% of those come from <1% of pixels, then it is considered to be noise-dominated and hence unusable.
| Quadrant | # 1 sec bins | Bins with >0 counts | Bins with >2000 counts | High rate bins dominated by noise | Noise dominated (total time) | Noise dominated (detector-on time) | Marked lightcurve |
|---|---|---|---|---|---|---|---|
| A | 8505 | 8200 | 7 | 7 | 0.08% | 0.09% | 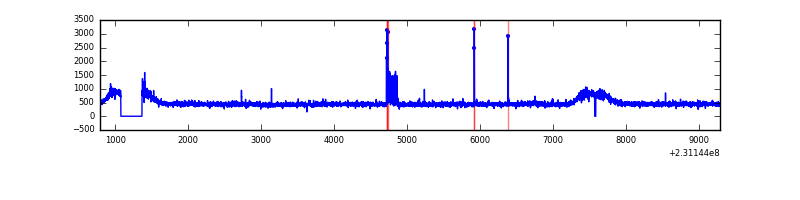 |
| B | 8505 | 8201 | 31 | 31 | 0.36% | 0.38% | 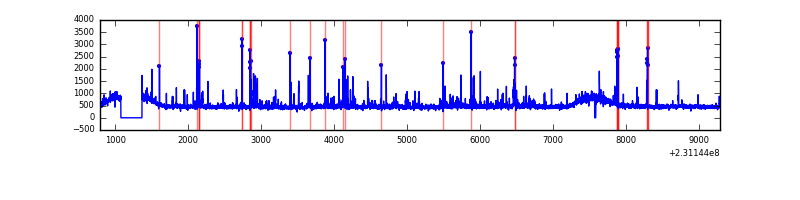 |
| C | 8505 | 8201 | 0 | 0 | 0.00% | 0.00% | 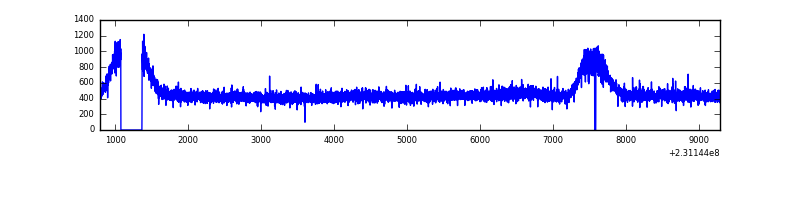 |
| D | 8505 | 8200 | 76 | 76 | 0.89% | 0.93% | 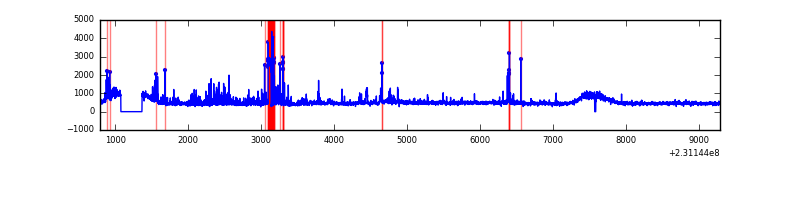 |
Top three noisy pixels from each quadrant. If the there are fewer than three noisy pixels in the level2.evt file, extra rows are filled as -1
| Pixel properties | Quadrant properties | ||||||
|---|---|---|---|---|---|---|---|
| Quadrant | DetID | PixID | Counts | Sigma | Mean | Median | Sigma |
| A | 15 | 174 | 87173 | 416.14 | 1006 | 979 | 207.1 |
| A | 0 | 226 | 9363 | 40.48 | 1006 | 979 | 207.1 |
| A | 12 | 194 | 8655 | 37.06 | 1006 | 979 | 207.1 |
| B | 10 | 16 | 302014 | 1505.72 | 1006 | 976 | 199.9 |
| B | 10 | 252 | 28226 | 136.3 | 1006 | 976 | 199.9 |
| B | 12 | 111 | 23415 | 112.23 | 1006 | 976 | 199.9 |
| C | 13 | 61 | 7725 | 29.04 | 984 | 986 | 232.1 |
| C | 8 | 128 | 5243 | 18.34 | 984 | 986 | 232.1 |
| C | 8 | 222 | 5052 | 17.52 | 984 | 986 | 232.1 |
| D | 14 | 34 | 333234 | 1357.54 | 972 | 947 | 244.8 |
| D | 1 | 52 | 262712 | 1069.42 | 972 | 947 | 244.8 |
| D | 8 | 195 | 108263 | 438.43 | 972 | 947 | 244.8 |
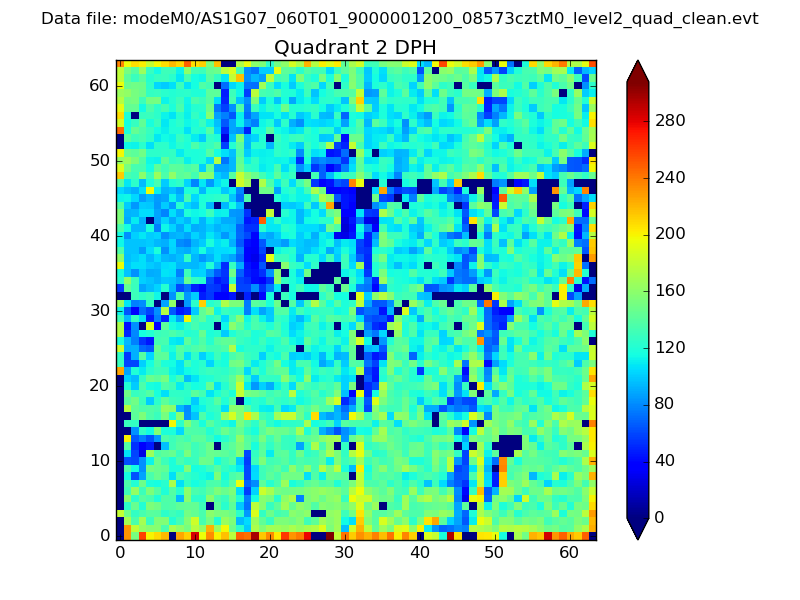
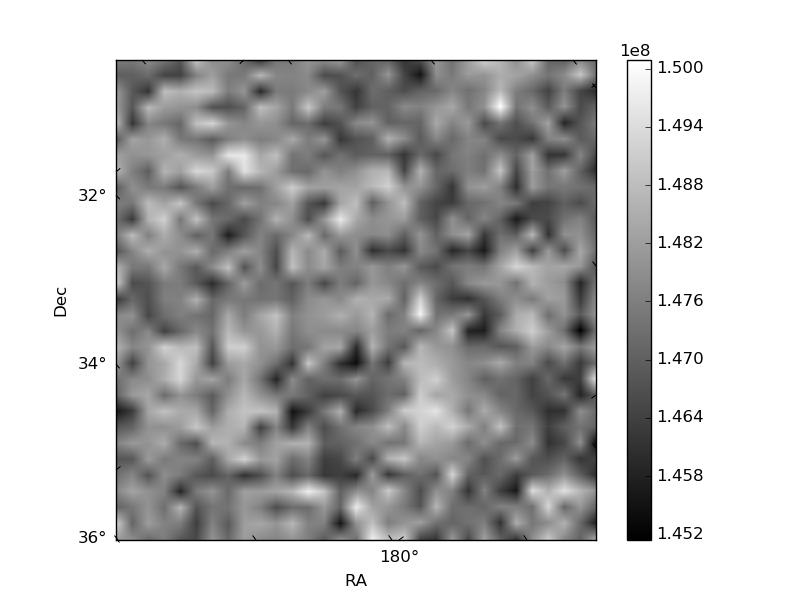
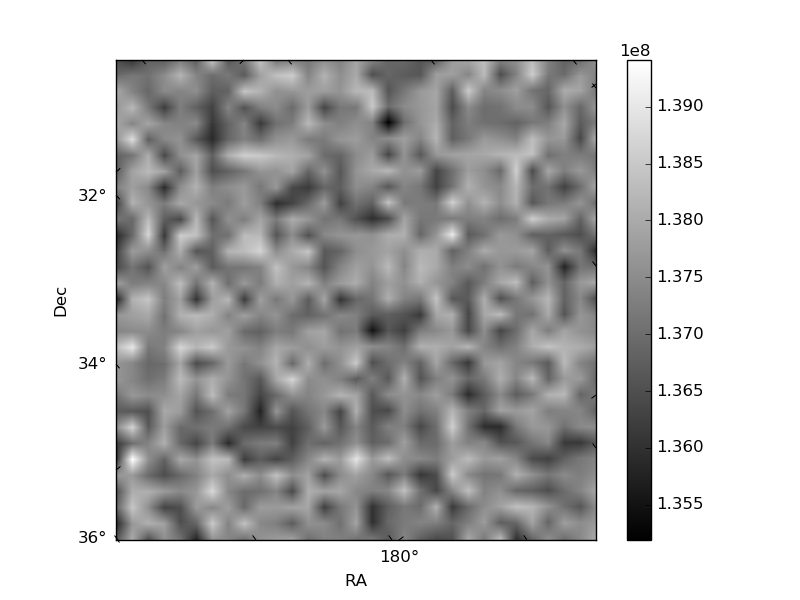
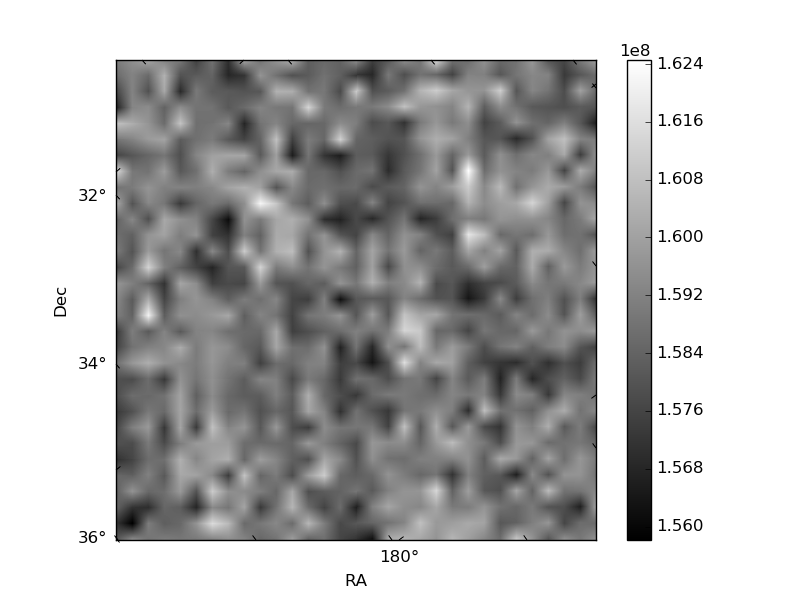
Histogram calculated using DETX and DETY for each event in the final _common_clean file
| Quadrant A | 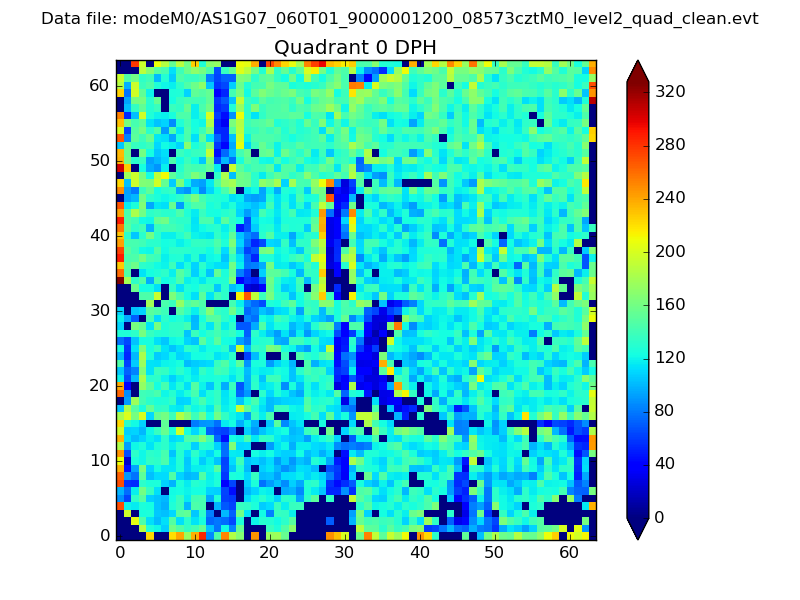 |
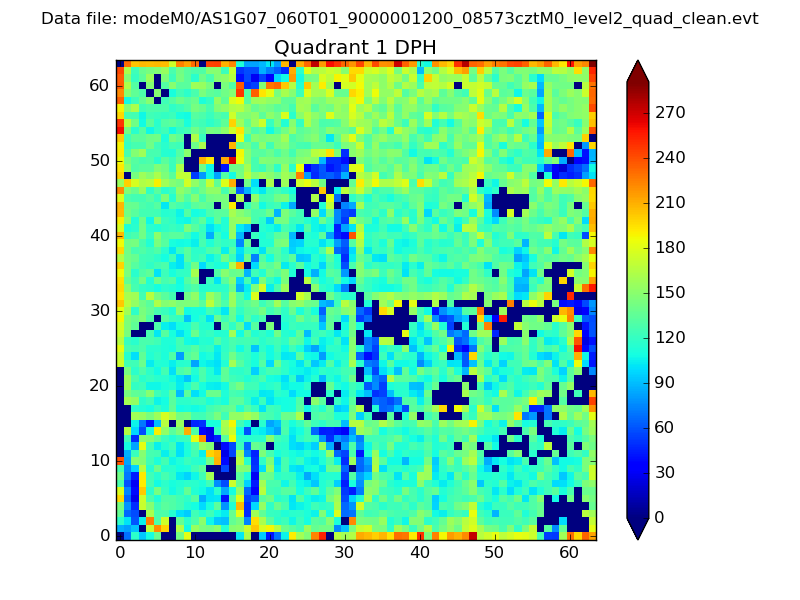 |
Quadrant B |
|---|---|---|---|
| Quadrant D | 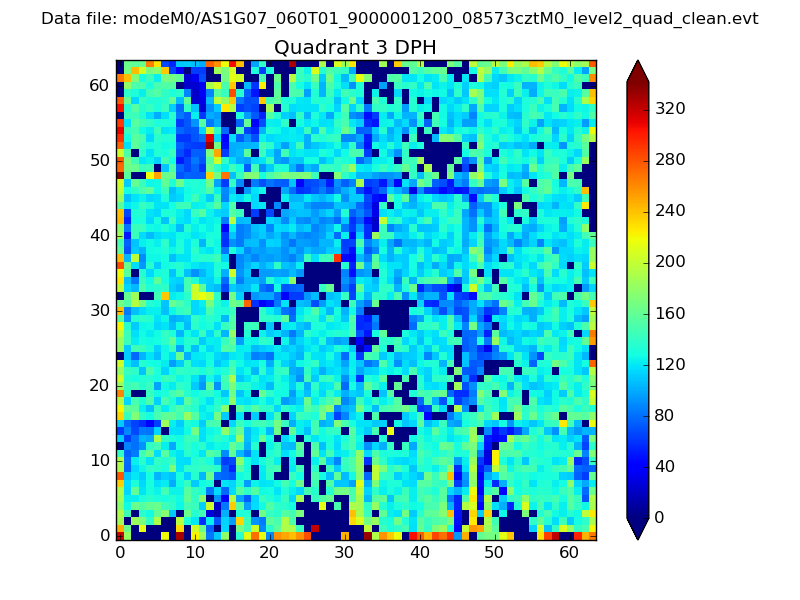 |
 |
Quadrant C |
| Plot type | Count rate plots | Images |
|---|---|---|
| Comparison with Poisson distribution Blue bars denote a histogram of data divided into 1 sec bins. Red curve is a Poisson curve with rate = median count rate of data. |
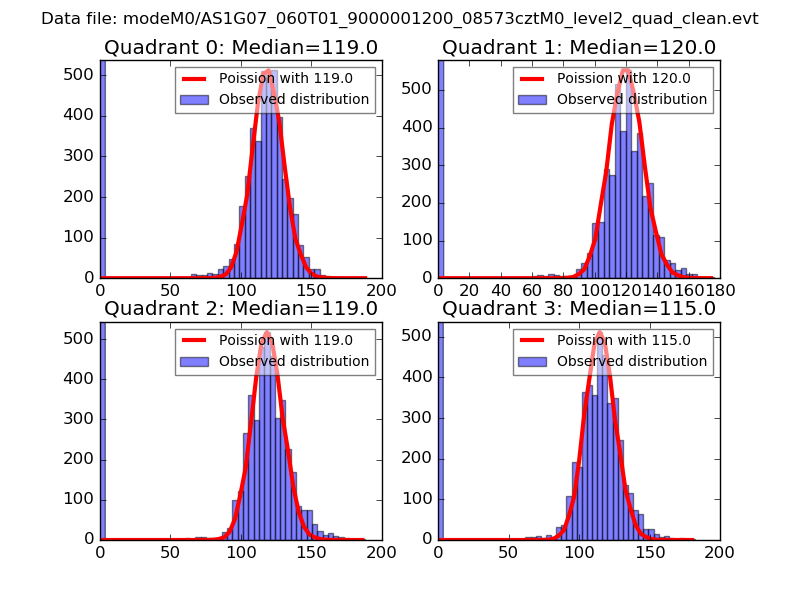 |
 |
| Quadrant-wise count rates Data is divided into 100 sec bins |
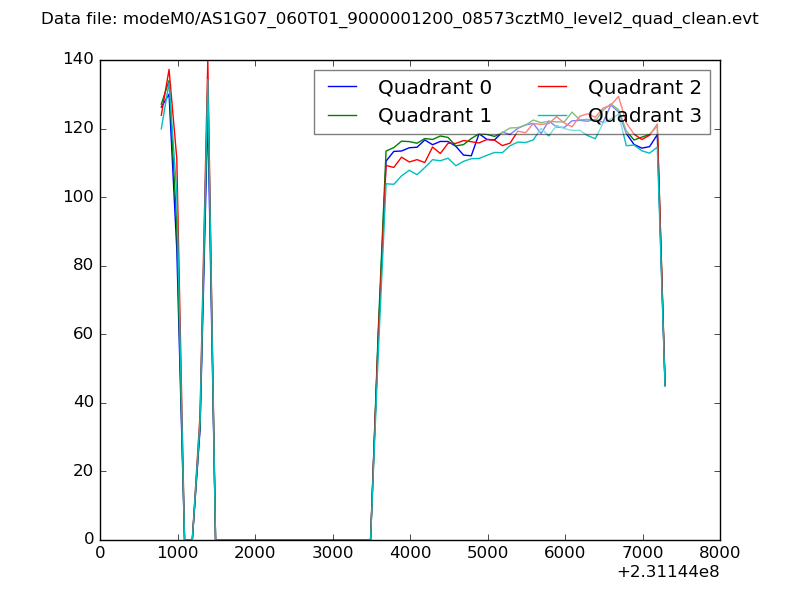 |
|
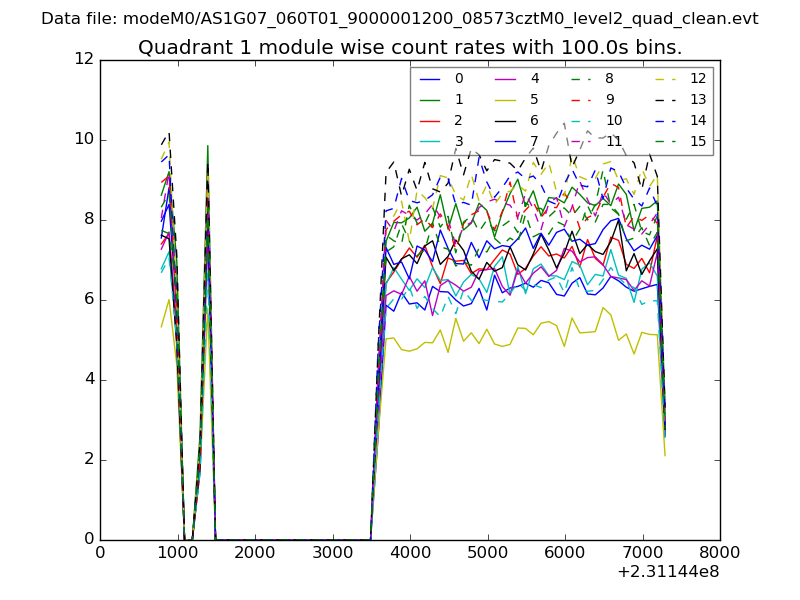
| Module-wise count rates for Quadrant A Data is divided into 100 sec bins |
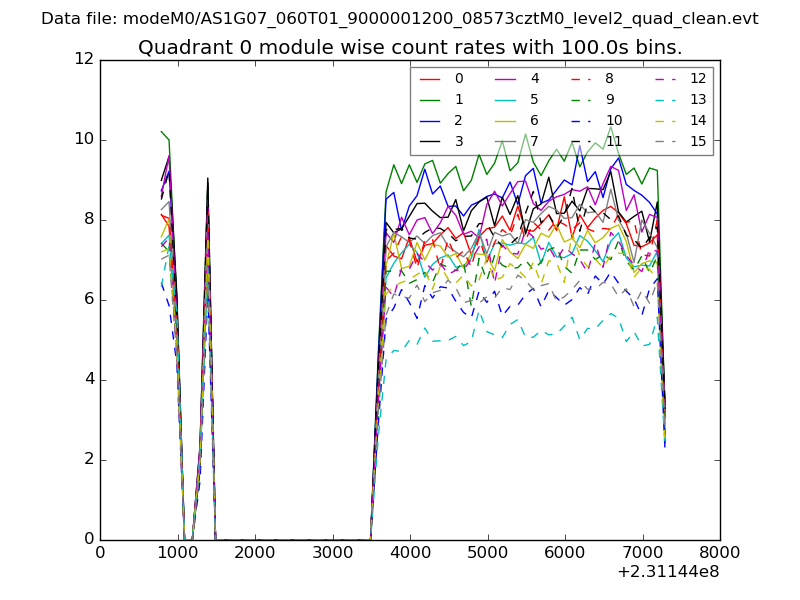 |
 |
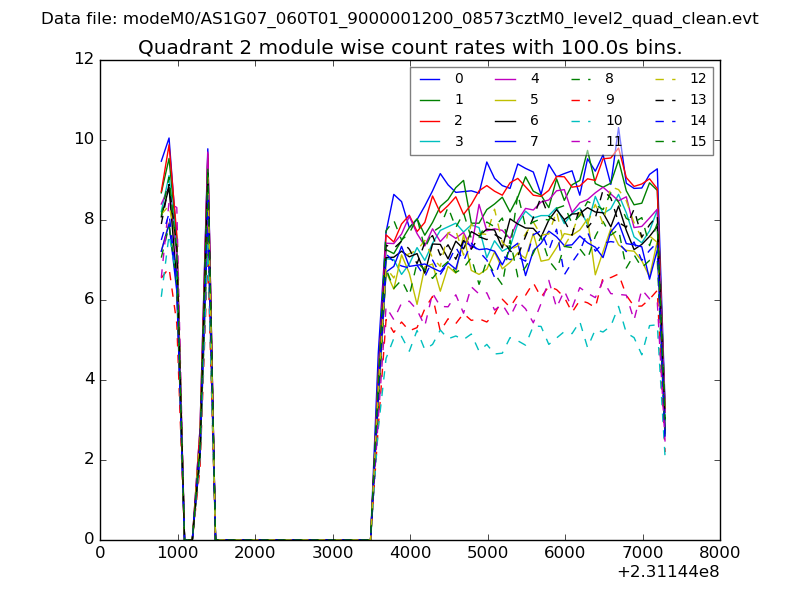
| Module-wise count rates for Quadrant B Data is divided into 100 sec bins |
 |
 |
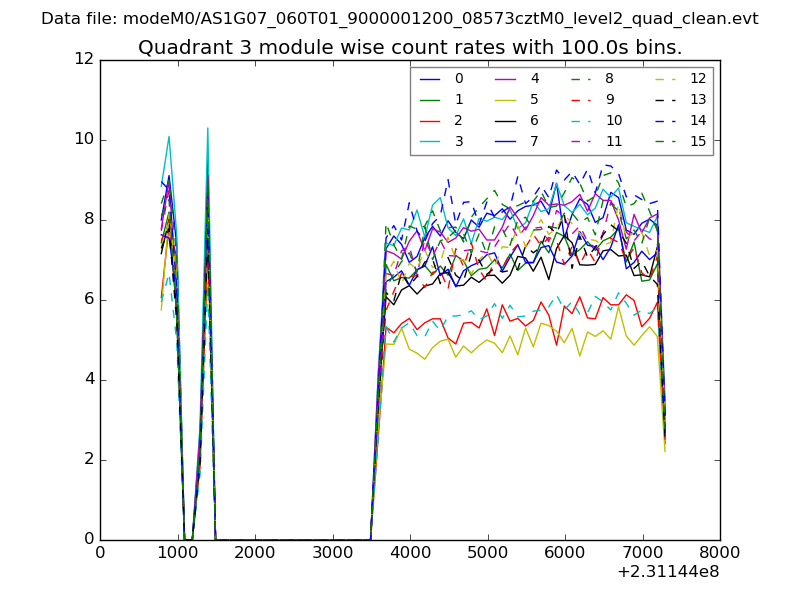
| Module-wise count rates for Quadrant C Data is divided into 100 sec bins |
 |
 |
| Module-wise count rates for Quadrant D Data is divided into 100 sec bins |
 |
 |
| Parameter | Plot |
|---|---|
| CZT HV Monitor | 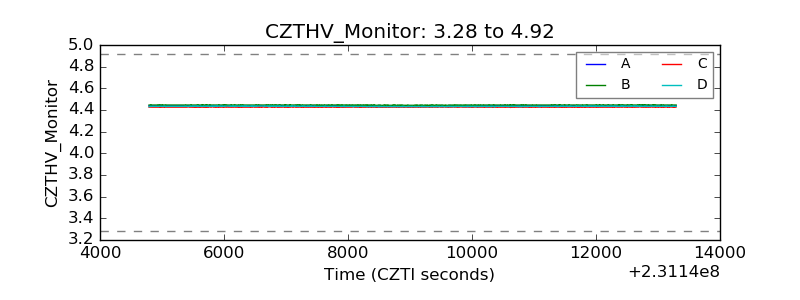 |
| D_VDD |  |
| Temperature 1 | 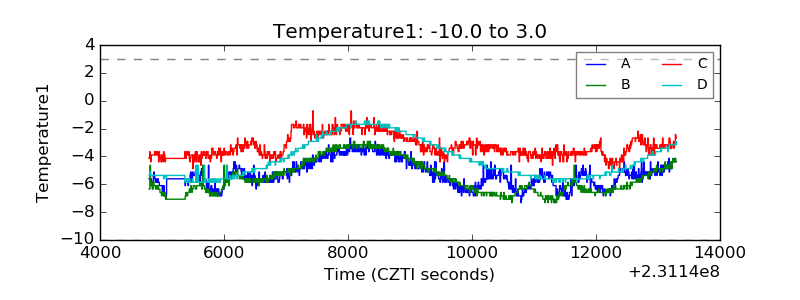 |
| Veto HV Monitor | 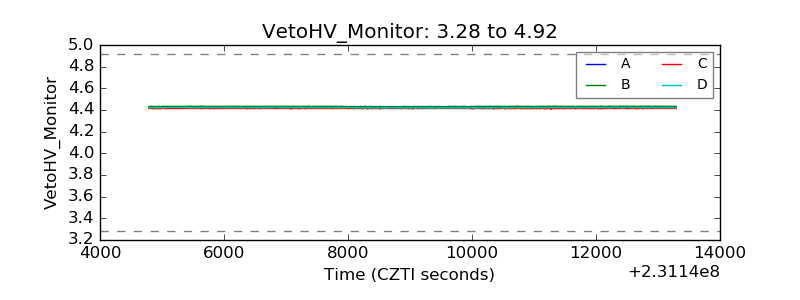 |
| Veto LLD | 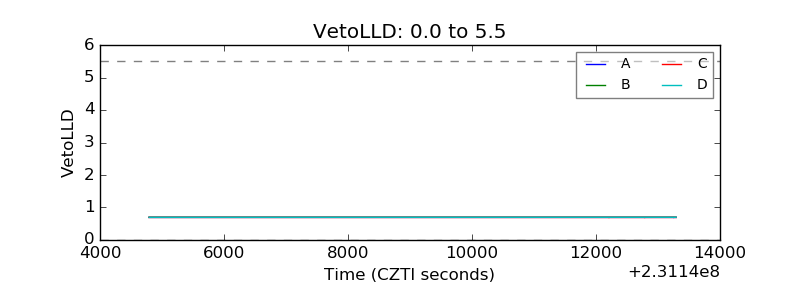 |
| Alpha Counter |  |
| _CPM_Rate | 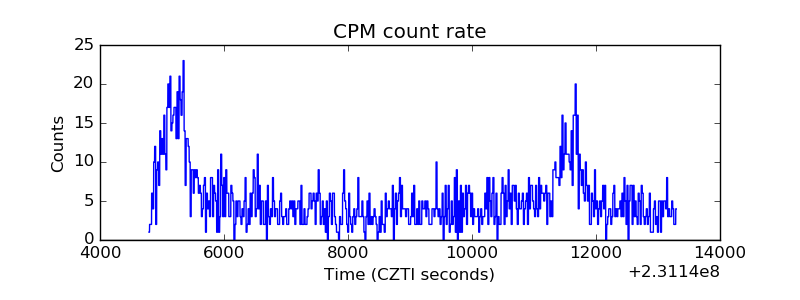 |
| CZT Counter | 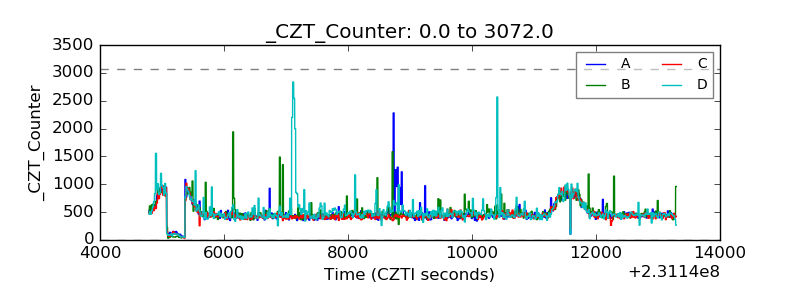 |
| +2.5 Volts monitor |  |
| +5 Volts monitor |  |
| _ROLL_ROT | 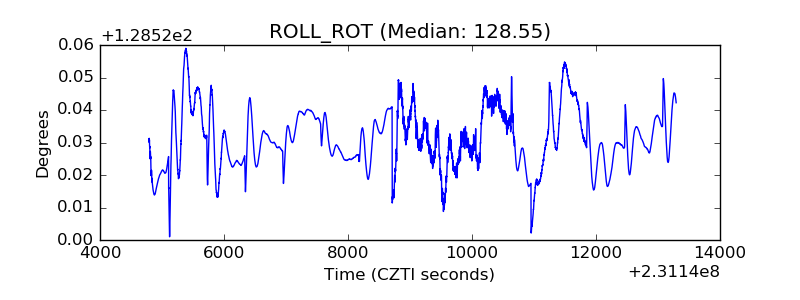 |
| _Roll_DEC | 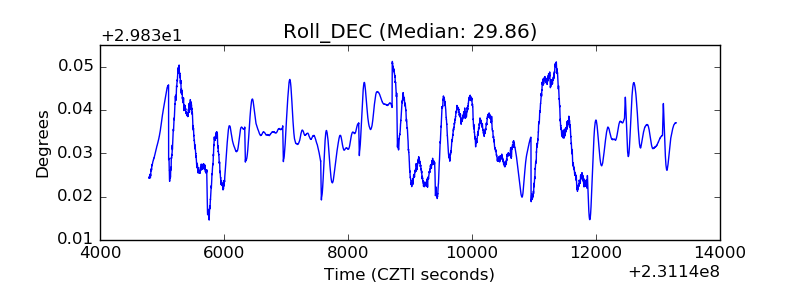 |
| _Roll_RA |  |
| Veto Counter |  |