| Param | Original file | Final file |
|---|---|---|
| Filename | modeM0/AS1G07_060T01_9000001200_08574cztM0_level2.evt | modeM0/AS1G07_060T01_9000001200_08574cztM0_level2_quad_clean.evt |
| Size (bytes) | 258,171,840 | 38,352,960 |
| Size | 246.2 MB | 36.6 MB |
| Events in quadrant A | 1,815,942 | 225,283 |
| Events in quadrant B | 1,948,221 | 224,452 |
| Events in quadrant C | 1,820,553 | 223,331 |
| Events in quadrant D | 1,971,951 | 218,141 |
| Mode SS | |||
|---|---|---|---|
| Quadrant | BADHDUFLAG | Total packets | Discarded packets |
| A | 0 | 88 | 10 |
| B | 0 | 88 | 14 |
| C | 0 | 88 | 16 |
| D | 0 | 88 | 12 |
| Mode M0 | |||
|---|---|---|---|
| Quadrant | BADHDUFLAG | Total packets | Discarded packets |
| A | 0 | 9209 | 1106 |
| B | 0 | 9643 | 1341 |
| C | 0 | 9191 | 1058 |
| D | 0 | 9378 | 1058 |
| Quadrant | Total seconds | Saturated seconds | Saturation percentage |
|---|---|---|---|
| A | 3819 | 276 | 7.227023% |
| B | 3767 | 293 | 7.778073% |
| C | 3837 | 197 | 5.134219% |
| D | 3856 | 205 | 5.316390% |
Noise dominated data is calculated using 1-second bins in cleaned event files. If a bin has >2000 counts, and if more than 50% of those come from <1% of pixels, then it is considered to be noise-dominated and hence unusable.
| Quadrant | # 1 sec bins | Bins with >0 counts | Bins with >2000 counts | High rate bins dominated by noise | Noise dominated (total time) | Noise dominated (detector-on time) | Marked lightcurve |
|---|---|---|---|---|---|---|---|
| A | 4371 | 4127 | 0 | 0 | 0.00% | 0.00% | 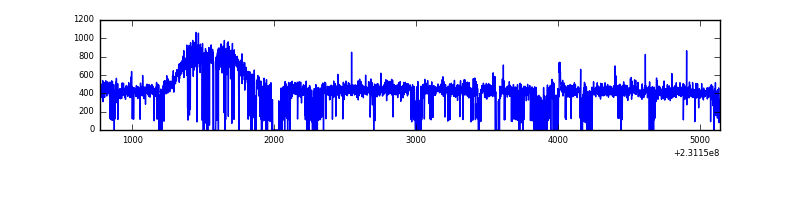 |
| B | 4371 | 4049 | 11 | 11 | 0.25% | 0.27% | 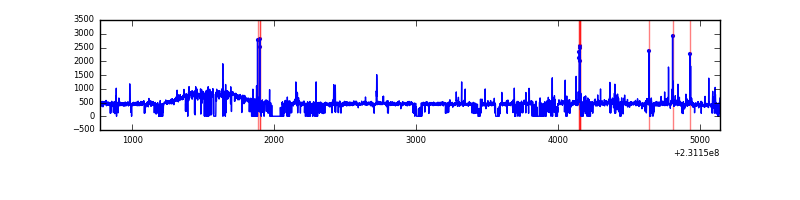 |
| C | 4371 | 4109 | 0 | 0 | 0.00% | 0.00% | 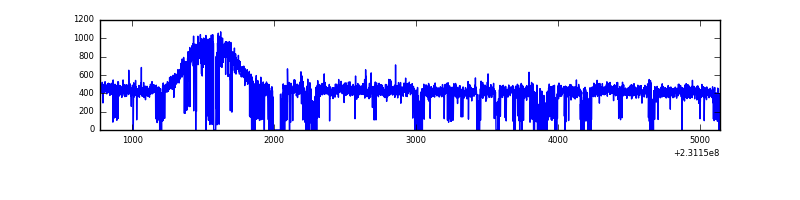 |
| D | 4371 | 4134 | 0 | 0 | 0.00% | 0.00% | 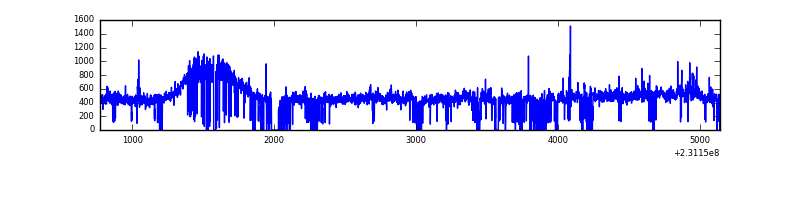 |
Top three noisy pixels from each quadrant. If the there are fewer than three noisy pixels in the level2.evt file, extra rows are filled as -1
| Pixel properties | Quadrant properties | ||||||
|---|---|---|---|---|---|---|---|
| Quadrant | DetID | PixID | Counts | Sigma | Mean | Median | Sigma |
| A | 0 | 226 | 4382 | 39.74 | 470 | 456 | 98.8 |
| A | 15 | 174 | 4171 | 37.6 | 470 | 456 | 98.8 |
| A | 12 | 194 | 4027 | 36.14 | 470 | 456 | 98.8 |
| B | 10 | 16 | 85824 | 918.2 | 460 | 448 | 93.0 |
| B | 0 | 214 | 54668 | 583.13 | 460 | 448 | 93.0 |
| B | 10 | 252 | 15983 | 167.08 | 460 | 448 | 93.0 |
| C | 8 | 128 | 8151 | 70.19 | 462 | 462 | 109.5 |
| C | 13 | 61 | 3639 | 29.0 | 462 | 462 | 109.5 |
| C | 8 | 112 | 3413 | 26.94 | 462 | 462 | 109.5 |
| D | 1 | 52 | 96808 | 834.94 | 459 | 444 | 115.4 |
| D | 8 | 195 | 90660 | 781.67 | 459 | 444 | 115.4 |
| D | 2 | 234 | 13777 | 115.52 | 459 | 444 | 115.4 |
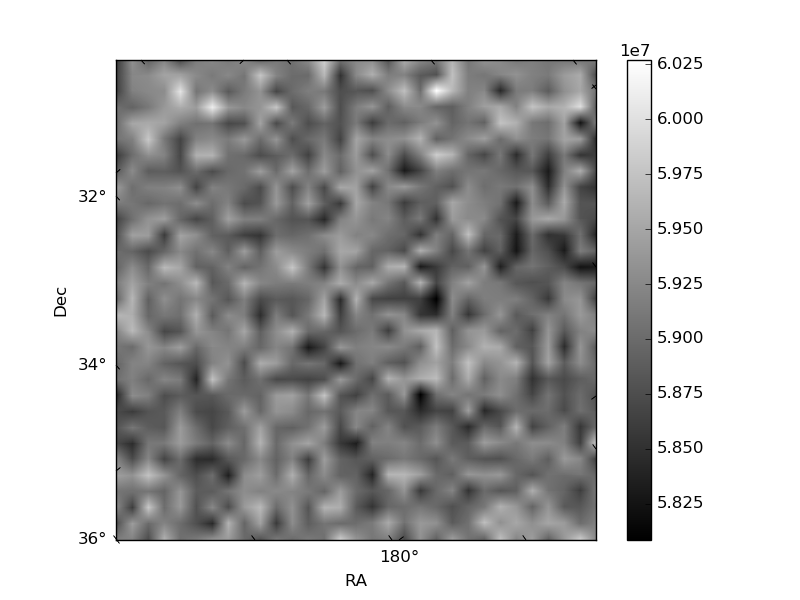
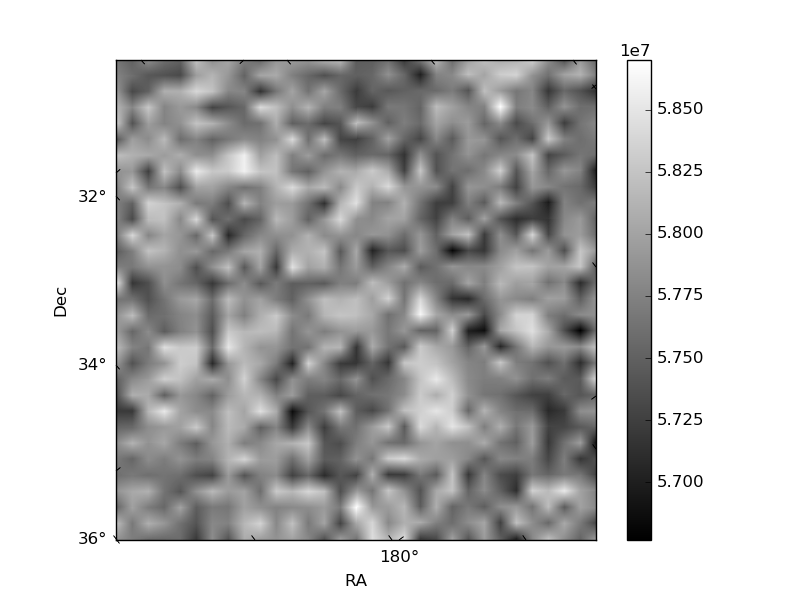
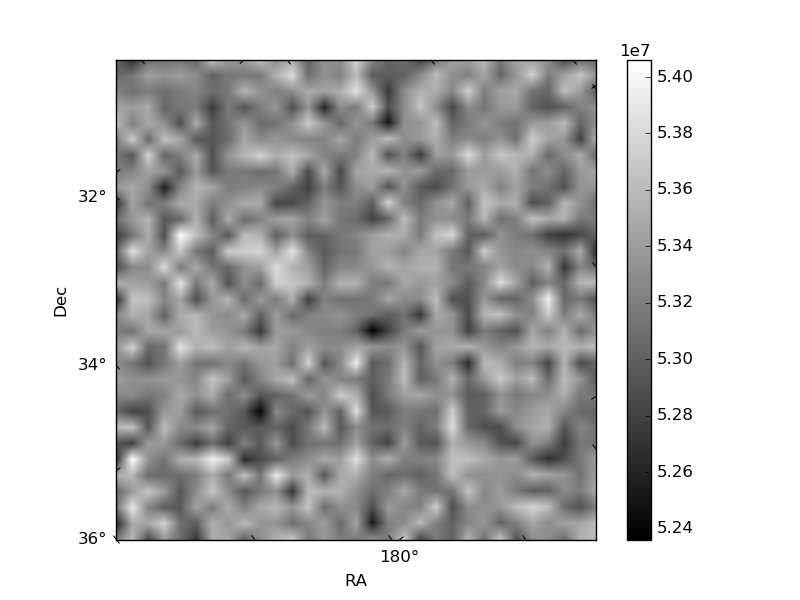
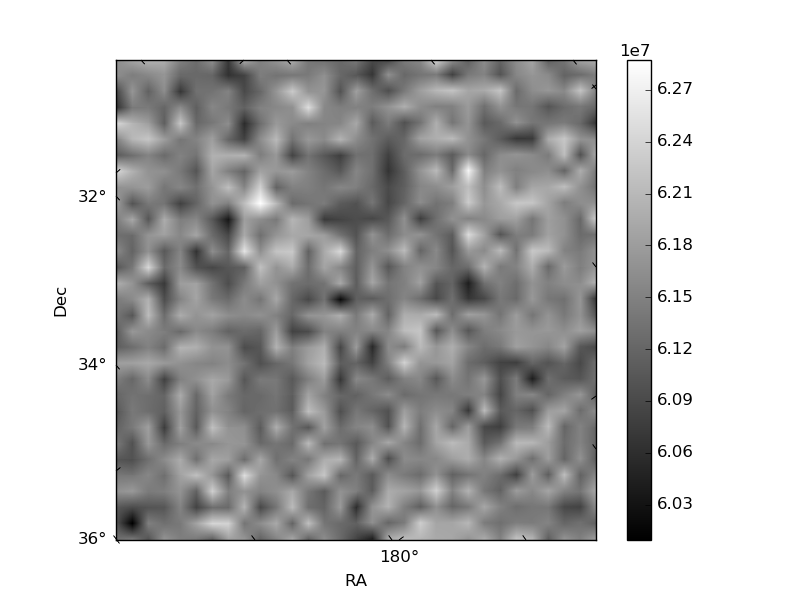
Histogram calculated using DETX and DETY for each event in the final _common_clean file
| Quadrant A | 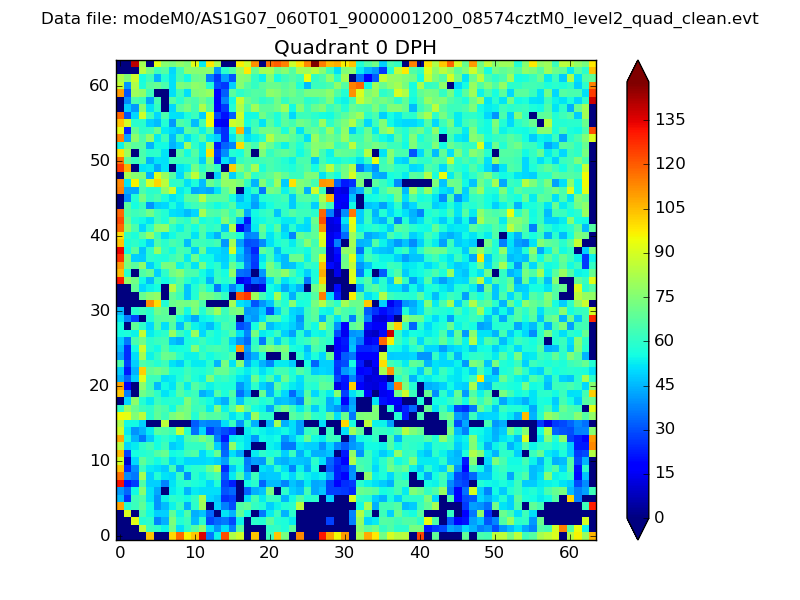 |
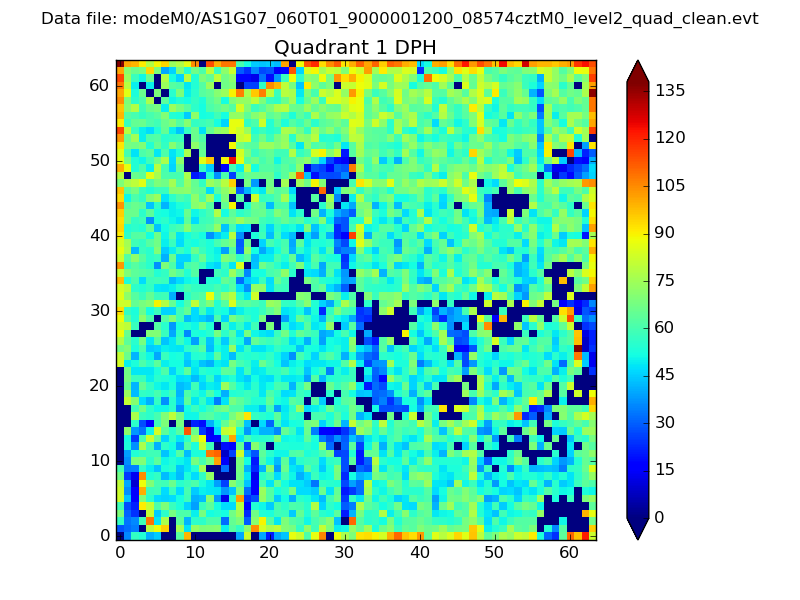 |
Quadrant B |
|---|---|---|---|
| Quadrant D | 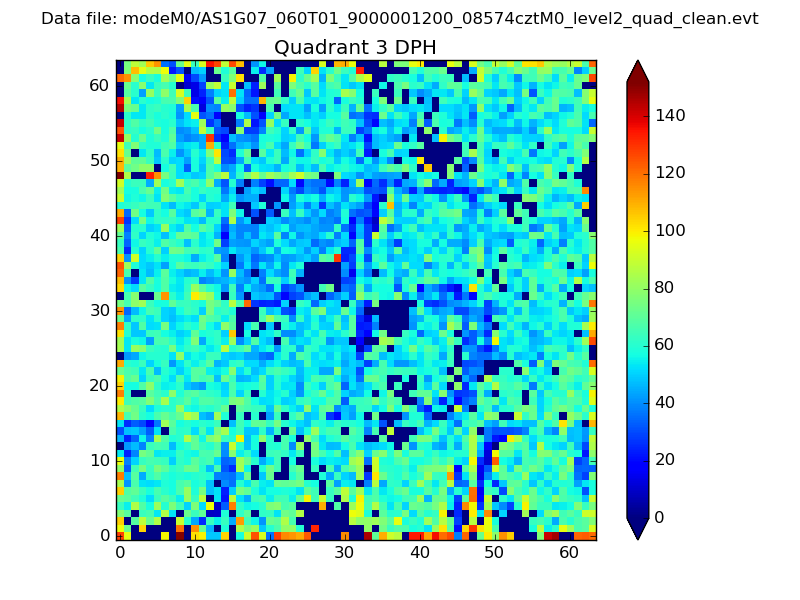 |
 |
Quadrant C |
| Plot type | Count rate plots | Images |
|---|---|---|
| Comparison with Poisson distribution Blue bars denote a histogram of data divided into 1 sec bins. Red curve is a Poisson curve with rate = median count rate of data. |
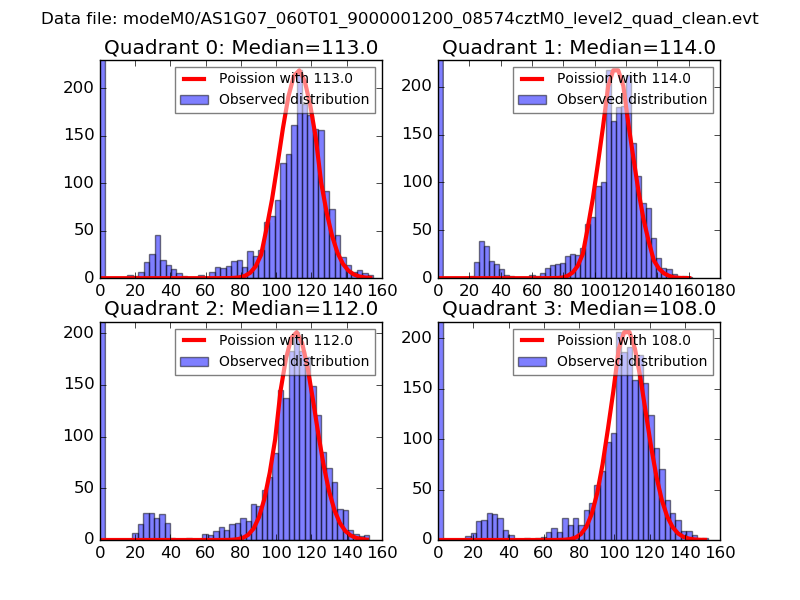 |
 |
| Quadrant-wise count rates Data is divided into 100 sec bins |
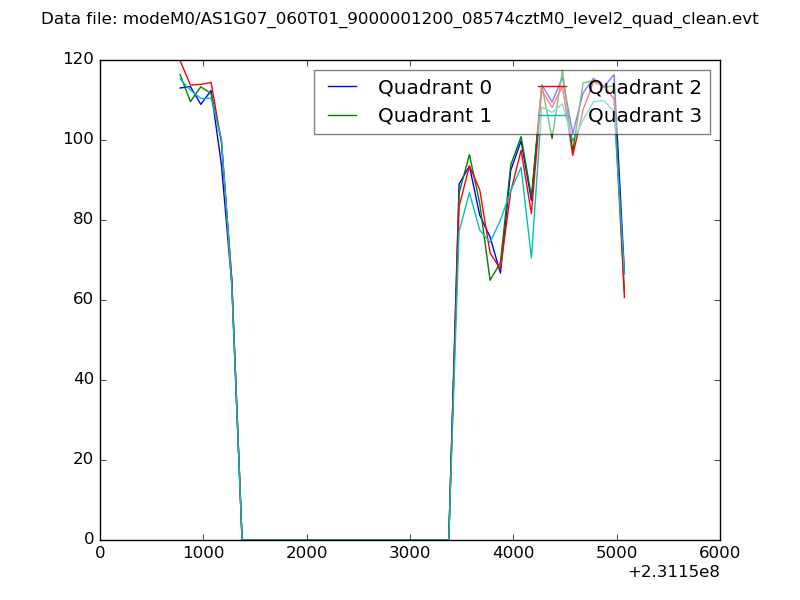 |
|
| Module-wise count rates for Quadrant A Data is divided into 100 sec bins |
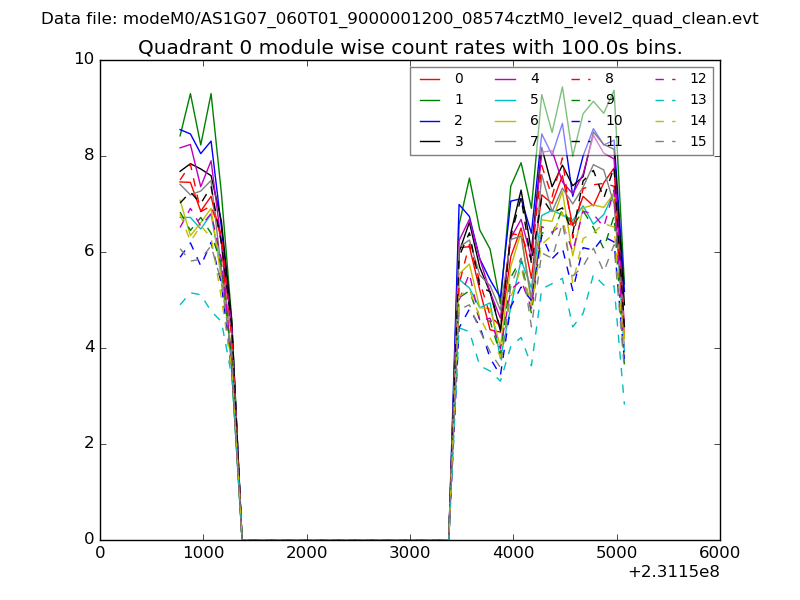 |
 |
| Module-wise count rates for Quadrant B Data is divided into 100 sec bins |
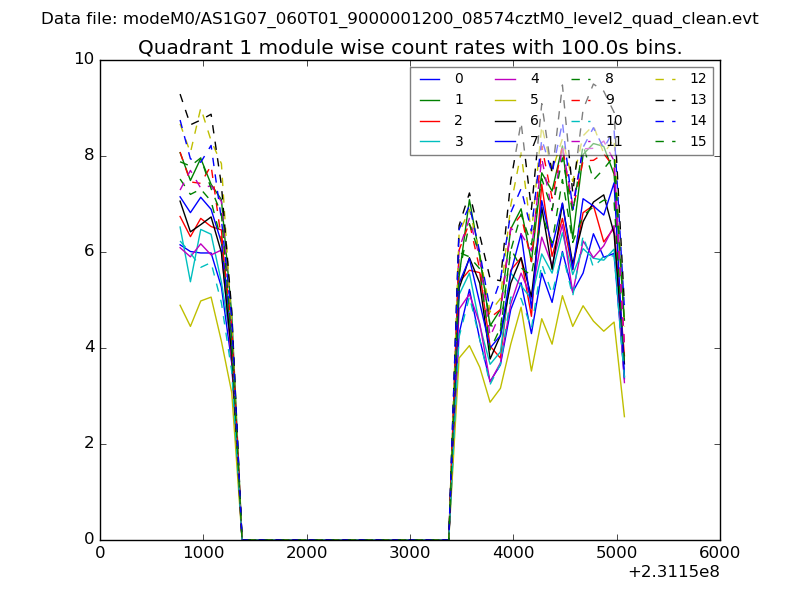 |
 |
| Module-wise count rates for Quadrant C Data is divided into 100 sec bins |
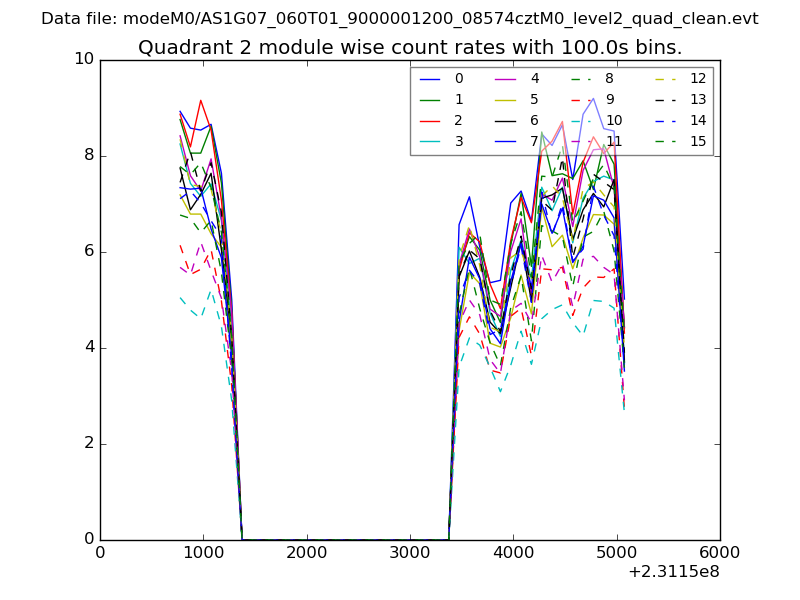 |
 |
| Module-wise count rates for Quadrant D Data is divided into 100 sec bins |
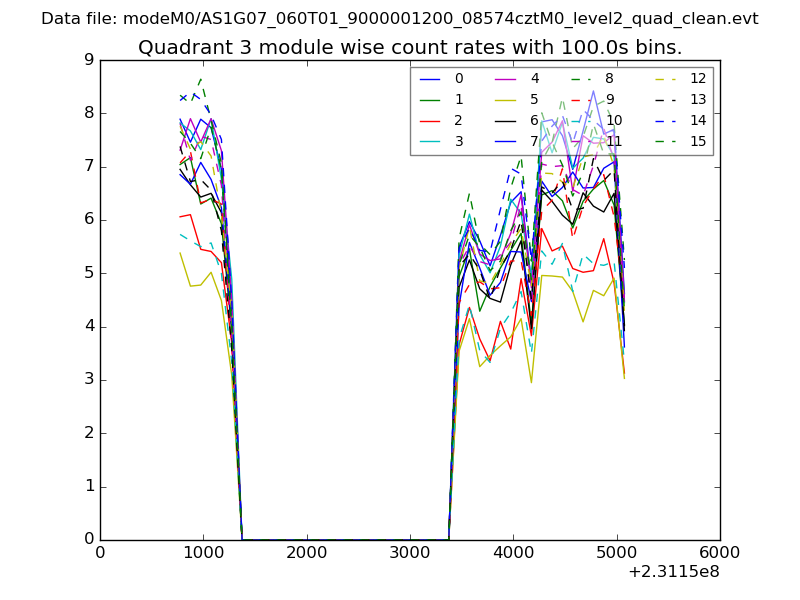 |
 |
| Parameter | Plot |
|---|---|
| CZT HV Monitor | 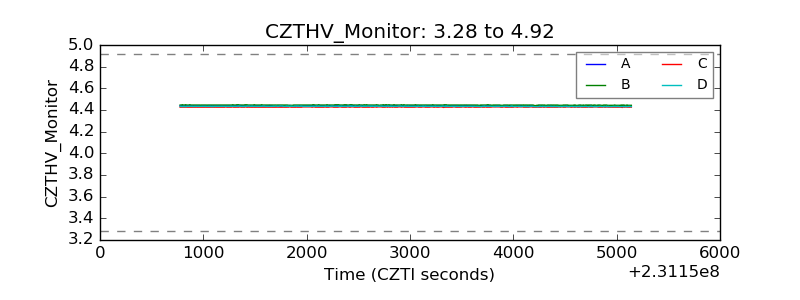 |
| D_VDD |  |
| Temperature 1 | 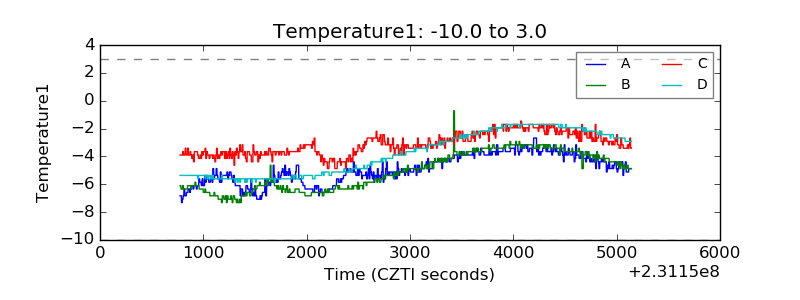 |
| Veto HV Monitor | 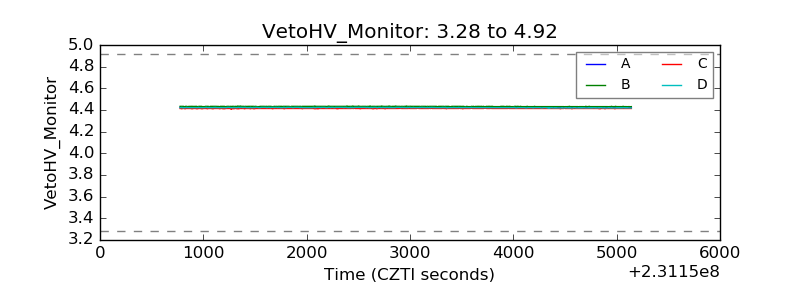 |
| Veto LLD | 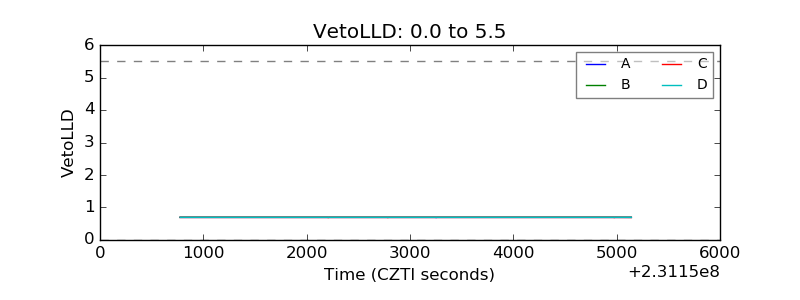 |
| Alpha Counter | 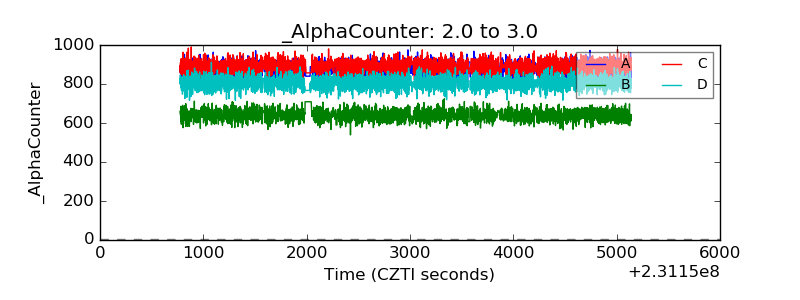 |
| _CPM_Rate | 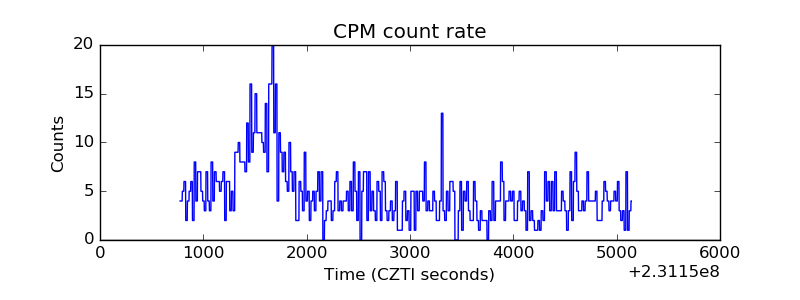 |
| CZT Counter |  |
| +2.5 Volts monitor |  |
| +5 Volts monitor |  |
| _ROLL_ROT | 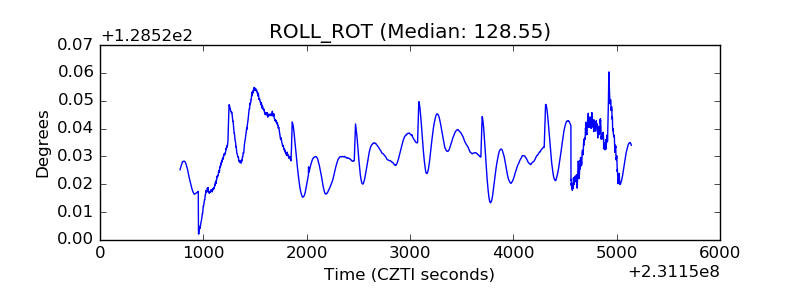 |
| _Roll_DEC | 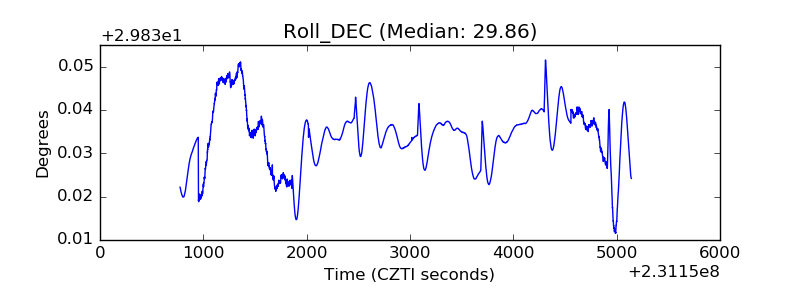 |
| _Roll_RA |  |
| Veto Counter | 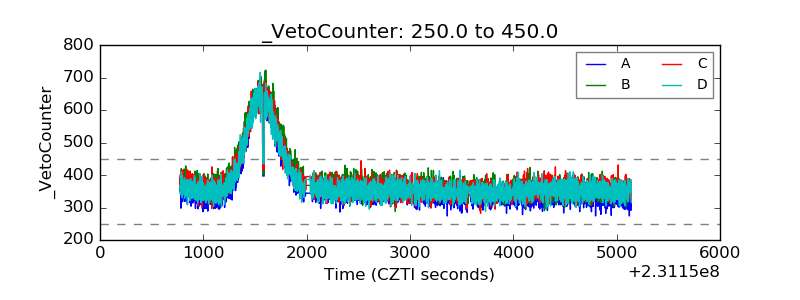 |