| Param | Original file | Final file |
|---|---|---|
| Filename | modeM0/AS1G07_060T01_9000001200_08580cztM0_level2.evt | modeM0/AS1G07_060T01_9000001200_08580cztM0_level2_quad_clean.evt |
| Size (bytes) | 198,495,360 | 32,060,160 |
| Size | 189.3 MB | 30.6 MB |
| Events in quadrant A | 1,377,282 | 189,963 |
| Events in quadrant B | 1,544,178 | 190,684 |
| Events in quadrant C | 1,356,261 | 185,149 |
| Events in quadrant D | 1,515,927 | 178,953 |
| Mode SS | |||
|---|---|---|---|
| Quadrant | BADHDUFLAG | Total packets | Discarded packets |
| A | 0 | 64 | 0 |
| B | 0 | 64 | 0 |
| C | 0 | 64 | 0 |
| D | 0 | 64 | 0 |
| Mode M0 | |||
|---|---|---|---|
| Quadrant | BADHDUFLAG | Total packets | Discarded packets |
| A | 0 | 6359 | 0 |
| B | 0 | 6680 | 0 |
| C | 0 | 6348 | 0 |
| D | 0 | 6500 | 0 |
| Quadrant | Total seconds | Saturated seconds | Saturation percentage |
|---|---|---|---|
| A | 3169 | 2 | 0.063111% |
| B | 3169 | 16 | 0.504891% |
| C | 3169 | 0 | 0.000000% |
| D | 3169 | 1 | 0.031556% |
Noise dominated data is calculated using 1-second bins in cleaned event files. If a bin has >2000 counts, and if more than 50% of those come from <1% of pixels, then it is considered to be noise-dominated and hence unusable.
| Quadrant | # 1 sec bins | Bins with >0 counts | Bins with >2000 counts | High rate bins dominated by noise | Noise dominated (total time) | Noise dominated (detector-on time) | Marked lightcurve |
|---|---|---|---|---|---|---|---|
| A | 3169 | 3169 | 0 | 0 | 0.00% | 0.00% |  |
| B | 3169 | 3169 | 13 | 13 | 0.41% | 0.41% |  |
| C | 3169 | 3169 | 0 | 0 | 0.00% | 0.00% | 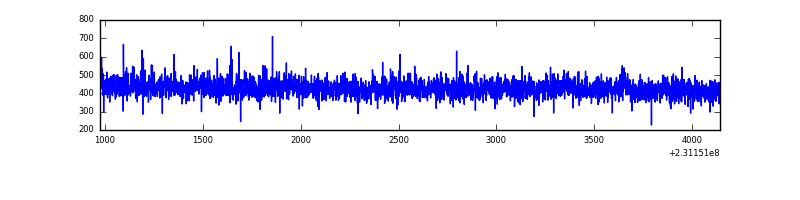 |
| D | 3169 | 3169 | 0 | 0 | 0.00% | 0.00% | 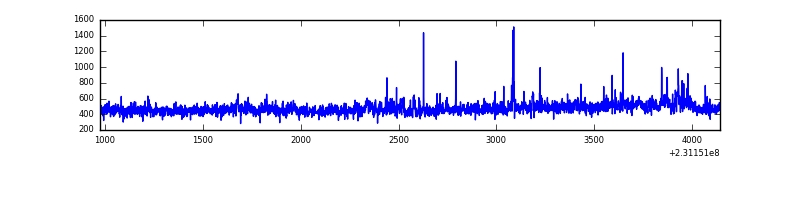 |
Top three noisy pixels from each quadrant. If the there are fewer than three noisy pixels in the level2.evt file, extra rows are filled as -1
| Pixel properties | Quadrant properties | ||||||
|---|---|---|---|---|---|---|---|
| Quadrant | DetID | PixID | Counts | Sigma | Mean | Median | Sigma |
| A | 15 | 174 | 3868 | 47.22 | 356 | 348 | 74.5 |
| A | 0 | 226 | 3295 | 39.54 | 356 | 348 | 74.5 |
| A | 12 | 194 | 3089 | 36.77 | 356 | 348 | 74.5 |
| B | 10 | 16 | 83472 | 1179.86 | 353 | 345 | 70.5 |
| B | 0 | 214 | 68081 | 961.41 | 353 | 345 | 70.5 |
| B | 10 | 252 | 16665 | 231.64 | 353 | 345 | 70.5 |
| C | 8 | 128 | 8189 | 96.66 | 343 | 344 | 81.2 |
| C | 8 | 112 | 3415 | 37.84 | 343 | 344 | 81.2 |
| C | 8 | 144 | 3270 | 36.05 | 343 | 344 | 81.2 |
| D | 1 | 52 | 97250 | 1138.4 | 341 | 332 | 85.1 |
| D | 8 | 195 | 80602 | 942.85 | 341 | 332 | 85.1 |
| D | 11 | 129 | 13564 | 155.42 | 341 | 332 | 85.1 |
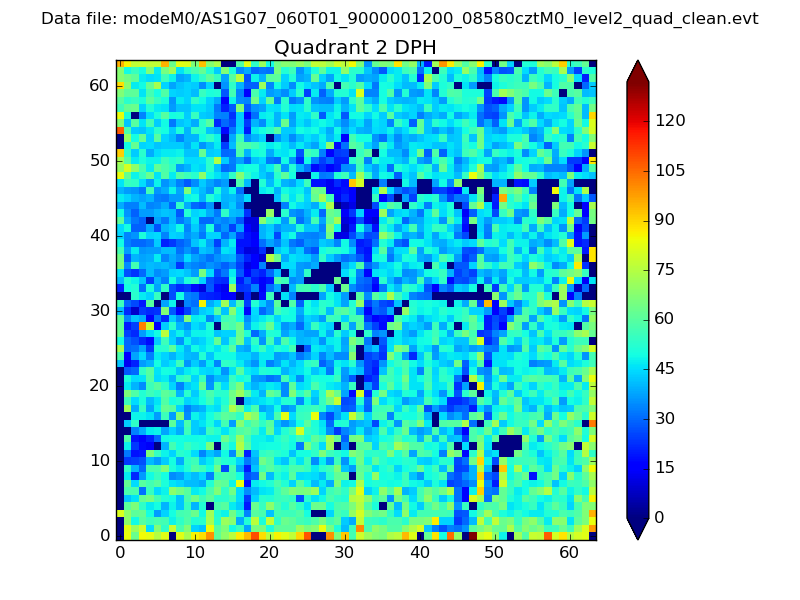
Histogram calculated using DETX and DETY for each event in the final _common_clean file
| Quadrant A | 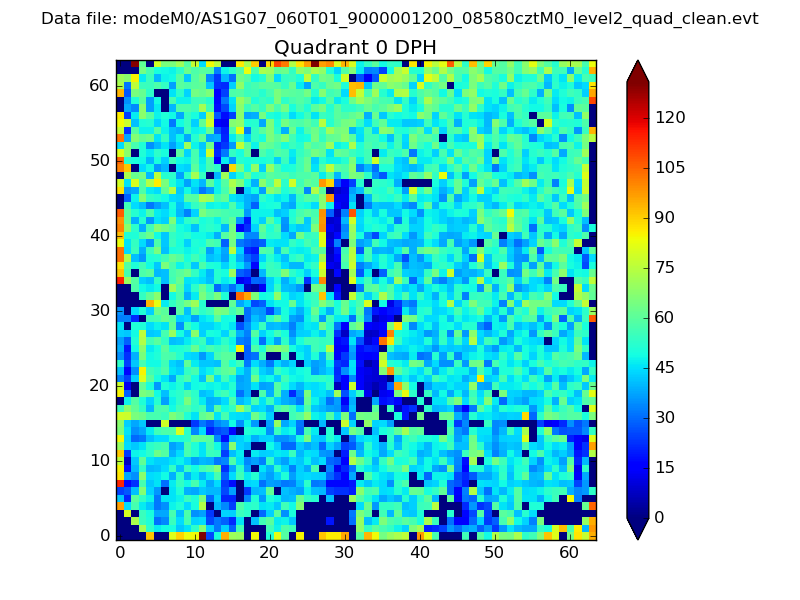 |
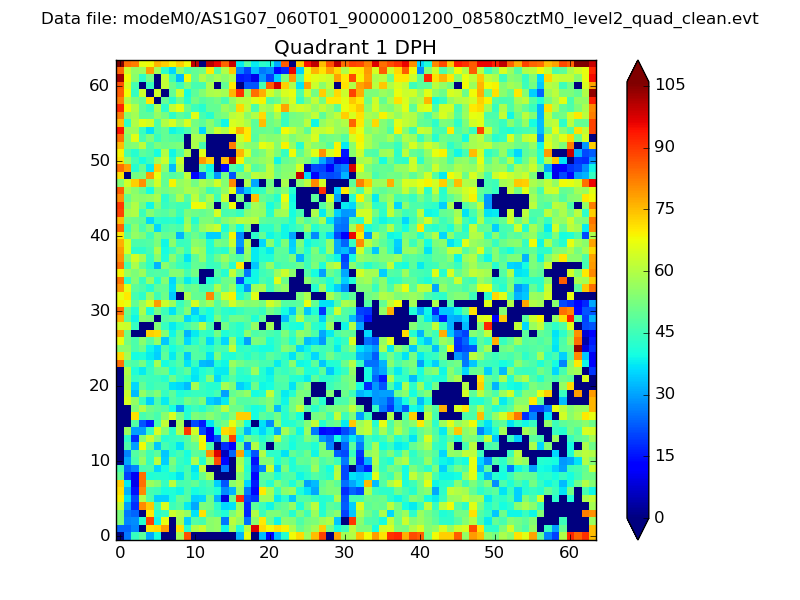 |
Quadrant B |
|---|---|---|---|
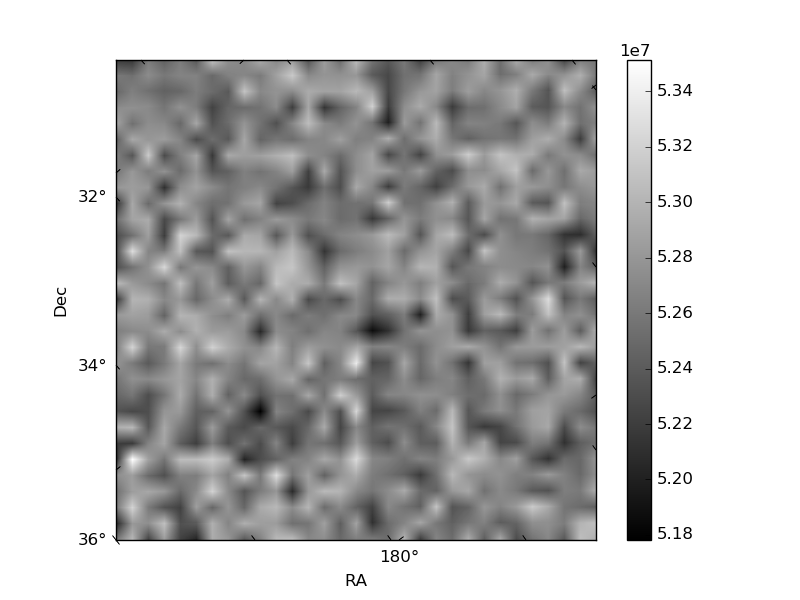
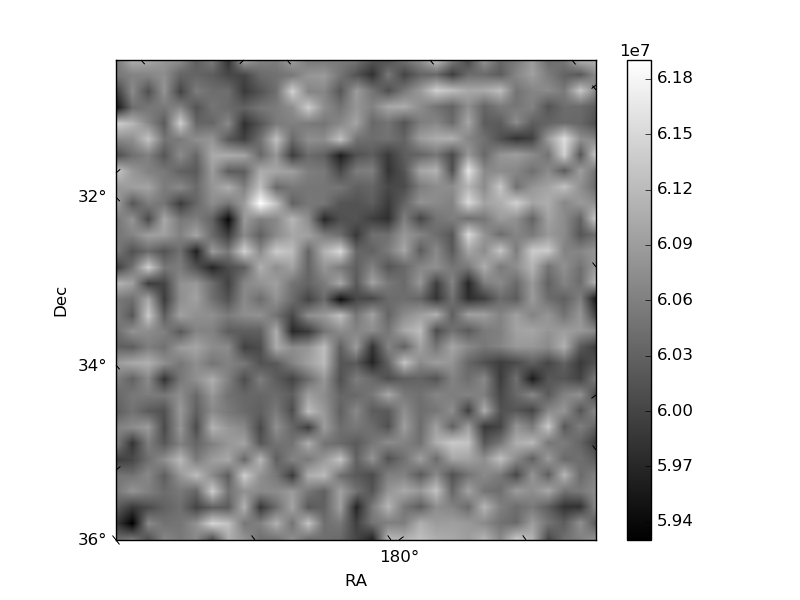
| Quadrant D | 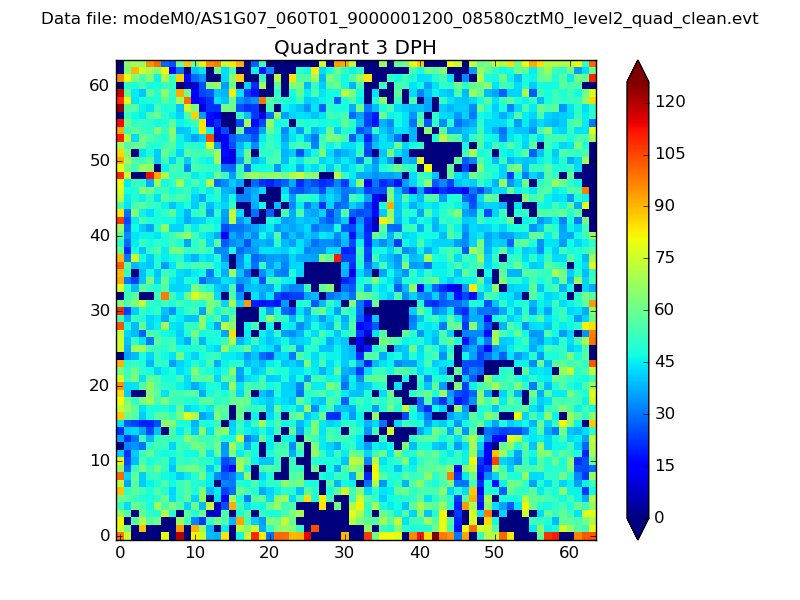 |
 |
Quadrant C |
| Plot type | Count rate plots | Images |
|---|---|---|
| Comparison with Poisson distribution Blue bars denote a histogram of data divided into 1 sec bins. Red curve is a Poisson curve with rate = median count rate of data. |
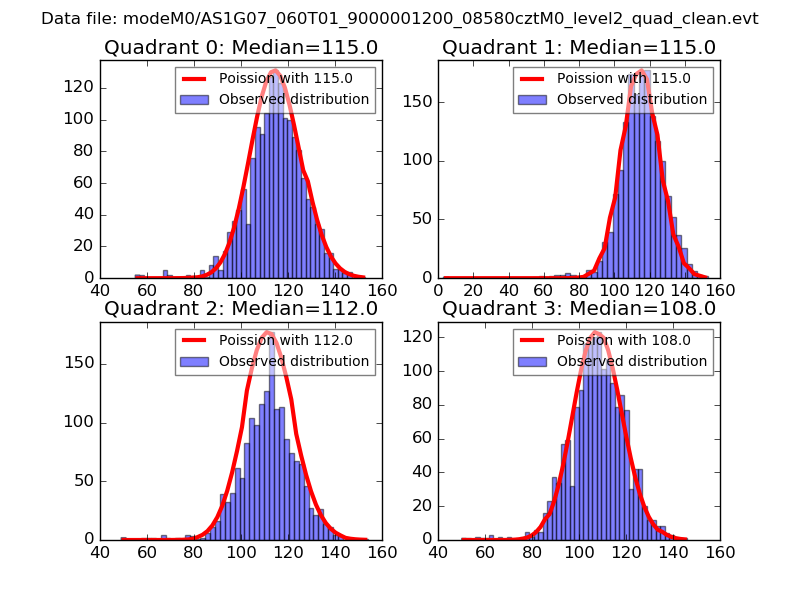 |
 |
| Quadrant-wise count rates Data is divided into 100 sec bins |
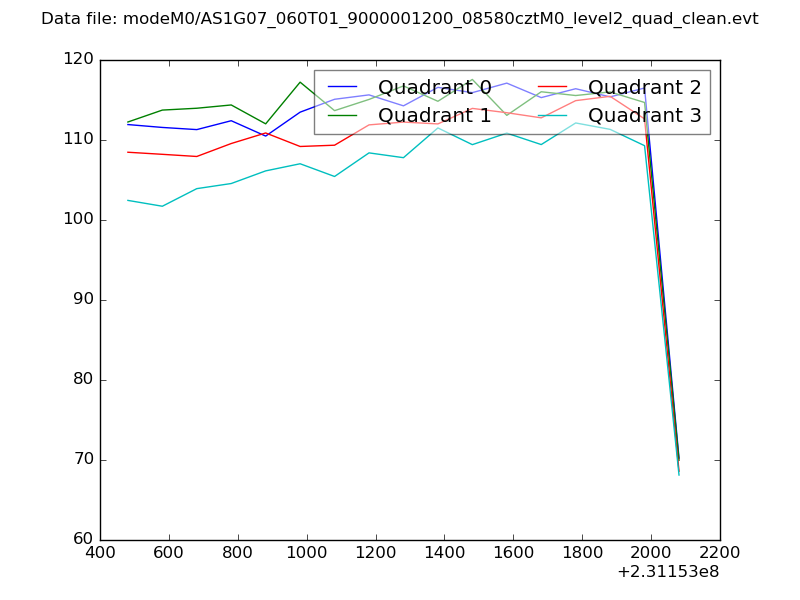 |
|
| Module-wise count rates for Quadrant A Data is divided into 100 sec bins |
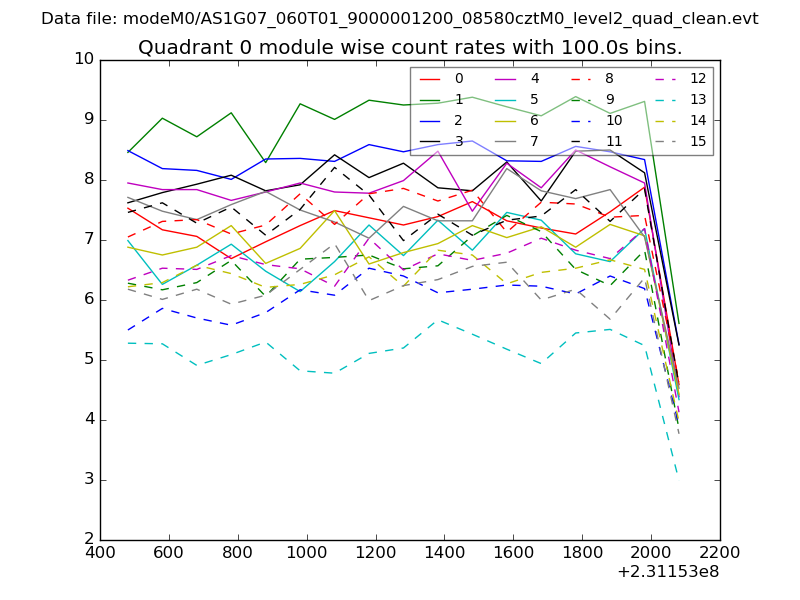 |
 |
| Module-wise count rates for Quadrant B Data is divided into 100 sec bins |
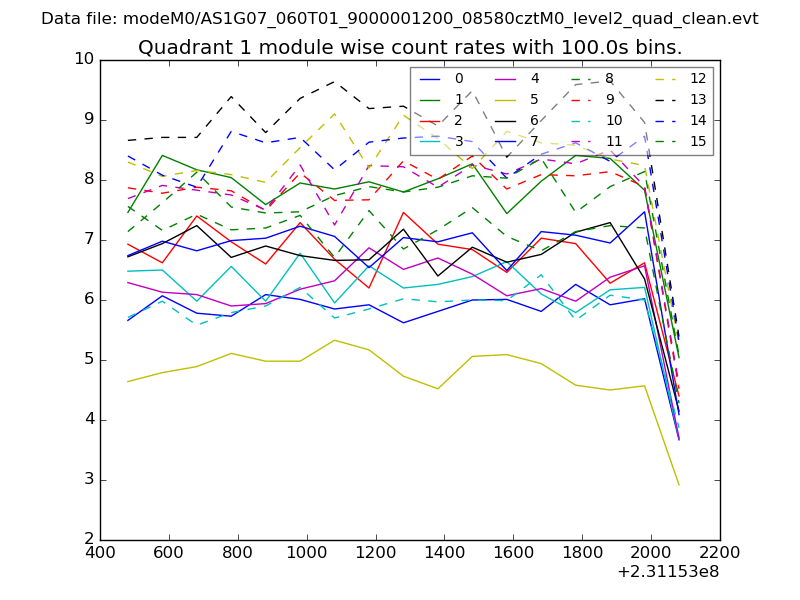 |
 |
| Module-wise count rates for Quadrant C Data is divided into 100 sec bins |
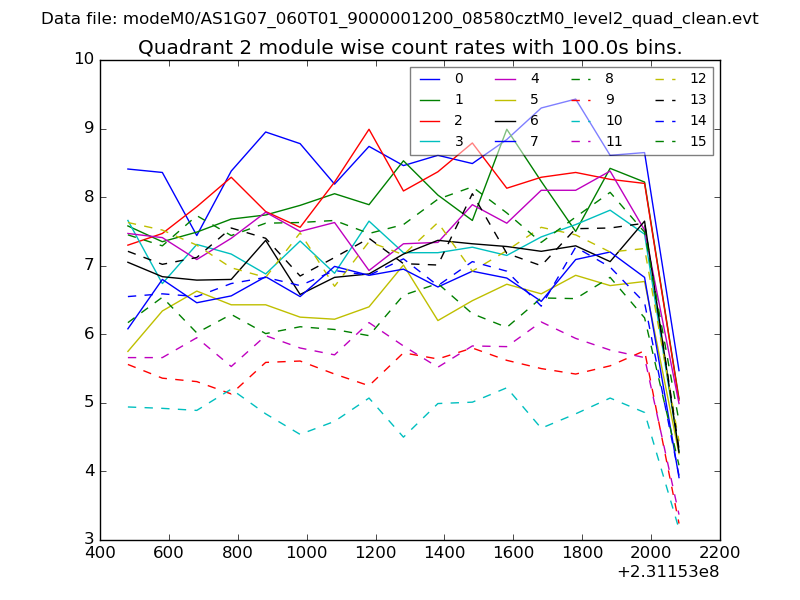 |
 |
| Module-wise count rates for Quadrant D Data is divided into 100 sec bins |
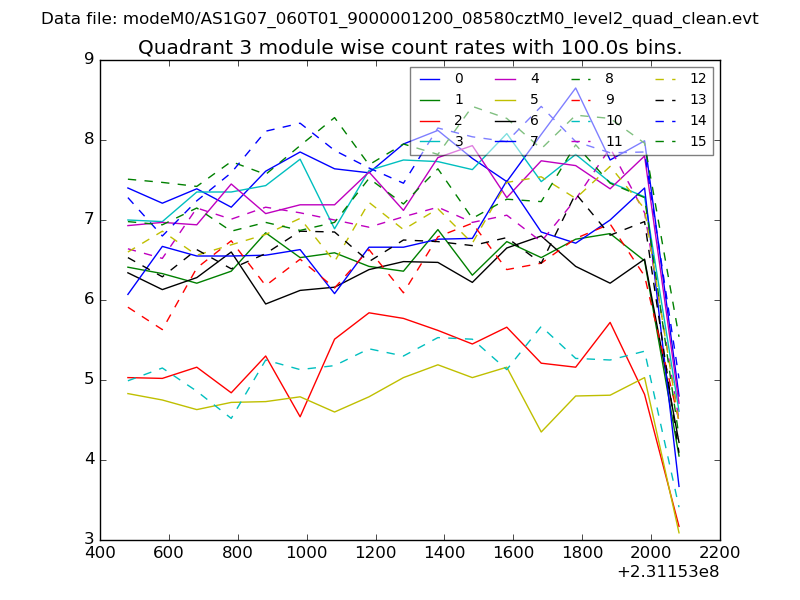 |
 |
| Parameter | Plot |
|---|---|
| CZT HV Monitor | 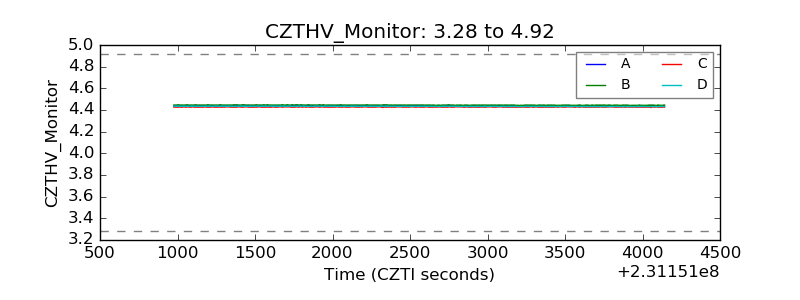 |
| D_VDD | 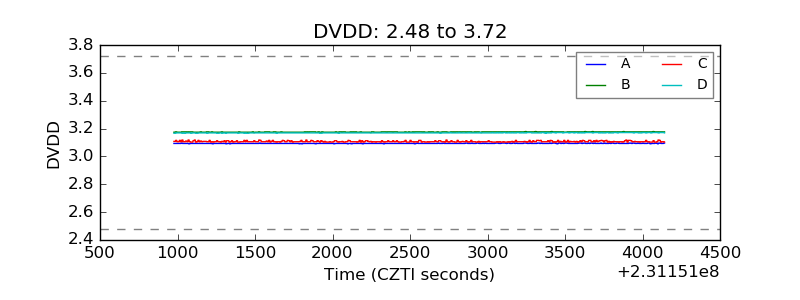 |
| Temperature 1 | 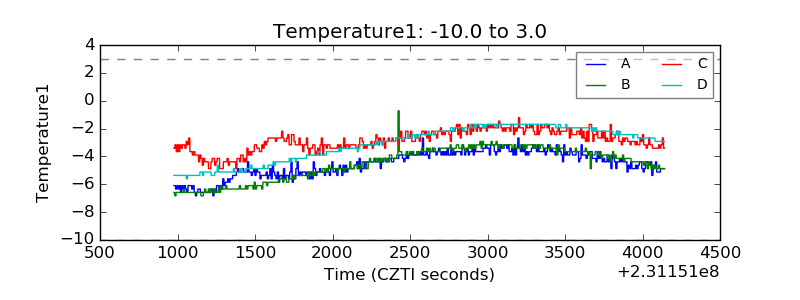 |
| Veto HV Monitor | 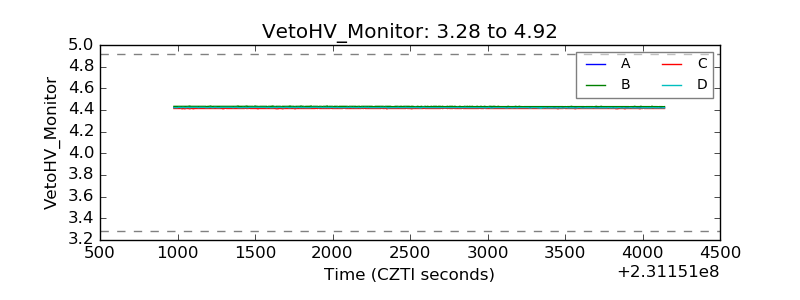 |
| Veto LLD | 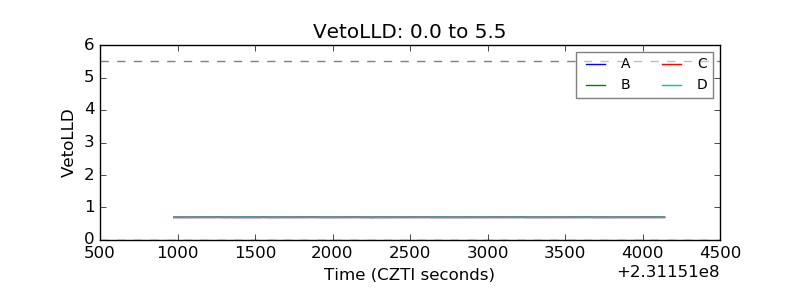 |
| Alpha Counter | 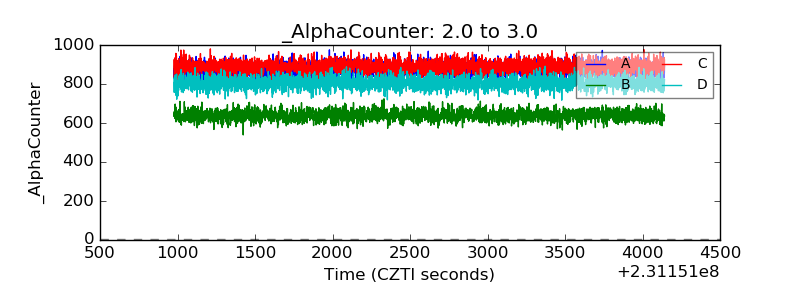 |
| _CPM_Rate | 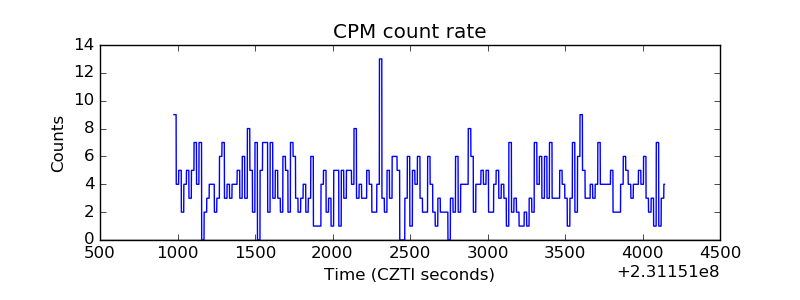 |
| CZT Counter | 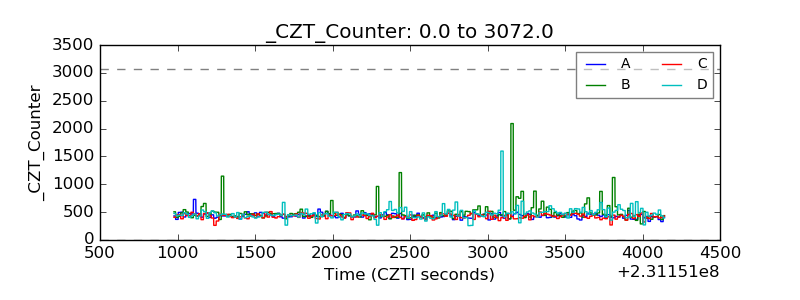 |
| +2.5 Volts monitor |  |
| +5 Volts monitor |  |
| _ROLL_ROT | 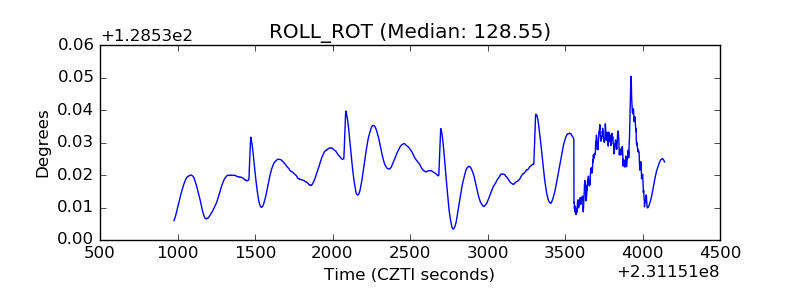 |
| _Roll_DEC | 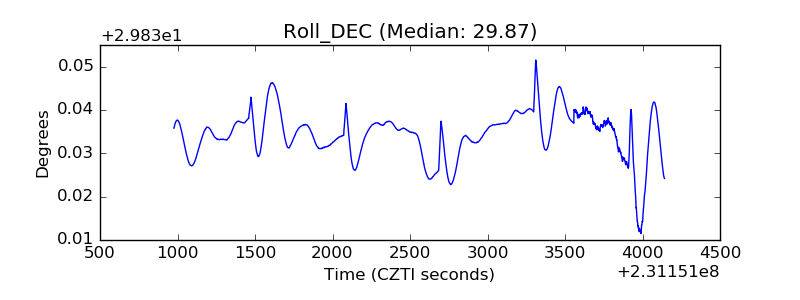 |
| _Roll_RA | 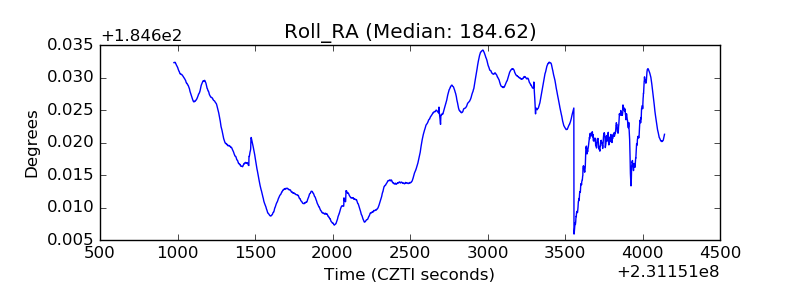 |
| Veto Counter | 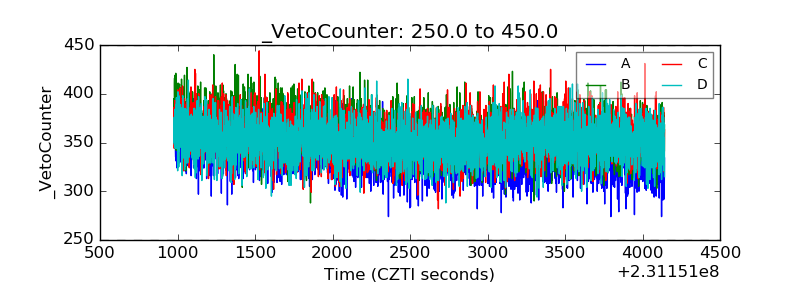 |