| Param | Original file | Final file |
|---|---|---|
| Filename | modeM0/AS1G07_060T01_9000001200_08729cztM0_level2.evt | modeM0/AS1G07_060T01_9000001200_08729cztM0_level2_quad_clean.evt |
| Size (bytes) | 190,359,360 | 38,903,040 |
| Size | 181.5 MB | 37.1 MB |
| Events in quadrant A | 1,433,987 | 241,126 |
| Events in quadrant B | 1,446,063 | 249,431 |
| Events in quadrant C | 1,351,996 | 246,272 |
| Events in quadrant D | 1,336,930 | 237,196 |
| Mode SS | |||
|---|---|---|---|
| Quadrant | BADHDUFLAG | Total packets | Discarded packets |
| A | 0 | 58 | 0 |
| B | 0 | 58 | 0 |
| C | 0 | 58 | 0 |
| D | 0 | 58 | 0 |
| Mode M0 | |||
|---|---|---|---|
| Quadrant | BADHDUFLAG | Total packets | Discarded packets |
| A | 0 | 6080 | 2 |
| B | 0 | 6148 | 1 |
| C | 0 | 5931 | 1 |
| D | 0 | 5936 | 1 |
| Mode M9 | |||
|---|---|---|---|
| Quadrant | BADHDUFLAG | Total packets | Discarded packets |
| A | 0 | 13 | 0 |
| B | 0 | 13 | 0 |
| C | 0 | 13 | 0 |
| D | 0 | 13 | 0 |
| Quadrant | Total seconds | Saturated seconds | Saturation percentage |
|---|---|---|---|
| A | 2855 | 17 | 0.595447% |
| B | 2855 | 32 | 1.120841% |
| C | 2855 | 15 | 0.525394% |
| D | 2855 | 12 | 0.420315% |
Noise dominated data is calculated using 1-second bins in cleaned event files. If a bin has >2000 counts, and if more than 50% of those come from <1% of pixels, then it is considered to be noise-dominated and hence unusable.
| Quadrant | # 1 sec bins | Bins with >0 counts | Bins with >2000 counts | High rate bins dominated by noise | Noise dominated (total time) | Noise dominated (detector-on time) | Marked lightcurve |
|---|---|---|---|---|---|---|---|
| A | 4075 | 2856 | 4 | 4 | 0.10% | 0.14% | 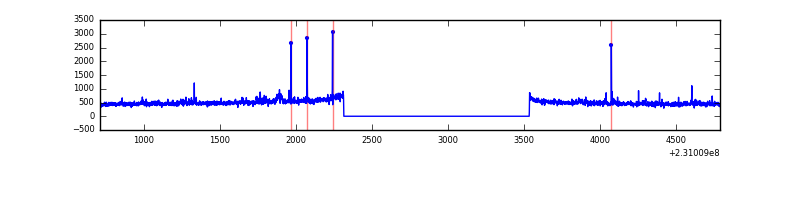 |
| B | 4075 | 2856 | 6 | 6 | 0.15% | 0.21% | 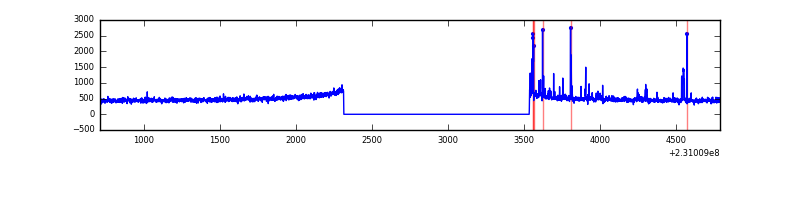 |
| C | 4075 | 2856 | 1 | 1 | 0.02% | 0.04% | 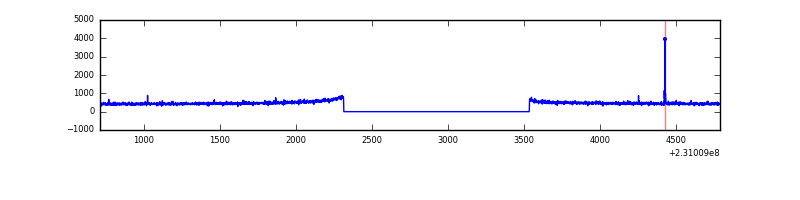 |
| D | 4075 | 2856 | 0 | 0 | 0.00% | 0.00% | 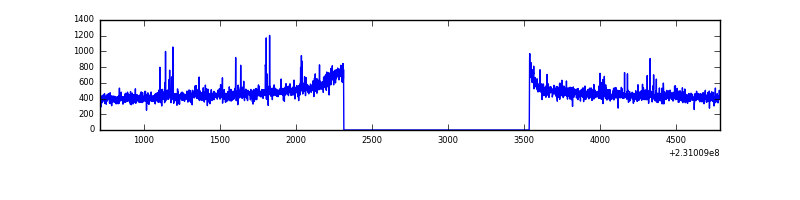 |
Top three noisy pixels from each quadrant. If the there are fewer than three noisy pixels in the level2.evt file, extra rows are filled as -1
| Pixel properties | Quadrant properties | ||||||
|---|---|---|---|---|---|---|---|
| Quadrant | DetID | PixID | Counts | Sigma | Mean | Median | Sigma |
| A | 13 | 251 | 55386 | 758.63 | 347 | 339 | 72.6 |
| A | 15 | 236 | 15630 | 210.73 | 347 | 339 | 72.6 |
| A | 15 | 174 | 14514 | 195.35 | 347 | 339 | 72.6 |
| B | 5 | 255 | 46056 | 682.2 | 351 | 342 | 67.0 |
| B | 4 | 48 | 11570 | 167.56 | 351 | 342 | 67.0 |
| B | 12 | 111 | 6903 | 97.91 | 351 | 342 | 67.0 |
| C | 14 | 234 | 8674 | 104.09 | 342 | 343 | 80.0 |
| C | 14 | 67 | 3326 | 37.27 | 342 | 343 | 80.0 |
| C | 13 | 61 | 2757 | 30.16 | 342 | 343 | 80.0 |
| D | 11 | 129 | 11922 | 141.22 | 339 | 331 | 82.1 |
| D | 2 | 234 | 9807 | 115.45 | 339 | 331 | 82.1 |
| D | 2 | 152 | 8682 | 101.75 | 339 | 331 | 82.1 |
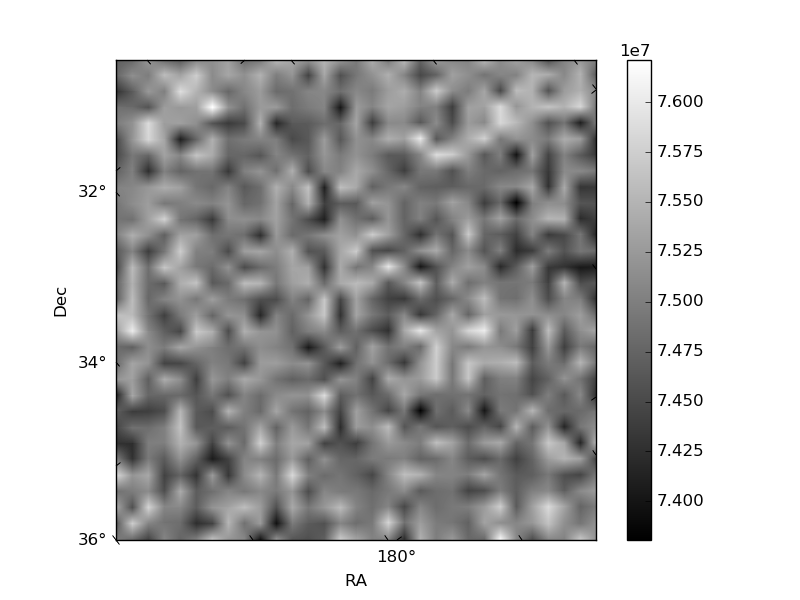
Histogram calculated using DETX and DETY for each event in the final _common_clean file
| Quadrant A |  |
 |
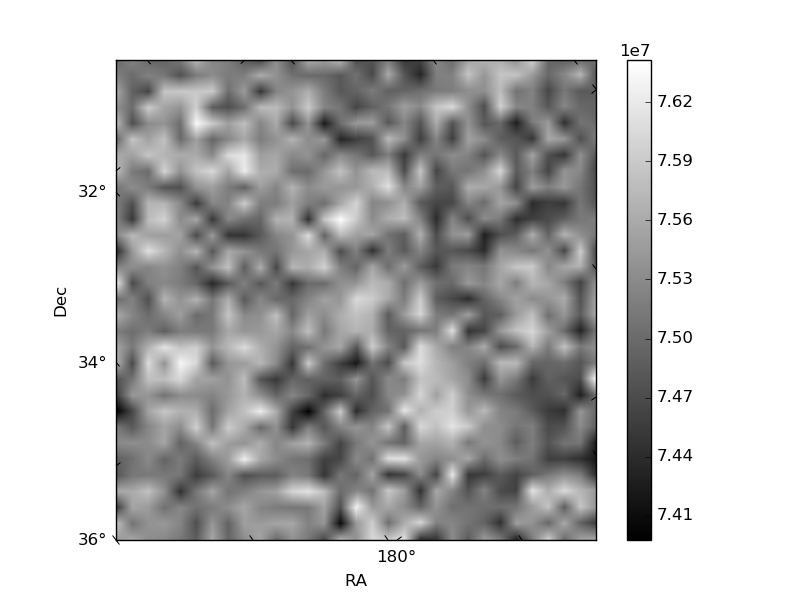
Quadrant B |
|---|---|---|---|
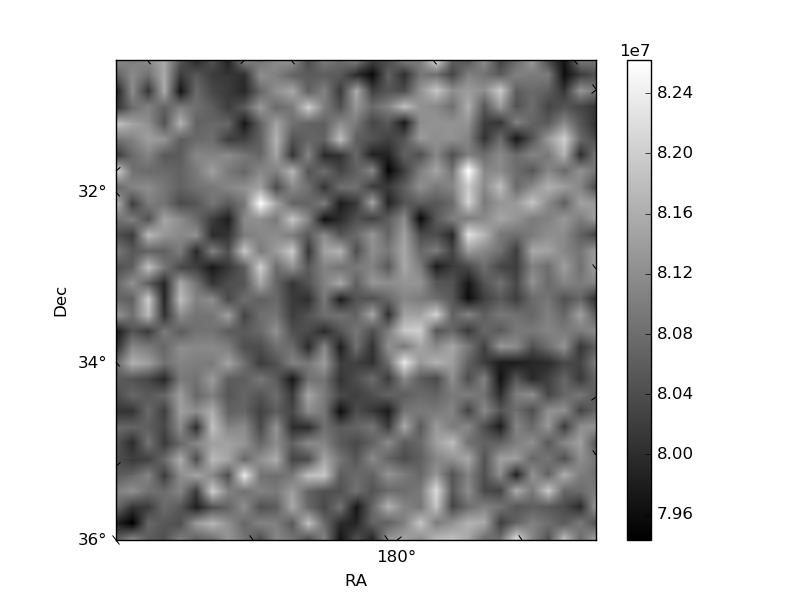
| Quadrant D |  |
 |
Quadrant C |
| Plot type | Count rate plots | Images |
|---|---|---|
| Comparison with Poisson distribution Blue bars denote a histogram of data divided into 1 sec bins. Red curve is a Poisson curve with rate = median count rate of data. |
 |
 |
| Quadrant-wise count rates Data is divided into 100 sec bins |
 |
|
| Module-wise count rates for Quadrant A Data is divided into 100 sec bins |
 |
 |
| Module-wise count rates for Quadrant B Data is divided into 100 sec bins |
 |
 |
| Module-wise count rates for Quadrant C Data is divided into 100 sec bins |
 |
 |
| Module-wise count rates for Quadrant D Data is divided into 100 sec bins |
 |
 |
| Parameter | Plot |
|---|---|
| CZT HV Monitor |  |
| D_VDD |  |
| Temperature 1 |  |
| Veto HV Monitor |  |
| Veto LLD |  |
| Alpha Counter |  |
| _CPM_Rate |  |
| CZT Counter |  |
| +2.5 Volts monitor |  |
| +5 Volts monitor |  |
| _ROLL_ROT |  |
| _Roll_DEC |  |
| _Roll_RA |  |
| Veto Counter |  |