| Param | Original file | Final file |
|---|---|---|
| Filename | modeM0/AS1A03_102T01_9000001202_08577cztM0_level2.evt | modeM0/AS1A03_102T01_9000001202_08577cztM0_level2_quad_clean.evt |
| Size (bytes) | 1,147,688,640 | 278,208,000 |
| Size | 1.1 GB | 265.3 MB |
| Events in quadrant A | 8,465,137 | 1,810,115 |
| Events in quadrant B | 8,770,076 | 1,851,856 |
| Events in quadrant C | 7,557,266 | 1,811,049 |
| Events in quadrant D | 8,781,815 | 1,748,247 |
| Mode M9 | |||
|---|---|---|---|
| Quadrant | BADHDUFLAG | Total packets | Discarded packets |
| A | 0 | 19 | 0 |
| B | 0 | 19 | 0 |
| C | 0 | 19 | 0 |
| D | 0 | 19 | 0 |
| Mode SS | |||
|---|---|---|---|
| Quadrant | BADHDUFLAG | Total packets | Discarded packets |
| A | 0 | 358 | 0 |
| B | 0 | 358 | 0 |
| C | 0 | 358 | 0 |
| D | 0 | 358 | 0 |
| Mode M0 | |||
|---|---|---|---|
| Quadrant | BADHDUFLAG | Total packets | Discarded packets |
| A | 0 | 37612 | 4 |
| B | 0 | 37637 | 3 |
| C | 0 | 35438 | 3 |
| D | 0 | 38468 | 3 |
| Quadrant | Total seconds | Saturated seconds | Saturation percentage |
|---|---|---|---|
| A | 17481 | 251 | 1.435845% |
| B | 17481 | 215 | 1.229907% |
| C | 17481 | 130 | 0.743665% |
| D | 17481 | 271 | 1.550255% |
Noise dominated data is calculated using 1-second bins in cleaned event files. If a bin has >2000 counts, and if more than 50% of those come from <1% of pixels, then it is considered to be noise-dominated and hence unusable.
| Quadrant | # 1 sec bins | Bins with >0 counts | Bins with >2000 counts | High rate bins dominated by noise | Noise dominated (total time) | Noise dominated (detector-on time) | Marked lightcurve |
|---|---|---|---|---|---|---|---|
| A | 19461 | 17482 | 62 | 62 | 0.32% | 0.35% |  |
| B | 19461 | 17481 | 29 | 29 | 0.15% | 0.17% |  |
| C | 19461 | 17481 | 0 | 0 | 0.00% | 0.00% |  |
| D | 19461 | 17481 | 112 | 112 | 0.58% | 0.64% | 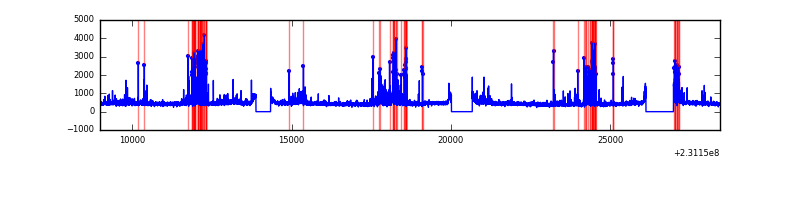 |
Top three noisy pixels from each quadrant. If the there are fewer than three noisy pixels in the level2.evt file, extra rows are filled as -1
| Pixel properties | Quadrant properties | ||||||
|---|---|---|---|---|---|---|---|
| Quadrant | DetID | PixID | Counts | Sigma | Mean | Median | Sigma |
| A | 15 | 223 | 281291 | 702.31 | 1975 | 1936 | 397.8 |
| A | 15 | 236 | 201574 | 501.9 | 1975 | 1936 | 397.8 |
| A | 15 | 239 | 129582 | 320.91 | 1975 | 1936 | 397.8 |
| B | 11 | 51 | 338816 | 889.58 | 1994 | 1944 | 378.7 |
| B | 0 | 214 | 271059 | 710.66 | 1994 | 1944 | 378.7 |
| B | 10 | 16 | 100267 | 259.64 | 1994 | 1944 | 378.7 |
| C | 13 | 61 | 14689 | 28.55 | 1935 | 1940 | 446.6 |
| C | 8 | 222 | 7955 | 13.47 | 1935 | 1940 | 446.6 |
| C | 9 | 68 | 5455 | 7.87 | 1935 | 1940 | 446.6 |
| D | 1 | 52 | 502818 | 1023.83 | 1917 | 1867 | 489.3 |
| D | 12 | 233 | 451357 | 918.66 | 1917 | 1867 | 489.3 |
| D | 7 | 71 | 149816 | 302.37 | 1917 | 1867 | 489.3 |
Histogram calculated using DETX and DETY for each event in the final _common_clean file
| Quadrant A | 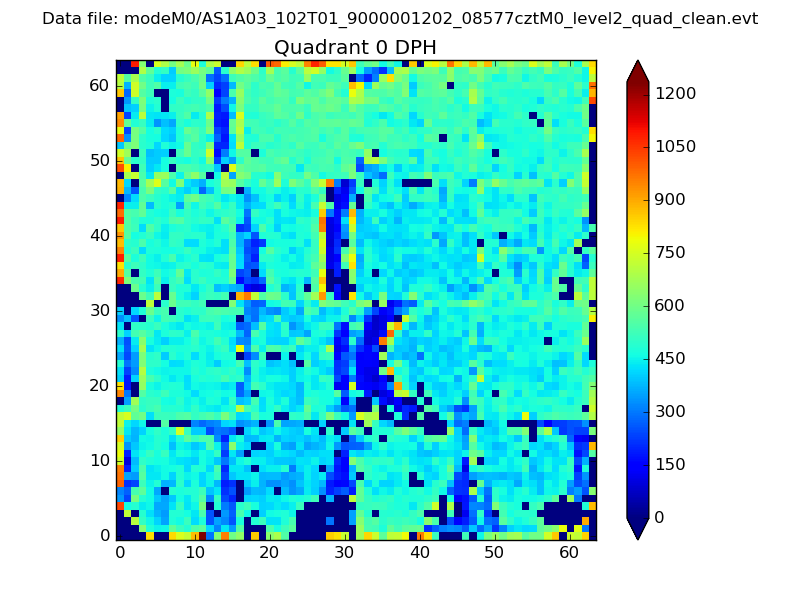 |
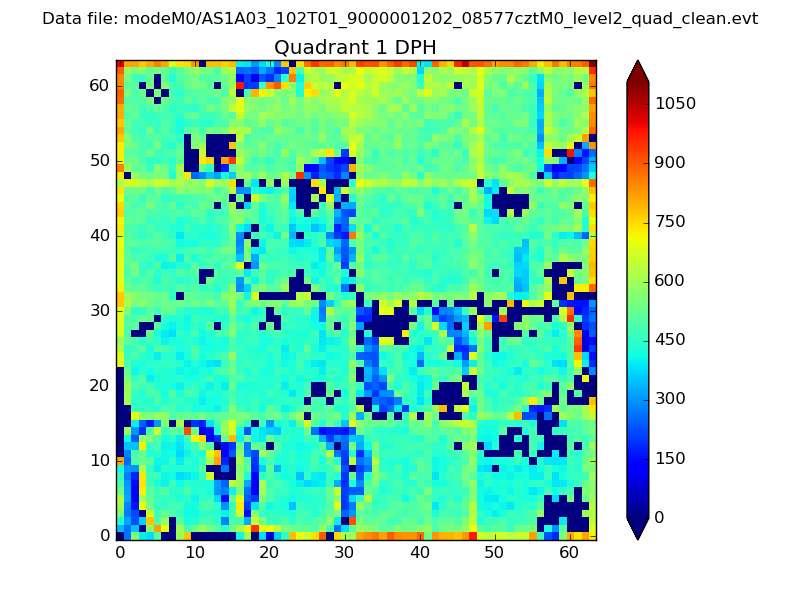 |
Quadrant B |
|---|---|---|---|
| Quadrant D | 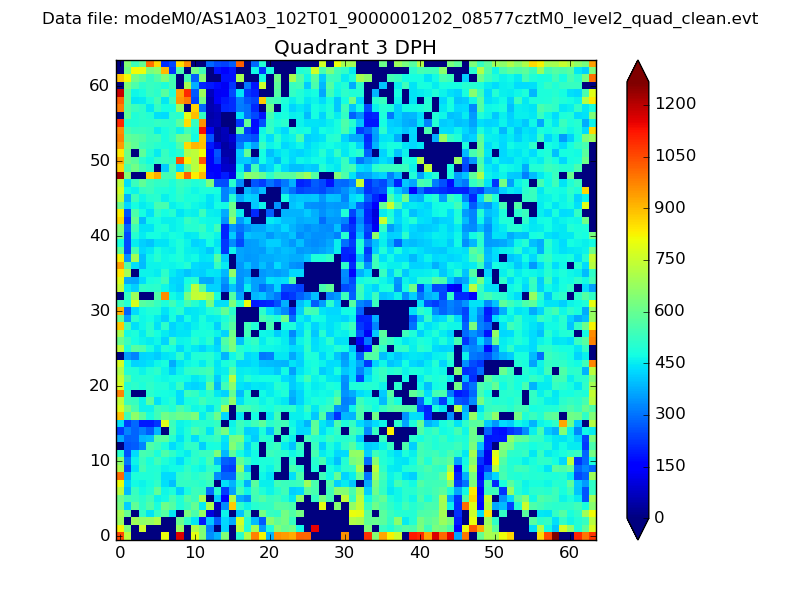 |
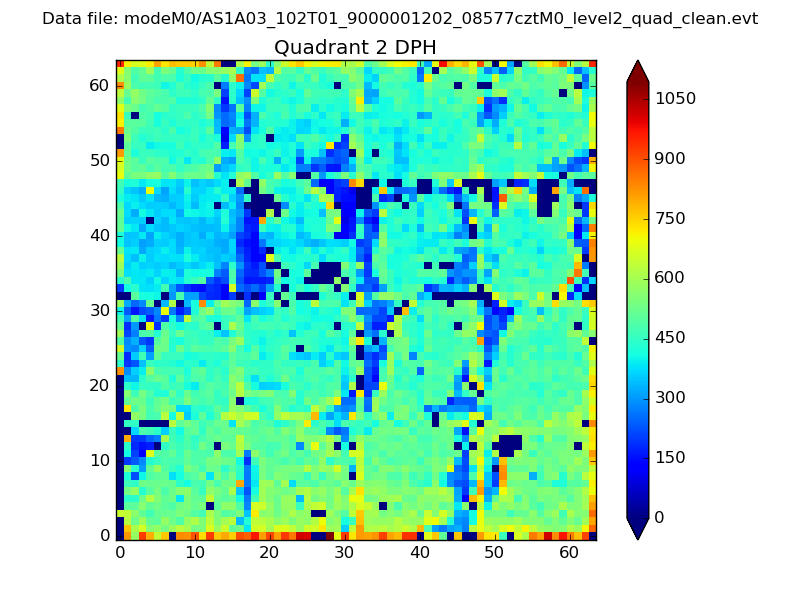 |
Quadrant C |
| Plot type | Count rate plots | Images |
|---|---|---|
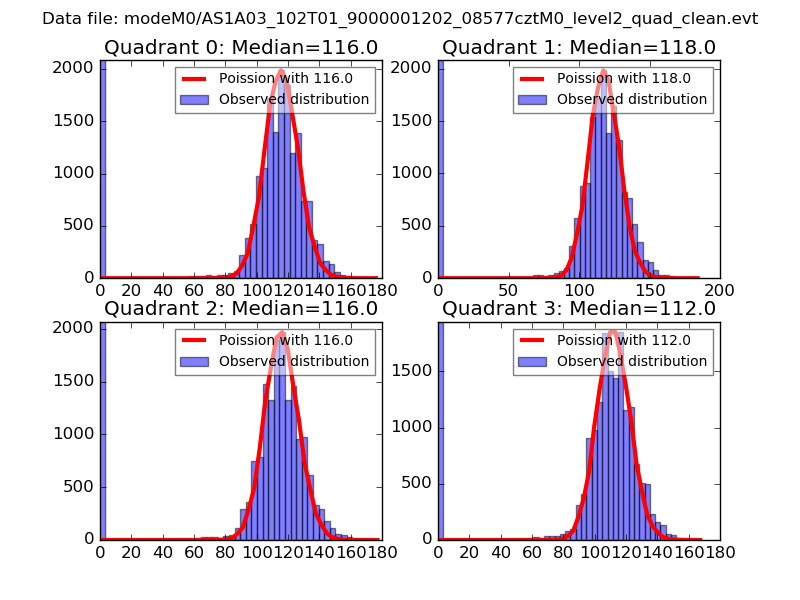
| Comparison with Poisson distribution Blue bars denote a histogram of data divided into 1 sec bins. Red curve is a Poisson curve with rate = median count rate of data. |
 |
 |
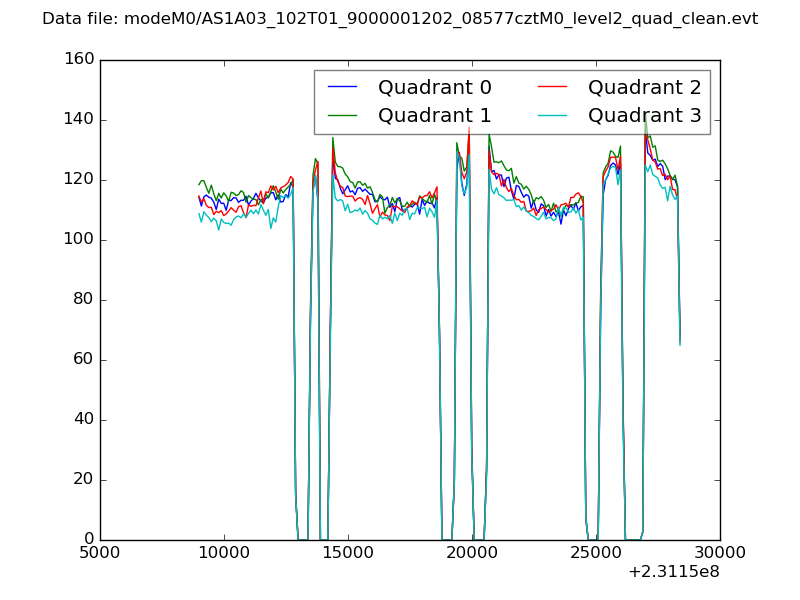
| Quadrant-wise count rates Data is divided into 100 sec bins |
 |
|
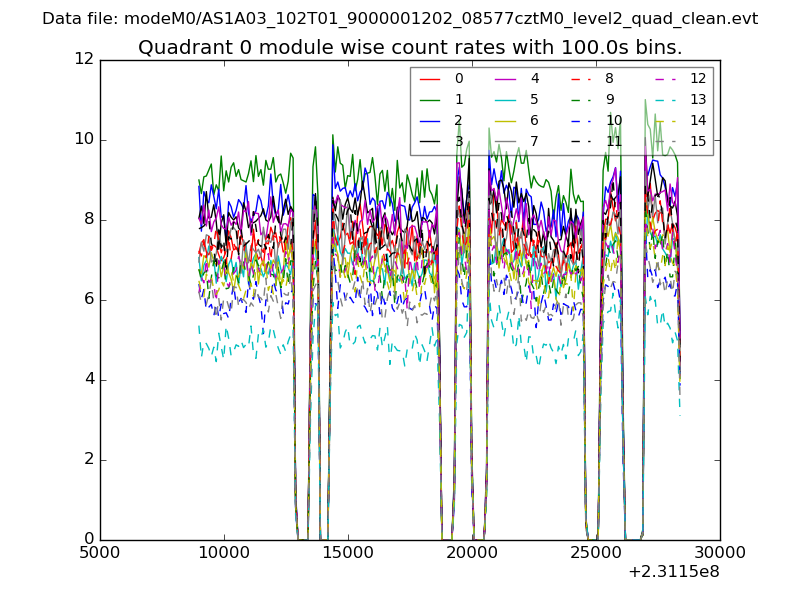
| Module-wise count rates for Quadrant A Data is divided into 100 sec bins |
 |
 |
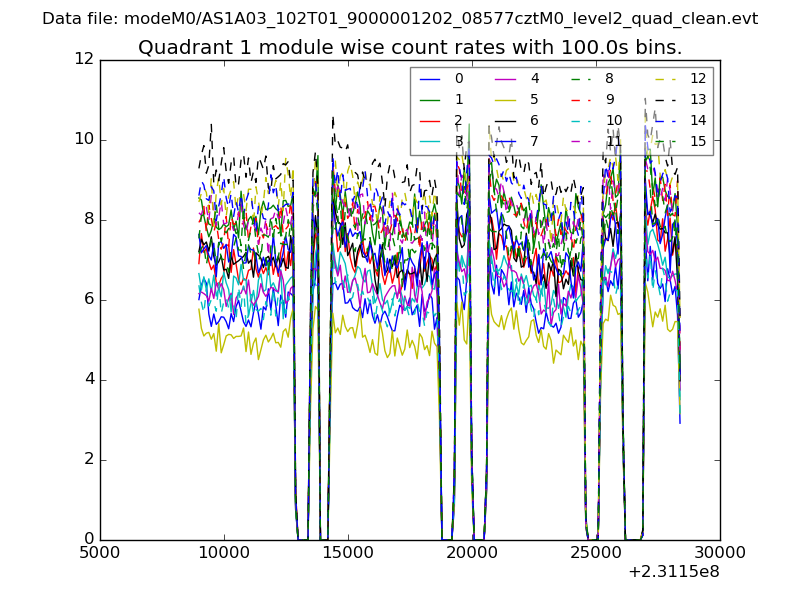
| Module-wise count rates for Quadrant B Data is divided into 100 sec bins |
 |
 |
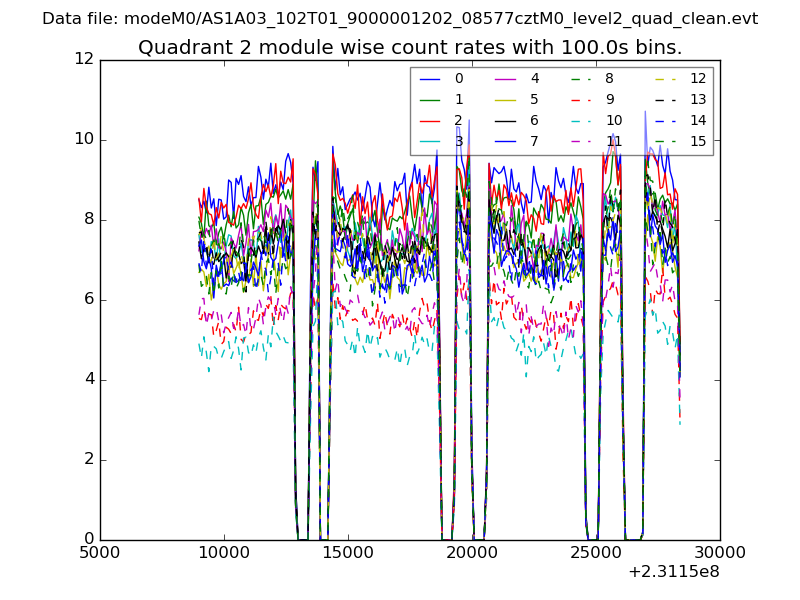
| Module-wise count rates for Quadrant C Data is divided into 100 sec bins |
 |
 |
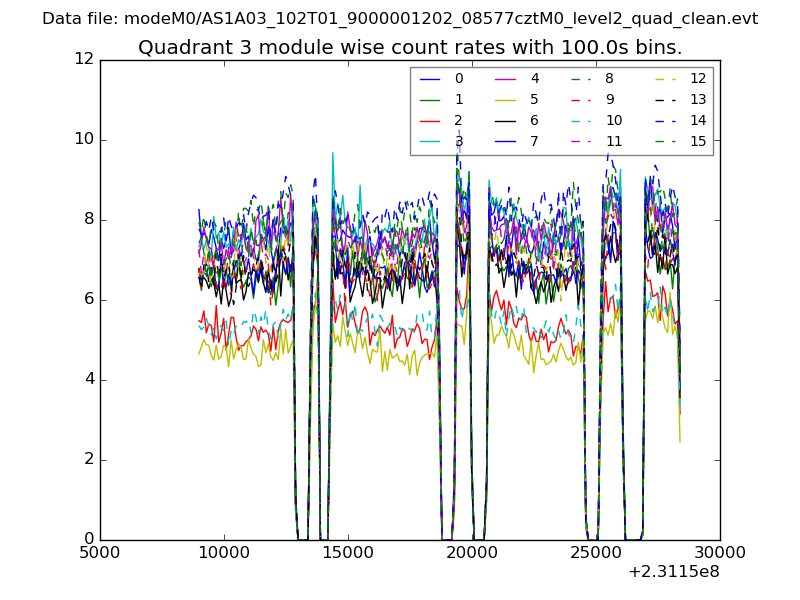
| Module-wise count rates for Quadrant D Data is divided into 100 sec bins |
 |
 |
| Parameter | Plot |
|---|---|
| CZT HV Monitor | 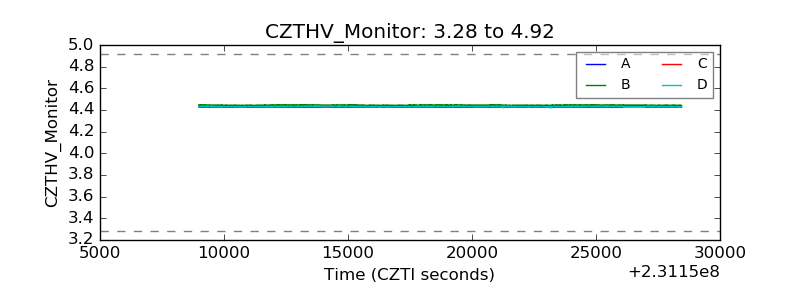 |
| D_VDD | 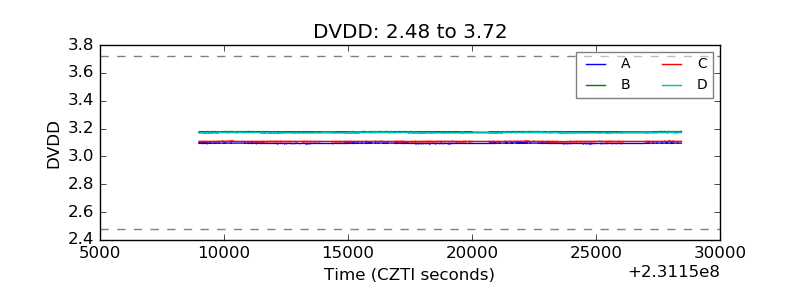 |
| Temperature 1 | 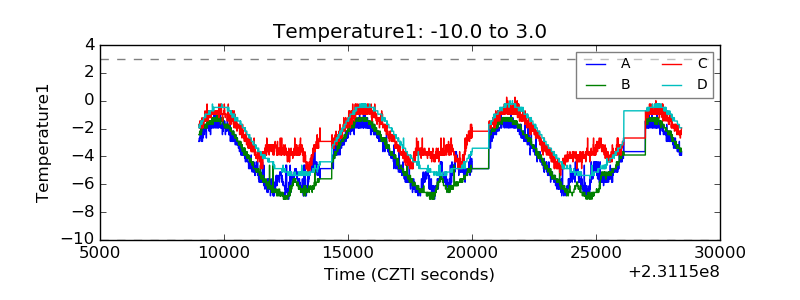 |
| Veto HV Monitor | 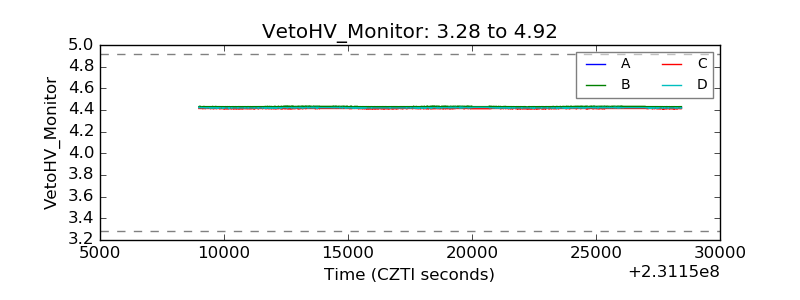 |
| Veto LLD | 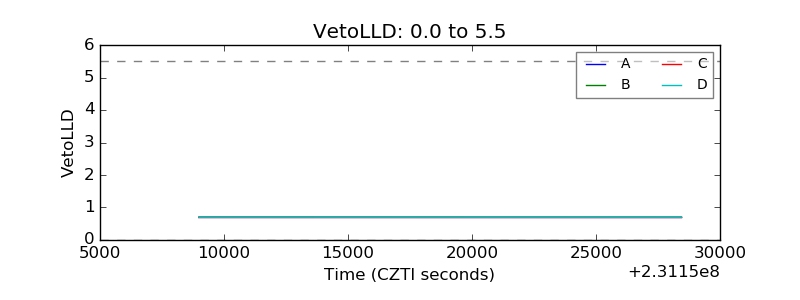 |
| Alpha Counter | 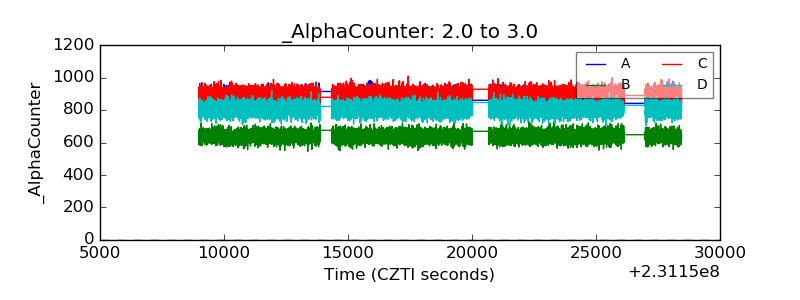 |
| _CPM_Rate | 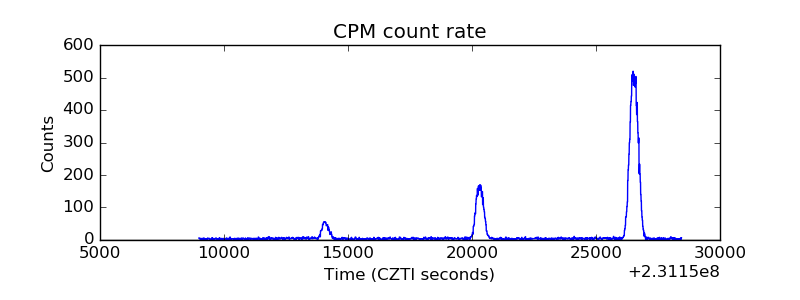 |
| CZT Counter | 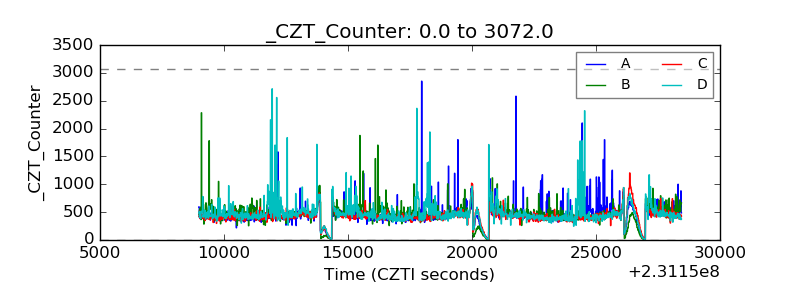 |
| +2.5 Volts monitor | 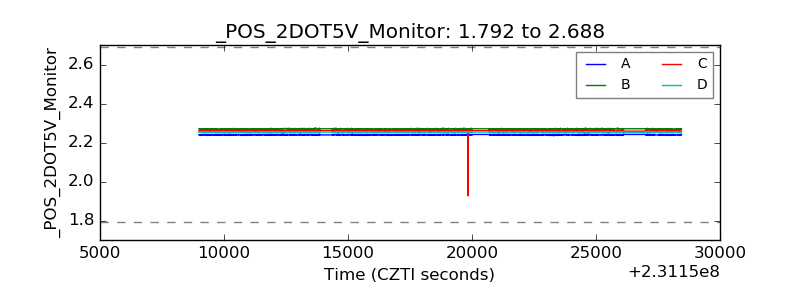 |
| +5 Volts monitor |  |
| _ROLL_ROT | 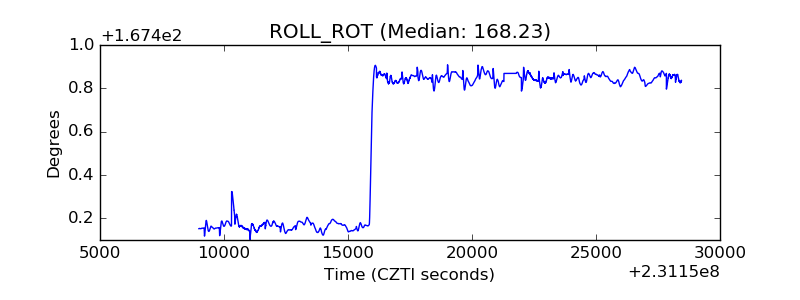 |
| _Roll_DEC | 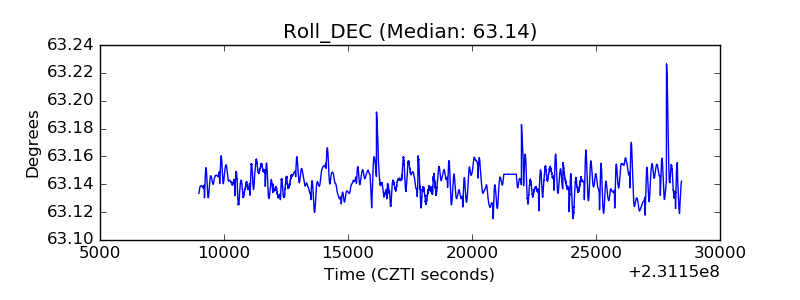 |
| _Roll_RA | 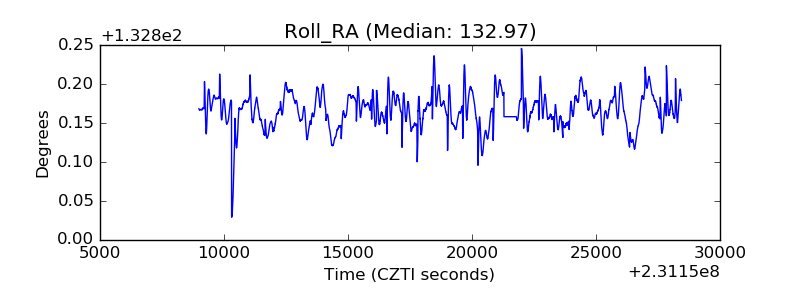 |
| Veto Counter | 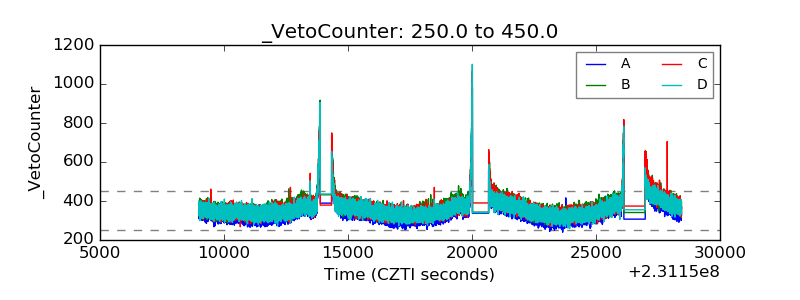 |