| Param | Original file | Final file |
|---|---|---|
| Filename | modeM0/AS1A03_102T01_9000001202_08578cztM0_level2.evt | modeM0/AS1A03_102T01_9000001202_08578cztM0_level2_quad_clean.evt |
| Size (bytes) | 412,695,360 | 103,651,200 |
| Size | 393.6 MB | 98.8 MB |
| Events in quadrant A | 2,992,850 | 675,084 |
| Events in quadrant B | 3,329,646 | 689,540 |
| Events in quadrant C | 2,728,632 | 680,617 |
| Events in quadrant D | 3,021,198 | 656,809 |
| Mode M9 | |||
|---|---|---|---|
| Quadrant | BADHDUFLAG | Total packets | Discarded packets |
| A | 0 | 10 | 0 |
| B | 0 | 10 | 0 |
| C | 0 | 10 | 0 |
| D | 0 | 10 | 0 |
| Mode SS | |||
|---|---|---|---|
| Quadrant | BADHDUFLAG | Total packets | Discarded packets |
| A | 0 | 128 | 0 |
| B | 0 | 128 | 0 |
| C | 0 | 128 | 0 |
| D | 0 | 128 | 0 |
| Mode M0 | |||
|---|---|---|---|
| Quadrant | BADHDUFLAG | Total packets | Discarded packets |
| A | 0 | 13081 | 2 |
| B | 0 | 14200 | 1 |
| C | 0 | 12670 | 1 |
| D | 0 | 13478 | 1 |
| Quadrant | Total seconds | Saturated seconds | Saturation percentage |
|---|---|---|---|
| A | 6261 | 25 | 0.399297% |
| B | 6261 | 62 | 0.990257% |
| C | 6261 | 28 | 0.447213% |
| D | 6261 | 48 | 0.766651% |
Noise dominated data is calculated using 1-second bins in cleaned event files. If a bin has >2000 counts, and if more than 50% of those come from <1% of pixels, then it is considered to be noise-dominated and hence unusable.
| Quadrant | # 1 sec bins | Bins with >0 counts | Bins with >2000 counts | High rate bins dominated by noise | Noise dominated (total time) | Noise dominated (detector-on time) | Marked lightcurve |
|---|---|---|---|---|---|---|---|
| A | 7261 | 6262 | 2 | 2 | 0.03% | 0.03% | 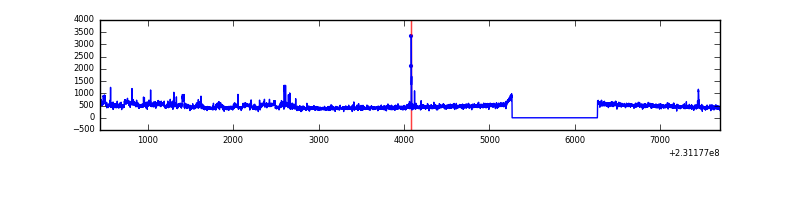 |
| B | 7261 | 6262 | 9 | 9 | 0.12% | 0.14% | 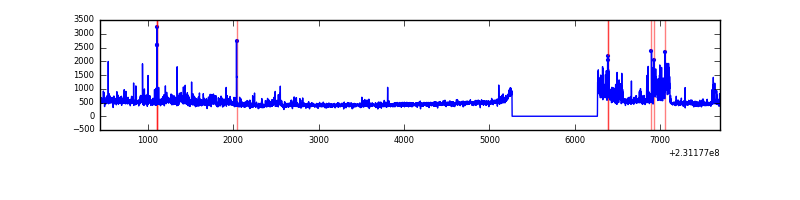 |
| C | 7261 | 6262 | 0 | 0 | 0.00% | 0.00% | 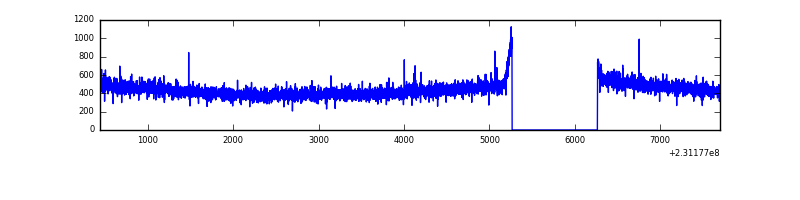 |
| D | 7261 | 6261 | 9 | 9 | 0.12% | 0.14% | 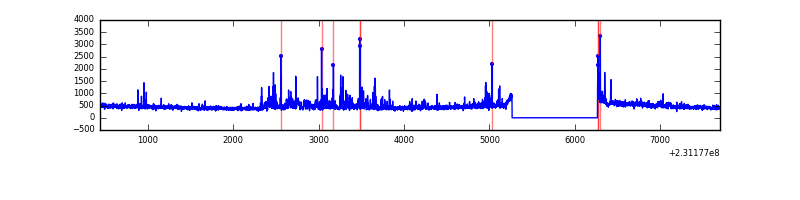 |
Top three noisy pixels from each quadrant. If the there are fewer than three noisy pixels in the level2.evt file, extra rows are filled as -1
| Pixel properties | Quadrant properties | ||||||
|---|---|---|---|---|---|---|---|
| Quadrant | DetID | PixID | Counts | Sigma | Mean | Median | Sigma |
| A | 15 | 236 | 225828 | 1558.8 | 705 | 689 | 144.4 |
| A | 5 | 16 | 20901 | 139.94 | 705 | 689 | 144.4 |
| A | 13 | 14 | 9753 | 62.76 | 705 | 689 | 144.4 |
| B | 0 | 219 | 249566 | 1837.22 | 714 | 697 | 135.5 |
| B | 11 | 51 | 138686 | 1018.67 | 714 | 697 | 135.5 |
| B | 5 | 255 | 50760 | 369.58 | 714 | 697 | 135.5 |
| C | 8 | 222 | 5398 | 29.08 | 697 | 698 | 161.6 |
| C | 13 | 61 | 5317 | 28.58 | 697 | 698 | 161.6 |
| C | 9 | 68 | 3100 | 14.86 | 697 | 698 | 161.6 |
| D | 12 | 233 | 135074 | 731.14 | 688 | 671 | 183.8 |
| D | 1 | 52 | 123386 | 667.56 | 688 | 671 | 183.8 |
| D | 13 | 137 | 46737 | 250.6 | 688 | 671 | 183.8 |
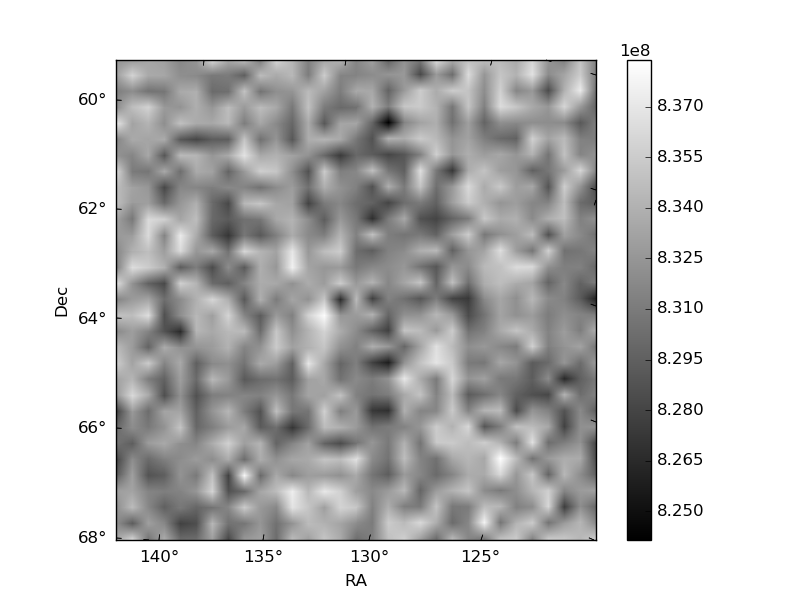
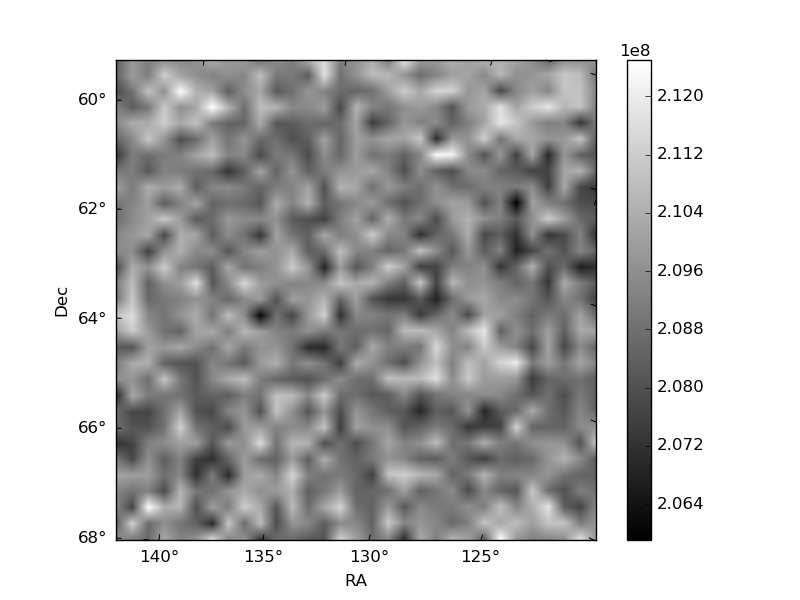
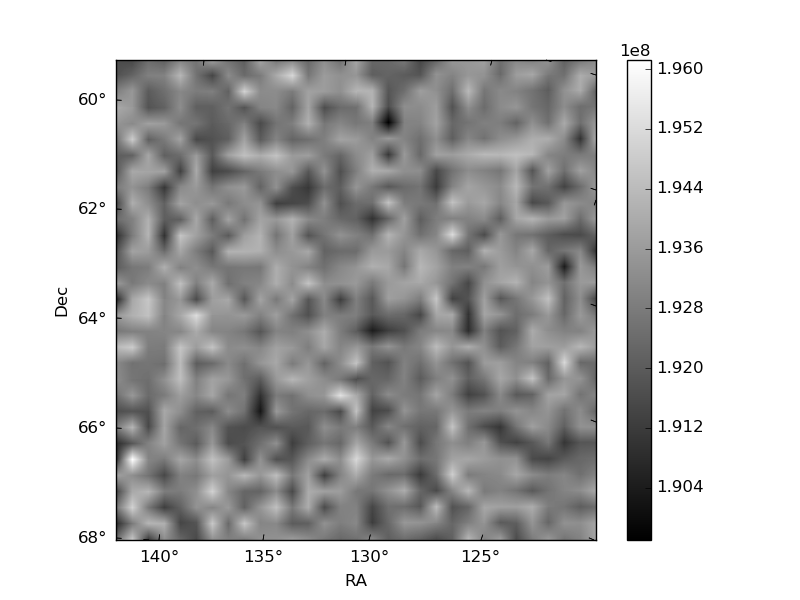
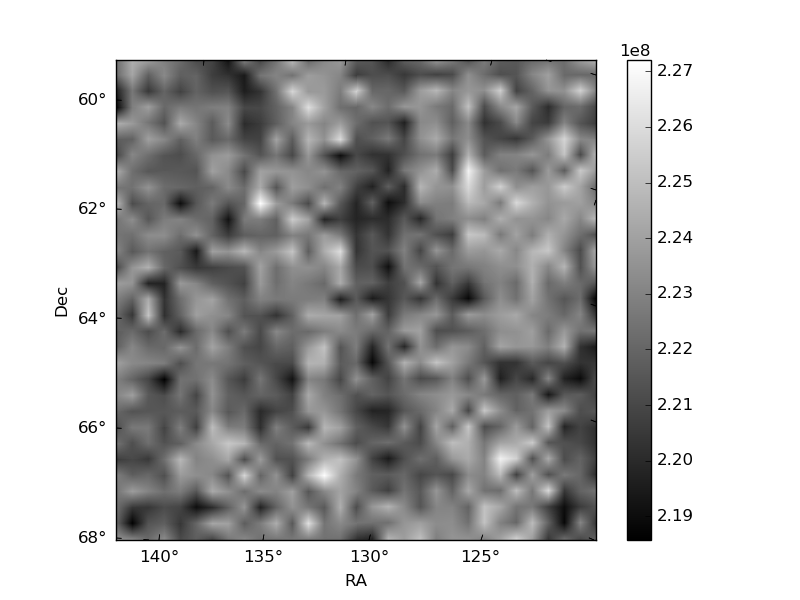
Histogram calculated using DETX and DETY for each event in the final _common_clean file
| Quadrant A | 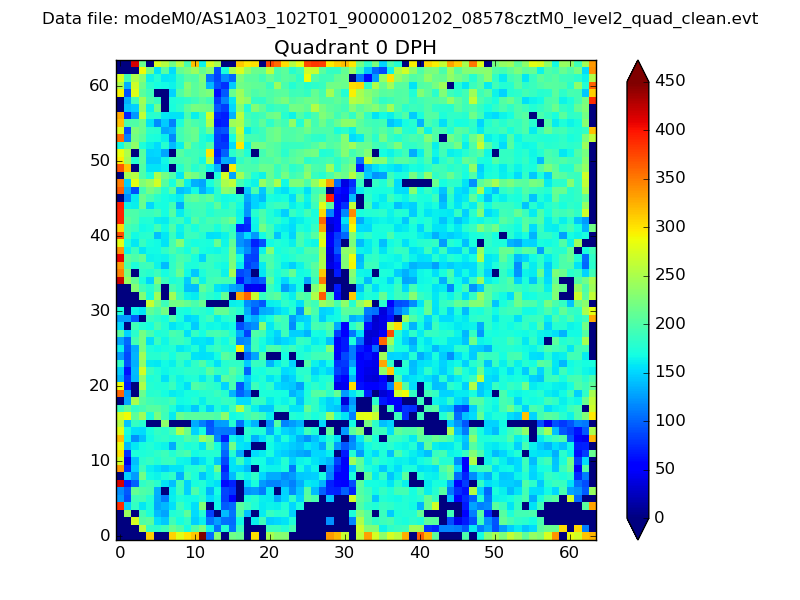 |
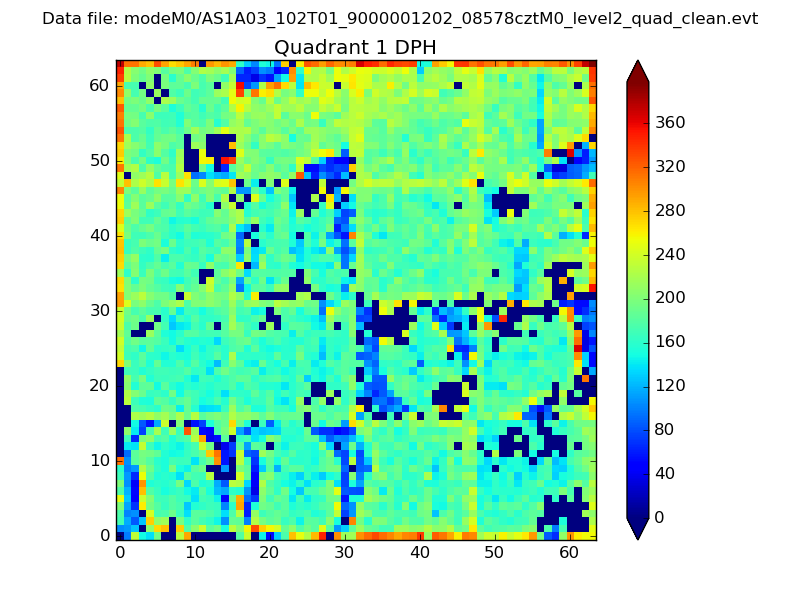 |
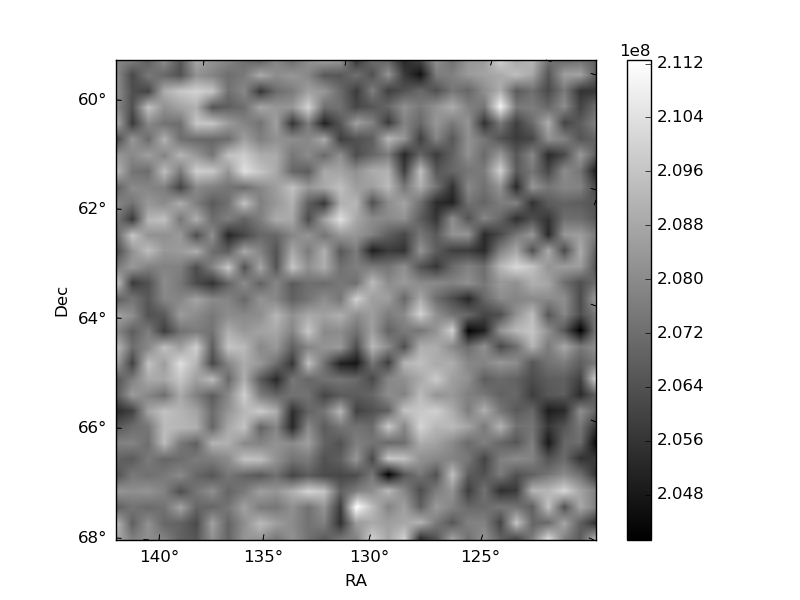
Quadrant B |
|---|---|---|---|
| Quadrant D | 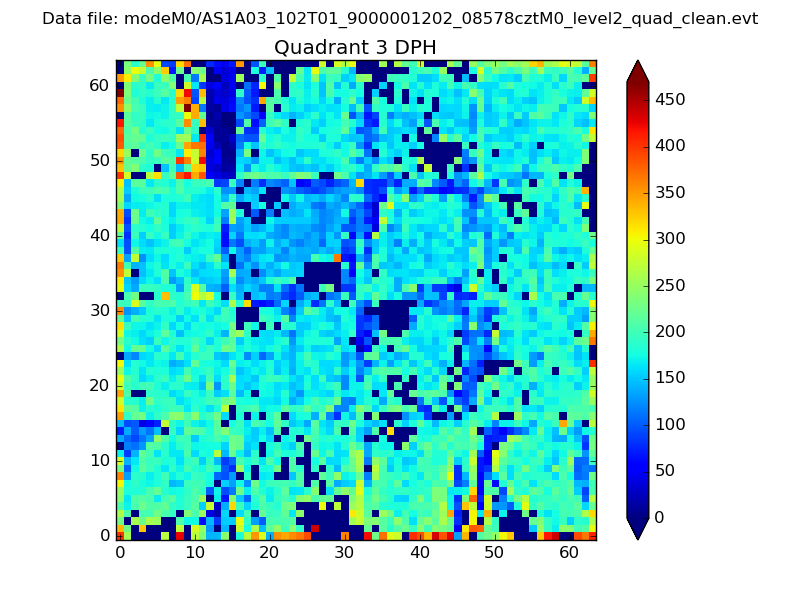 |
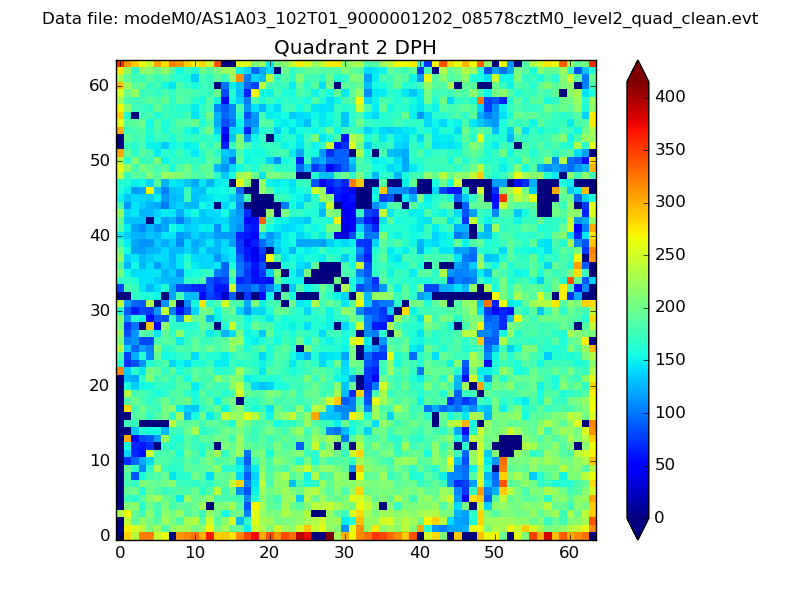 |
Quadrant C |
| Plot type | Count rate plots | Images |
|---|---|---|
| Comparison with Poisson distribution Blue bars denote a histogram of data divided into 1 sec bins. Red curve is a Poisson curve with rate = median count rate of data. |
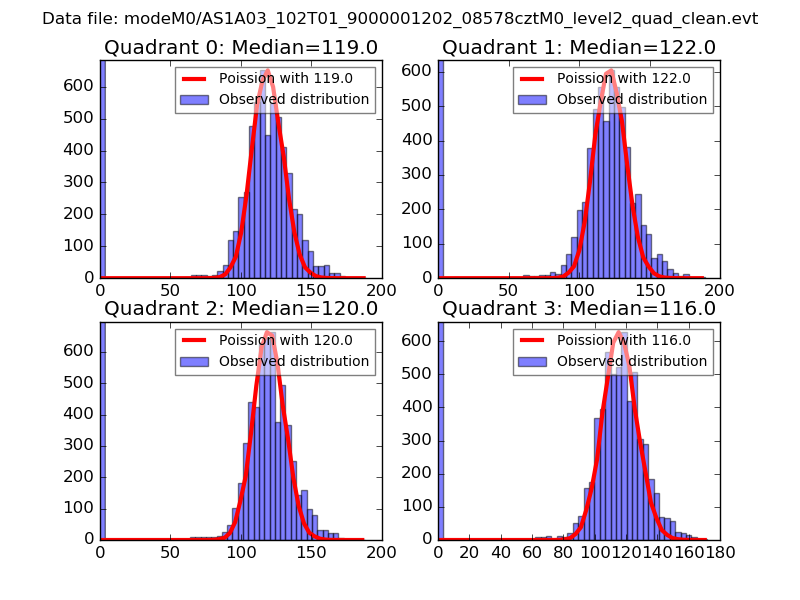 |
 |
| Quadrant-wise count rates Data is divided into 100 sec bins |
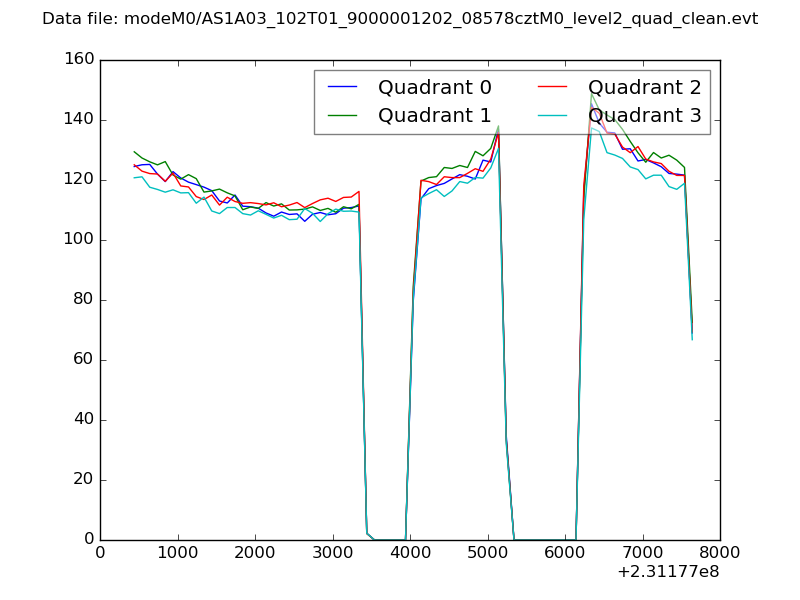 |
|
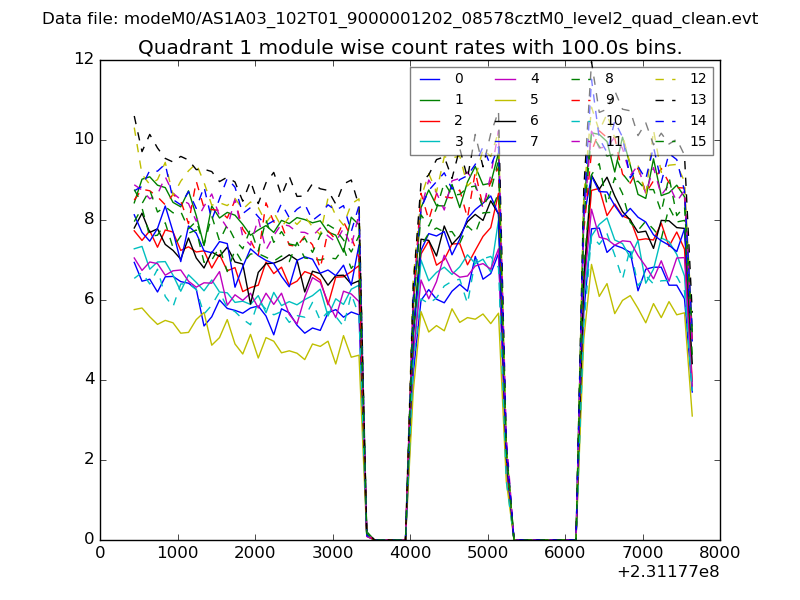
| Module-wise count rates for Quadrant A Data is divided into 100 sec bins |
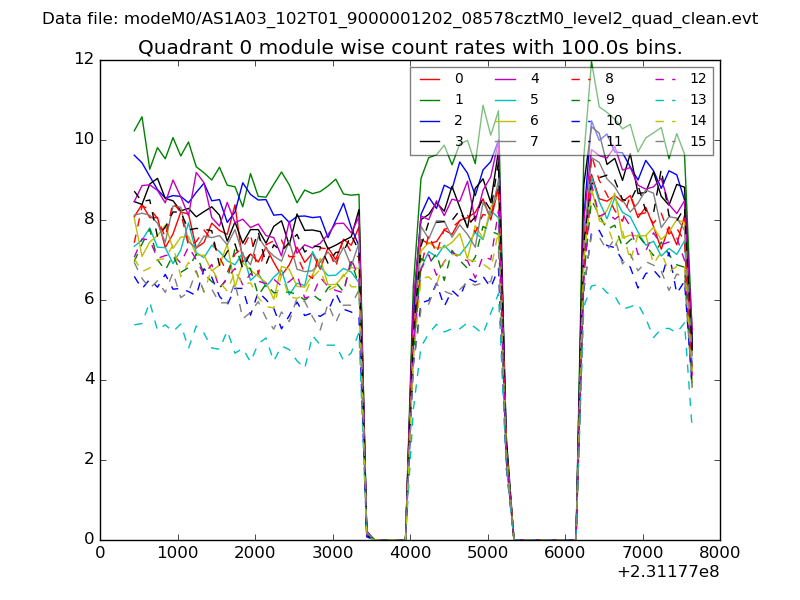 |
 |
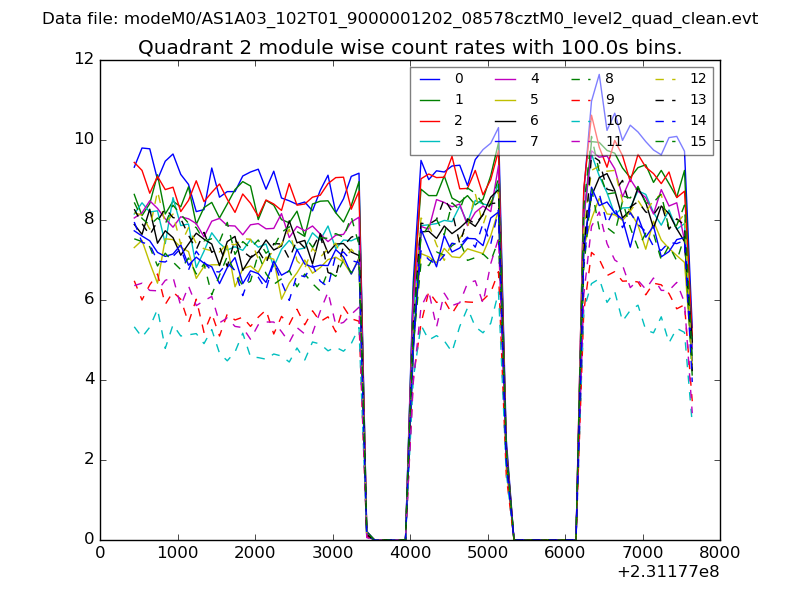
| Module-wise count rates for Quadrant B Data is divided into 100 sec bins |
 |
 |
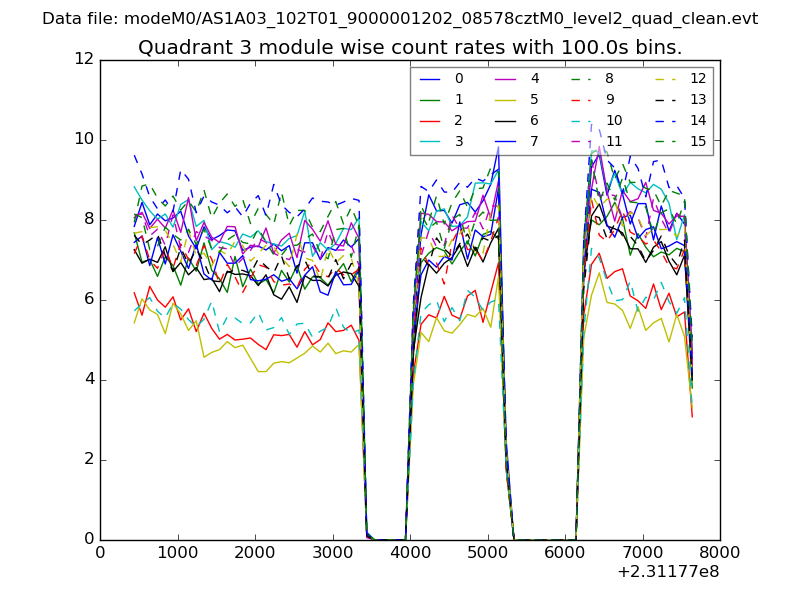
| Module-wise count rates for Quadrant C Data is divided into 100 sec bins |
 |
 |
| Module-wise count rates for Quadrant D Data is divided into 100 sec bins |
 |
 |
| Parameter | Plot |
|---|---|
| CZT HV Monitor |  |
| D_VDD | 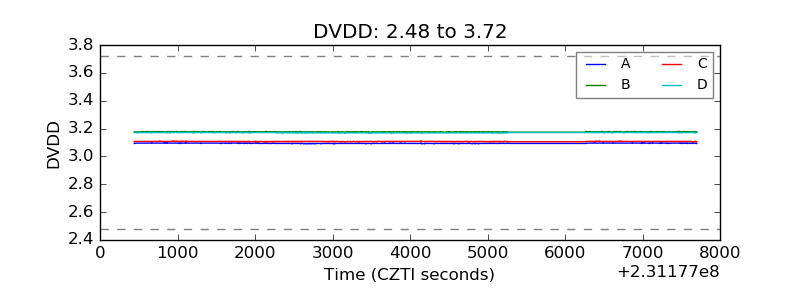 |
| Temperature 1 | 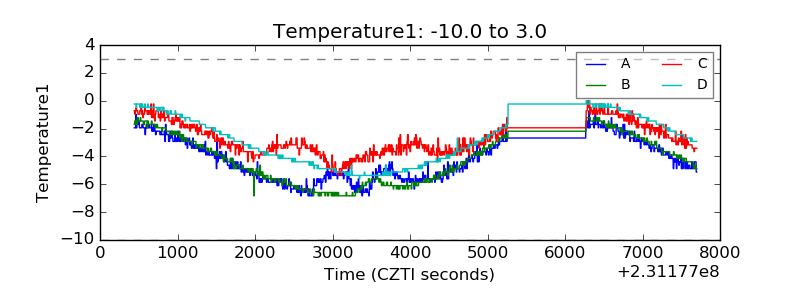 |
| Veto HV Monitor | 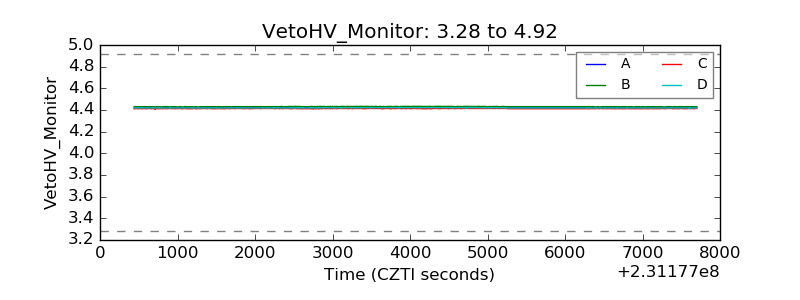 |
| Veto LLD | 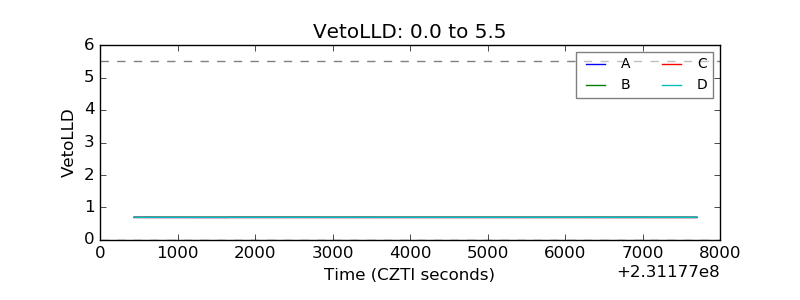 |
| Alpha Counter | 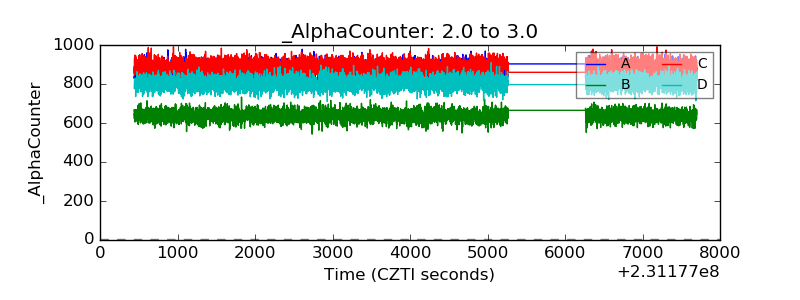 |
| _CPM_Rate | 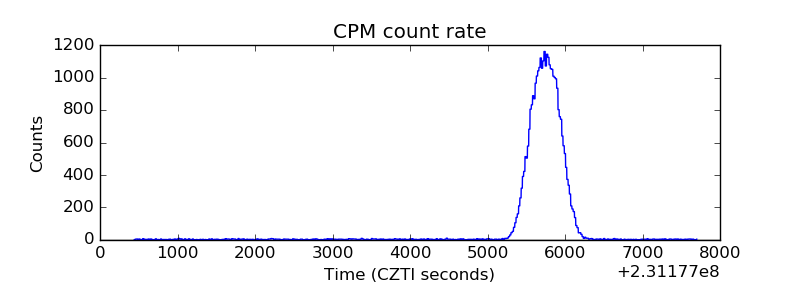 |
| CZT Counter | 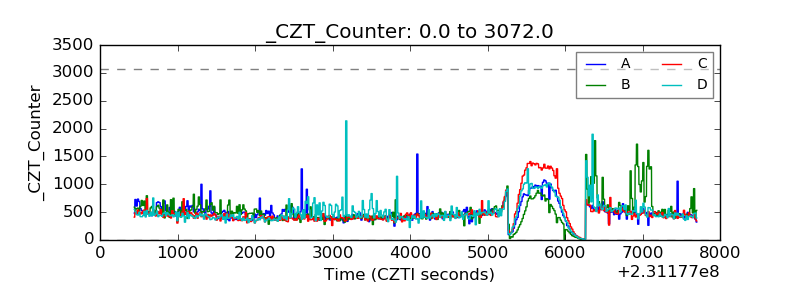 |
| +2.5 Volts monitor |  |
| +5 Volts monitor |  |
| _ROLL_ROT | 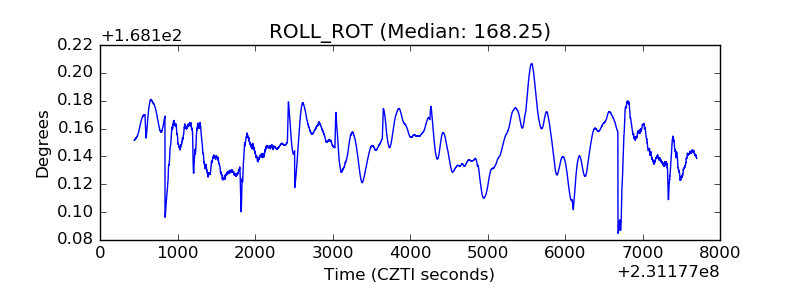 |
| _Roll_DEC | 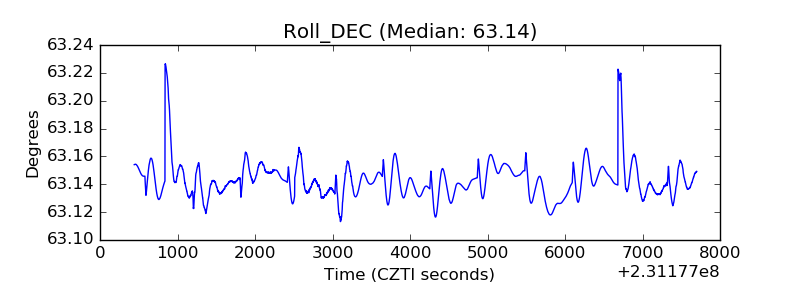 |
| _Roll_RA | 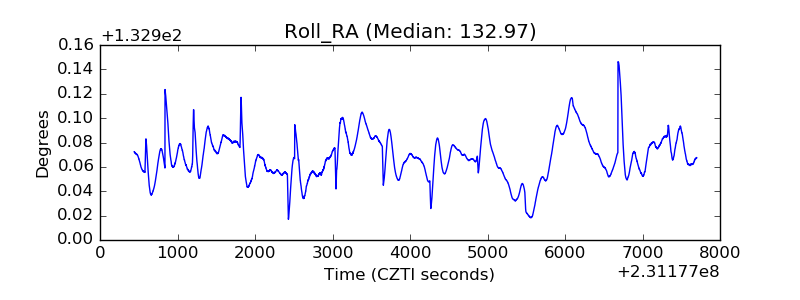 |
| Veto Counter | 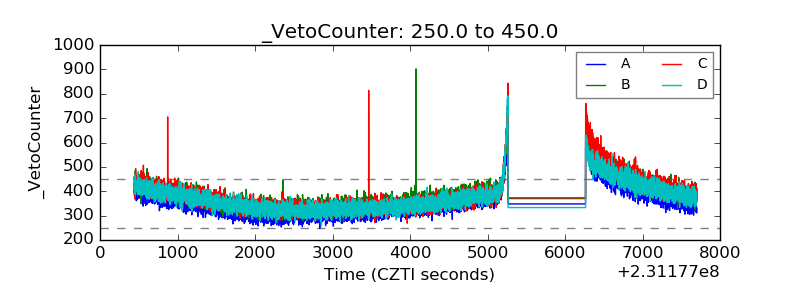 |