| Param | Original file | Final file |
|---|---|---|
| Filename | modeM0/AS1A03_102T01_9000001202_08581cztM0_level2.evt | modeM0/AS1A03_102T01_9000001202_08581cztM0_level2_quad_clean.evt |
| Size (bytes) | 451,321,920 | 111,314,880 |
| Size | 430.4 MB | 106.2 MB |
| Events in quadrant A | 2,993,563 | 727,519 |
| Events in quadrant B | 3,930,739 | 756,483 |
| Events in quadrant C | 2,872,828 | 746,081 |
| Events in quadrant D | 3,442,473 | 701,218 |
| Mode M9 | |||
|---|---|---|---|
| Quadrant | BADHDUFLAG | Total packets | Discarded packets |
| A | 0 | 20 | 0 |
| B | 0 | 20 | 0 |
| C | 0 | 20 | 0 |
| D | 0 | 21 | 0 |
| Mode SS | |||
|---|---|---|---|
| Quadrant | BADHDUFLAG | Total packets | Discarded packets |
| A | 0 | 126 | 0 |
| B | 0 | 126 | 0 |
| C | 0 | 126 | 0 |
| D | 0 | 126 | 0 |
| Mode M0 | |||
|---|---|---|---|
| Quadrant | BADHDUFLAG | Total packets | Discarded packets |
| A | 0 | 13314 | 3 |
| B | 0 | 16041 | 2 |
| C | 0 | 12975 | 2 |
| D | 0 | 14530 | 2 |
| Quadrant | Total seconds | Saturated seconds | Saturation percentage |
|---|---|---|---|
| A | 6314 | 36 | 0.570162% |
| B | 6314 | 188 | 2.977510% |
| C | 6314 | 28 | 0.443459% |
| D | 6314 | 123 | 1.948052% |
Noise dominated data is calculated using 1-second bins in cleaned event files. If a bin has >2000 counts, and if more than 50% of those come from <1% of pixels, then it is considered to be noise-dominated and hence unusable.
| Quadrant | # 1 sec bins | Bins with >0 counts | Bins with >2000 counts | High rate bins dominated by noise | Noise dominated (total time) | Noise dominated (detector-on time) | Marked lightcurve |
|---|---|---|---|---|---|---|---|
| A | 7529 | 6315 | 17 | 17 | 0.23% | 0.27% | 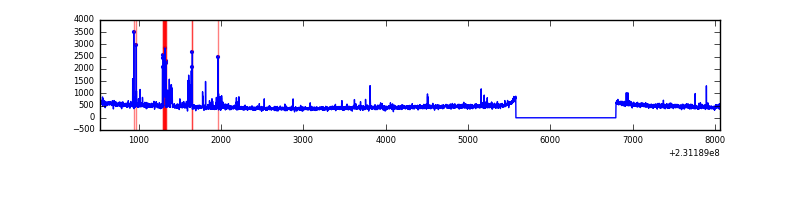 |
| B | 7529 | 6314 | 119 | 119 | 1.58% | 1.88% | 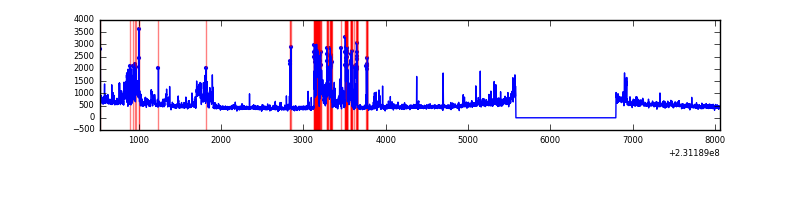 |
| C | 7529 | 6315 | 0 | 0 | 0.00% | 0.00% | 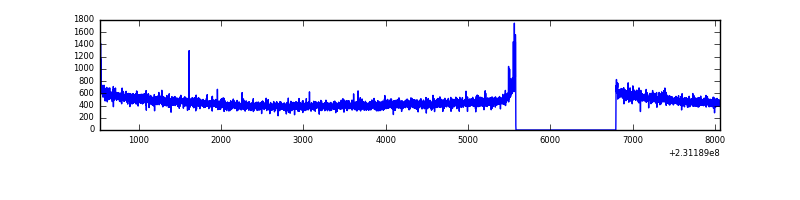 |
| D | 7529 | 6315 | 116 | 116 | 1.54% | 1.84% | 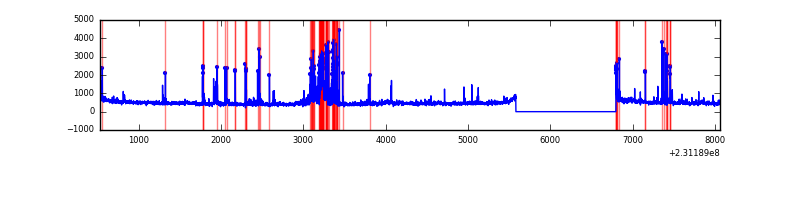 |
Top three noisy pixels from each quadrant. If the there are fewer than three noisy pixels in the level2.evt file, extra rows are filled as -1
| Pixel properties | Quadrant properties | ||||||
|---|---|---|---|---|---|---|---|
| Quadrant | DetID | PixID | Counts | Sigma | Mean | Median | Sigma |
| A | 15 | 223 | 91544 | 617.38 | 731 | 717 | 147.1 |
| A | 15 | 239 | 41171 | 274.98 | 731 | 717 | 147.1 |
| A | 13 | 14 | 12117 | 77.49 | 731 | 717 | 147.1 |
| B | 5 | 255 | 699854 | 5047.17 | 745 | 728 | 138.5 |
| B | 0 | 219 | 163823 | 1177.42 | 745 | 728 | 138.5 |
| B | 0 | 214 | 77197 | 552.05 | 745 | 728 | 138.5 |
| C | 14 | 234 | 13321 | 75.36 | 730 | 733 | 167.0 |
| C | 13 | 61 | 5402 | 27.95 | 730 | 733 | 167.0 |
| C | 8 | 222 | 5088 | 26.07 | 730 | 733 | 167.0 |
| D | 1 | 52 | 351362 | 2011.41 | 717 | 695 | 174.3 |
| D | 12 | 233 | 161973 | 925.08 | 717 | 695 | 174.3 |
| D | 13 | 122 | 37800 | 212.83 | 717 | 695 | 174.3 |
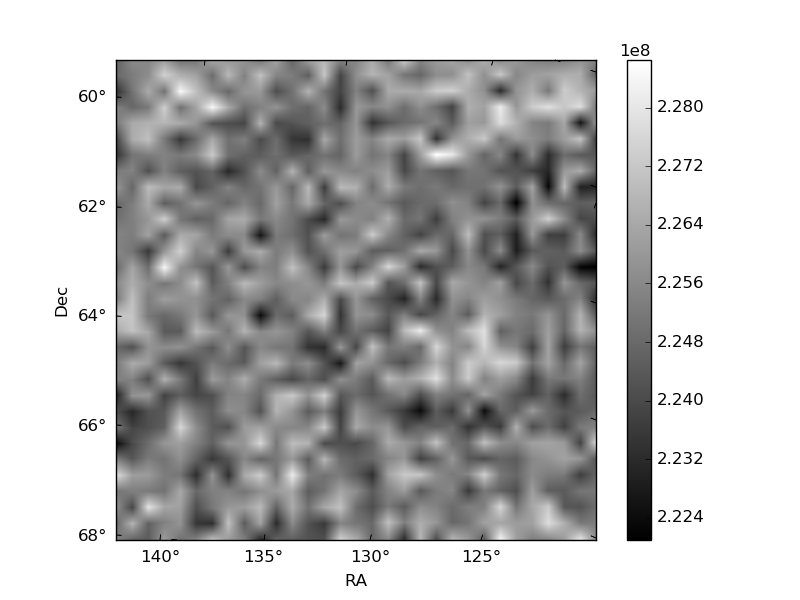
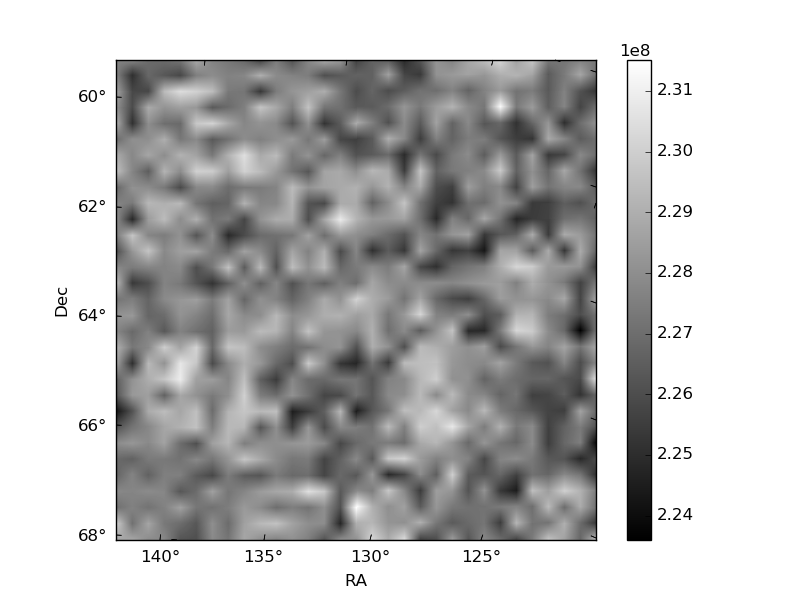
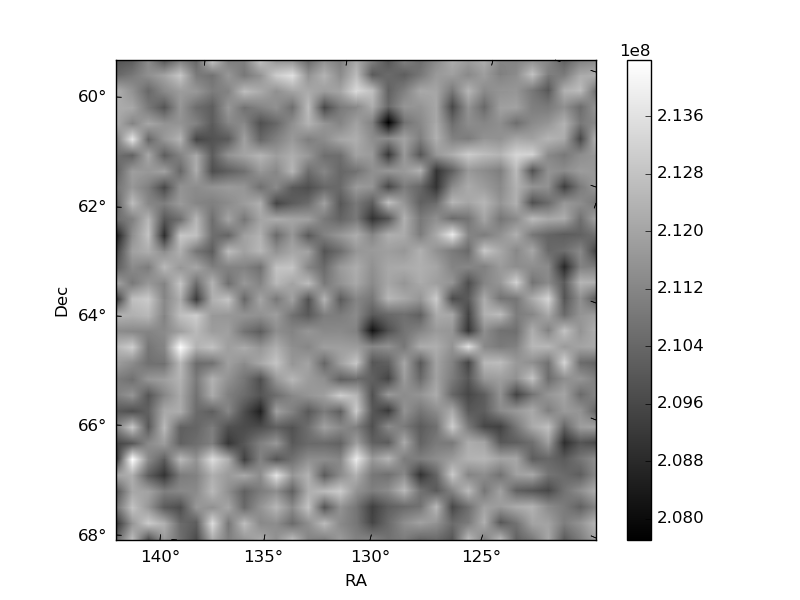
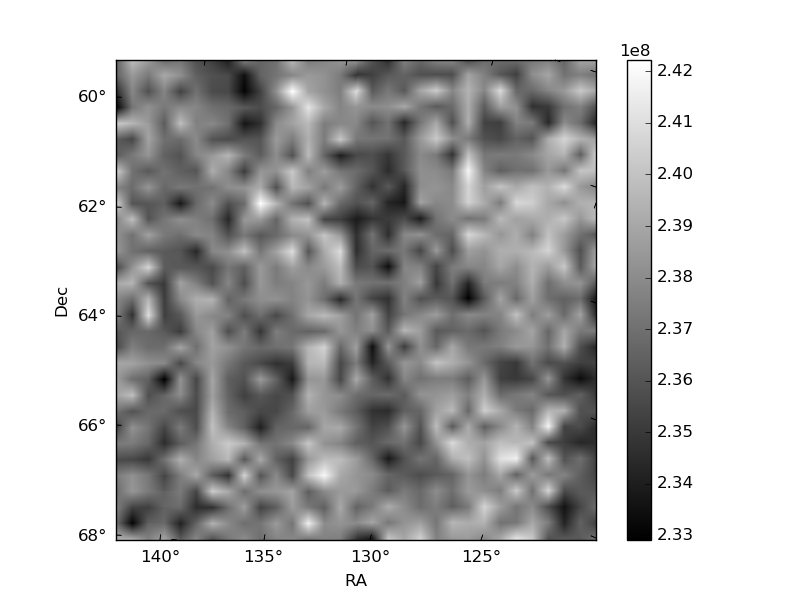
Histogram calculated using DETX and DETY for each event in the final _common_clean file
| Quadrant A | 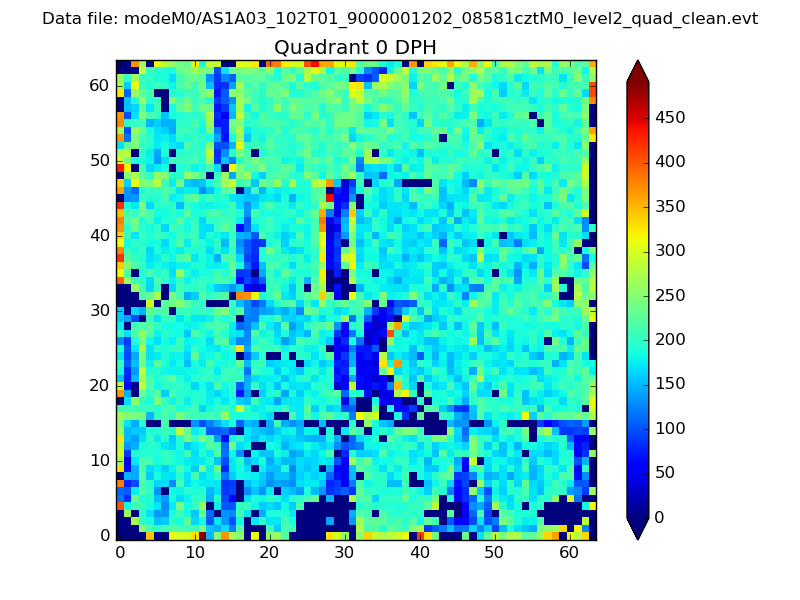 |
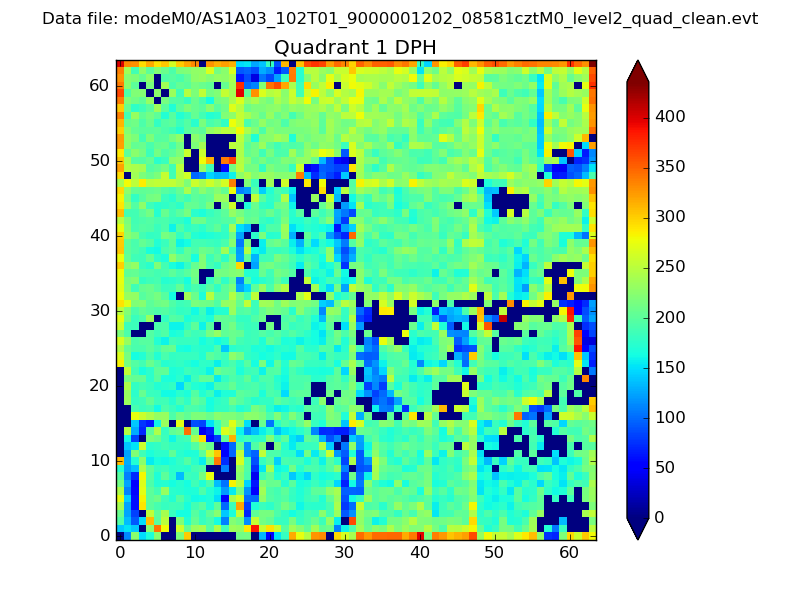 |
Quadrant B |
|---|---|---|---|
| Quadrant D | 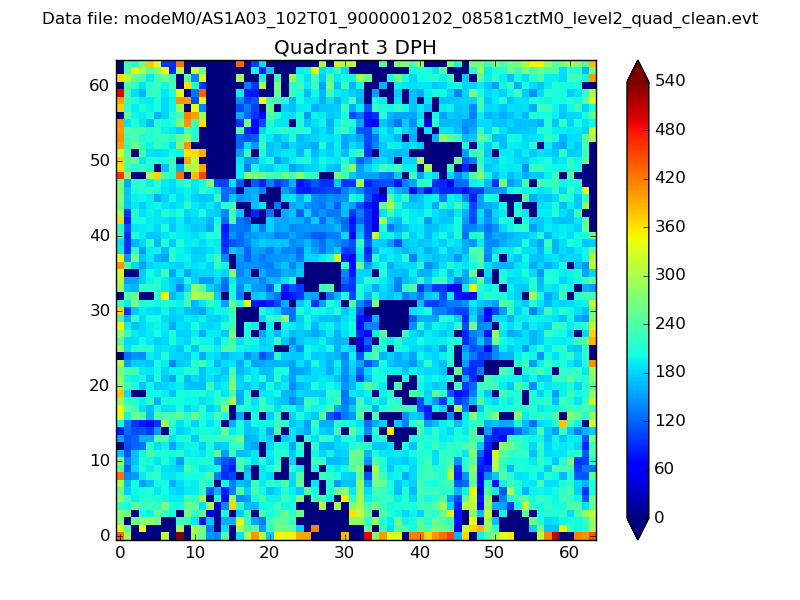 |
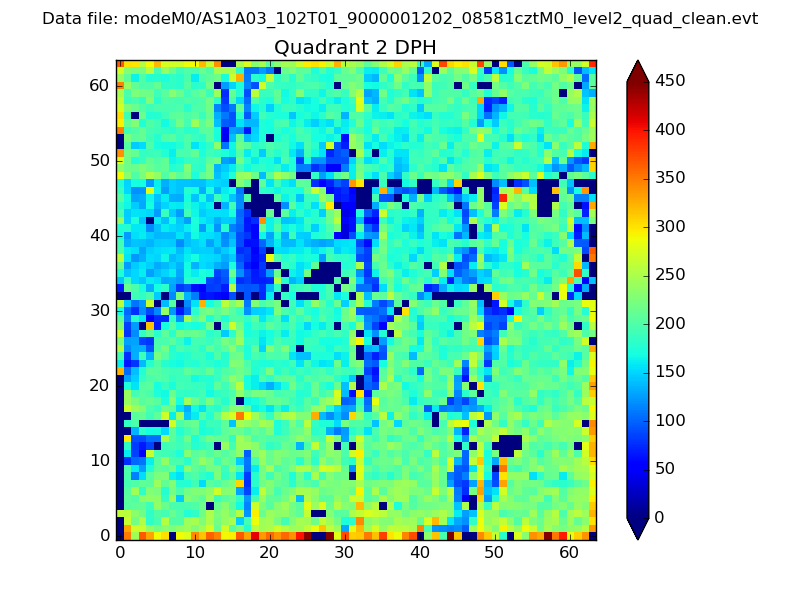 |
Quadrant C |
| Plot type | Count rate plots | Images |
|---|---|---|
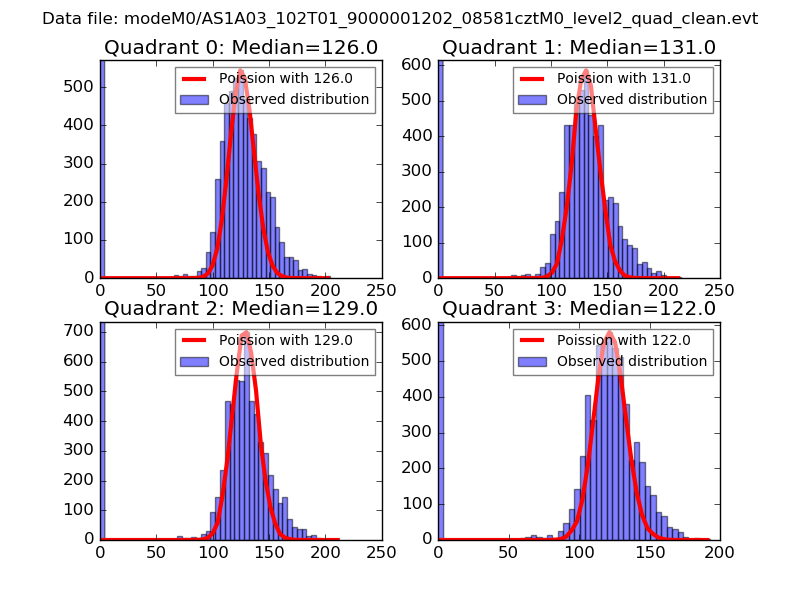
| Comparison with Poisson distribution Blue bars denote a histogram of data divided into 1 sec bins. Red curve is a Poisson curve with rate = median count rate of data. |
 |
 |
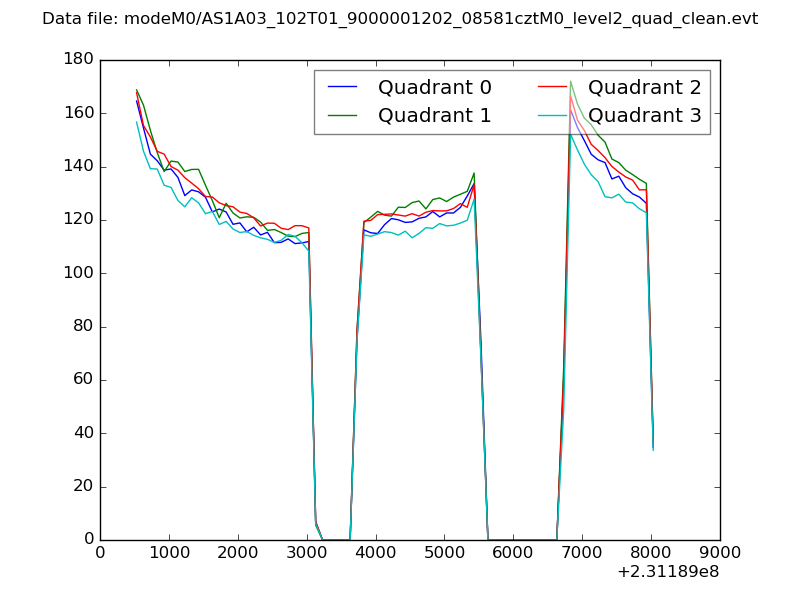
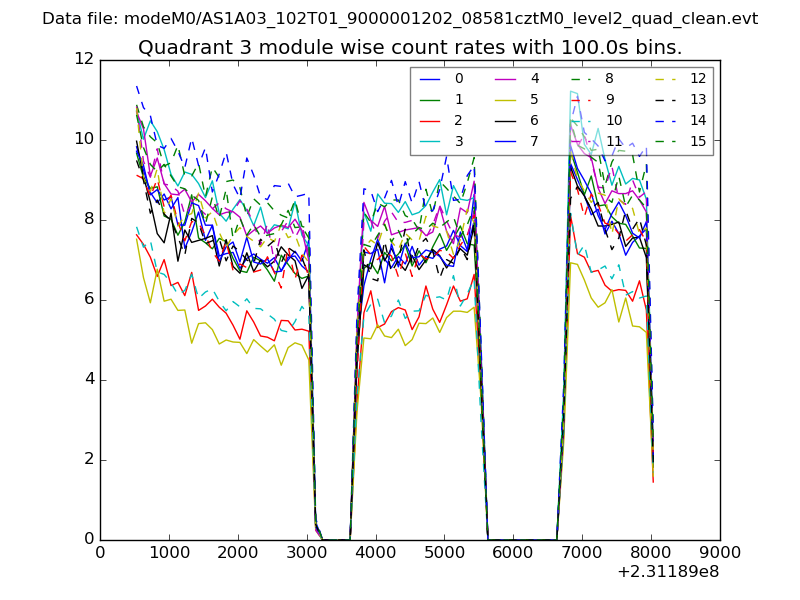
| Quadrant-wise count rates Data is divided into 100 sec bins |
 |
|
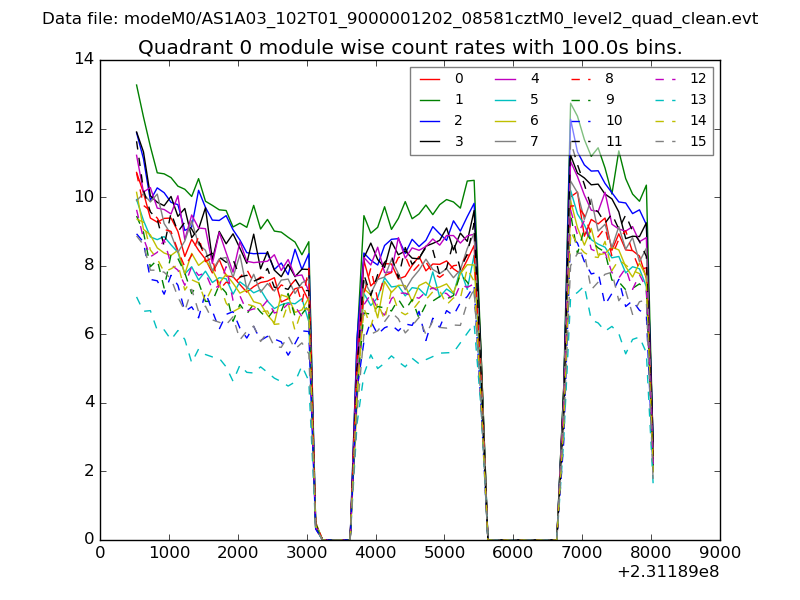
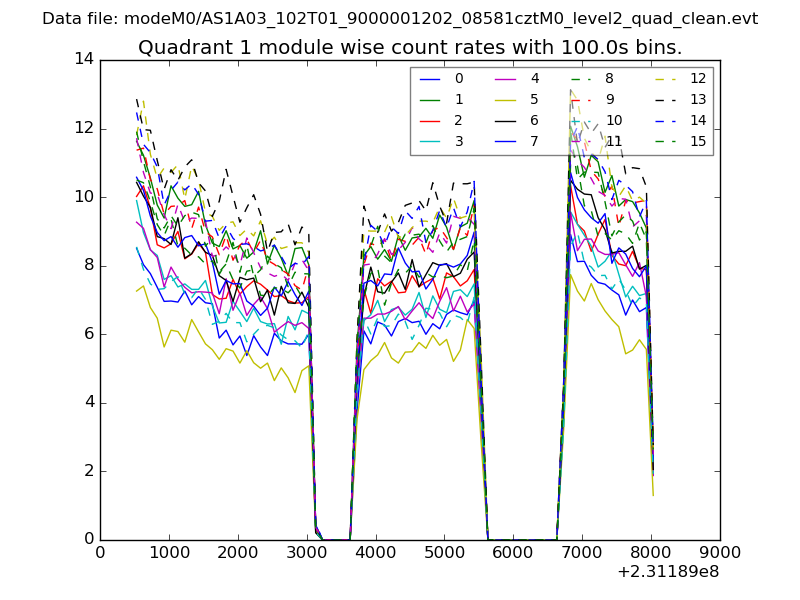
| Module-wise count rates for Quadrant A Data is divided into 100 sec bins |
 |
 |
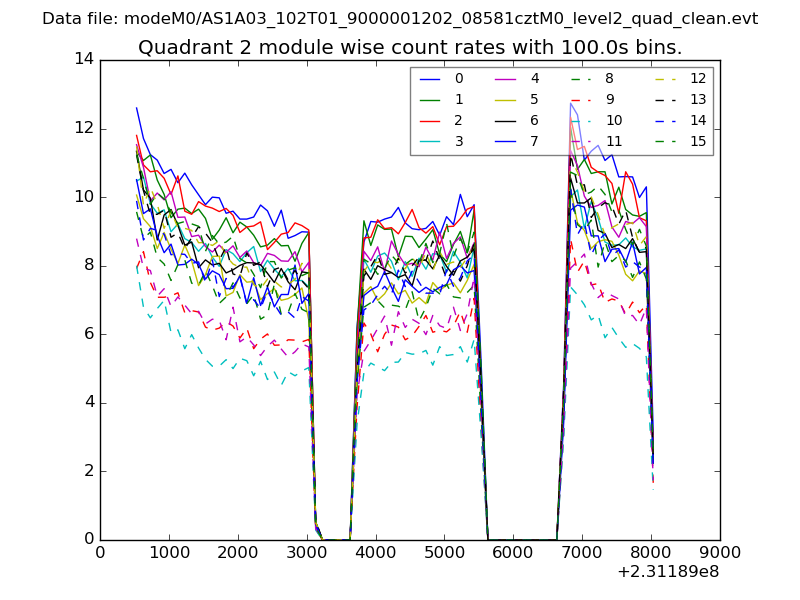
| Module-wise count rates for Quadrant B Data is divided into 100 sec bins |
 |
 |
| Module-wise count rates for Quadrant C Data is divided into 100 sec bins |
 |
 |
| Module-wise count rates for Quadrant D Data is divided into 100 sec bins |
 |
 |
| Parameter | Plot |
|---|---|
| CZT HV Monitor | 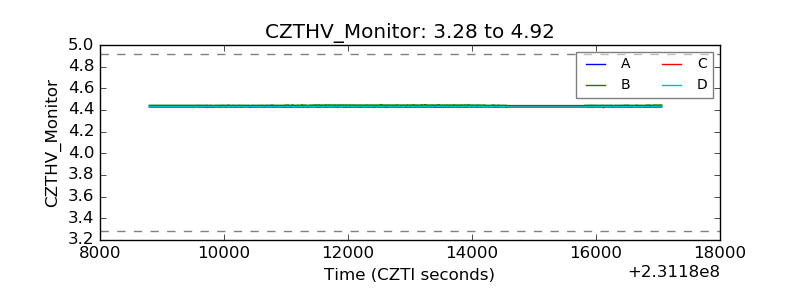 |
| D_VDD | 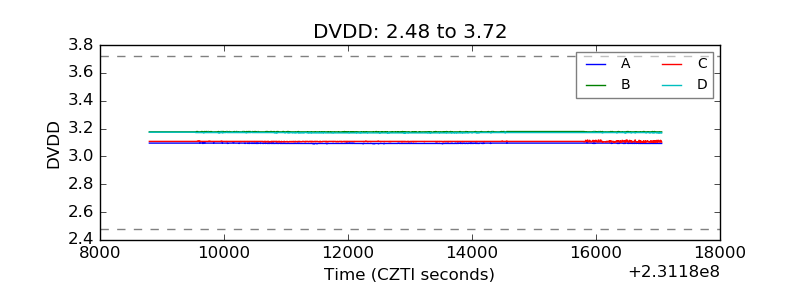 |
| Temperature 1 | 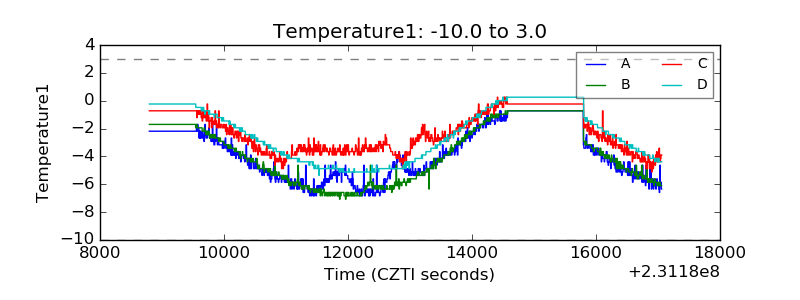 |
| Veto HV Monitor | 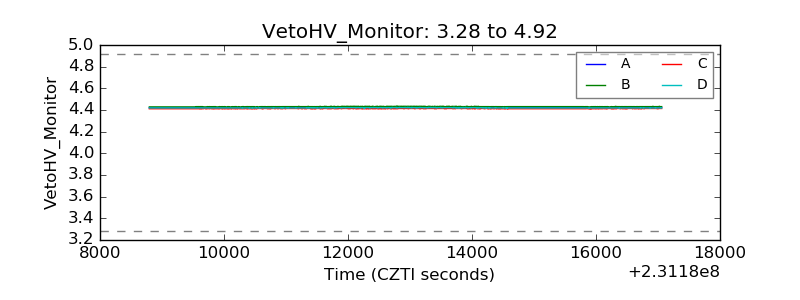 |
| Veto LLD | 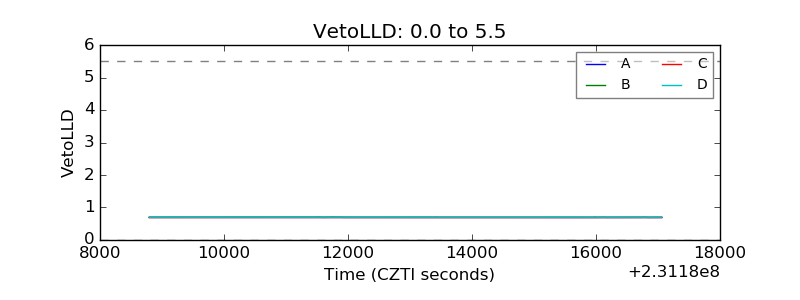 |
| Alpha Counter | 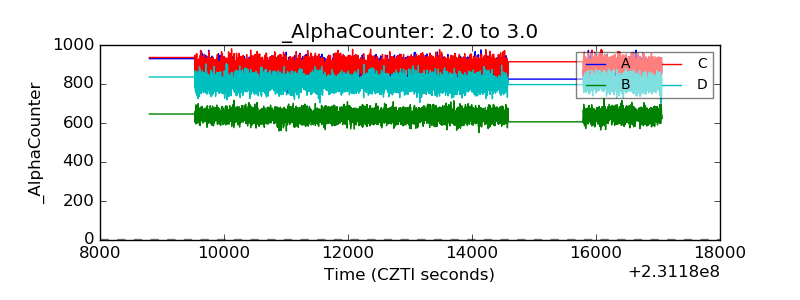 |
| _CPM_Rate | 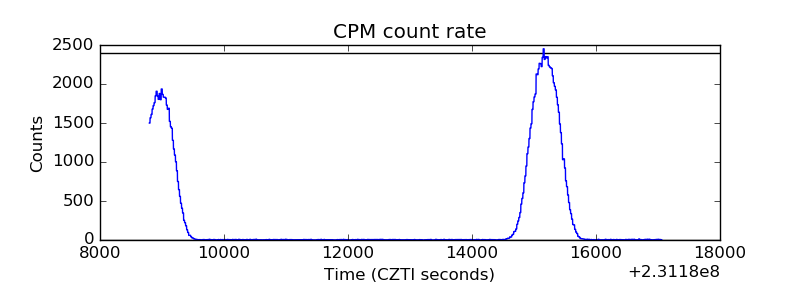 |
| CZT Counter | 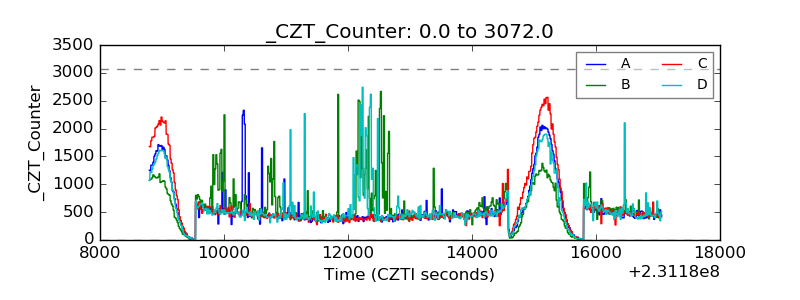 |
| +2.5 Volts monitor |  |
| +5 Volts monitor |  |
| _ROLL_ROT | 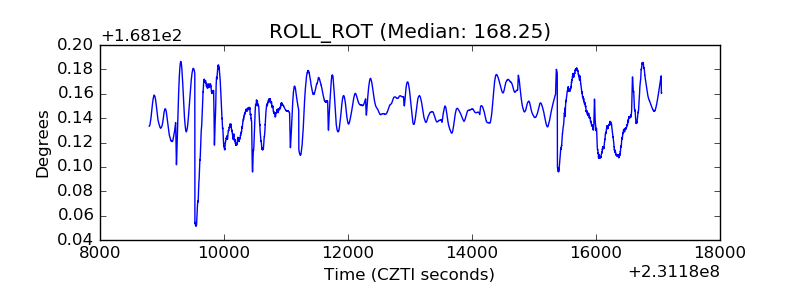 |
| _Roll_DEC | 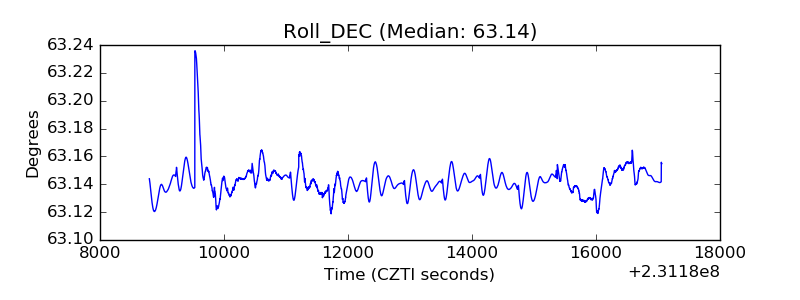 |
| _Roll_RA | 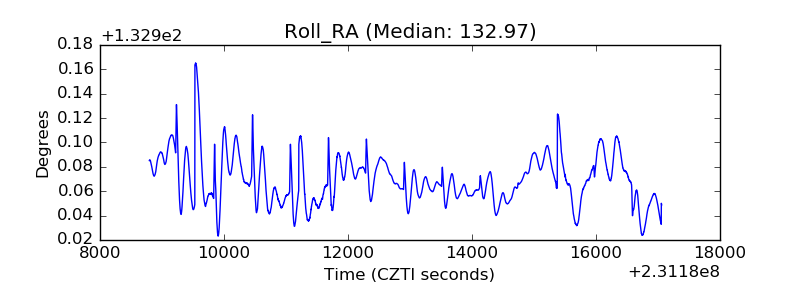 |
| Veto Counter | 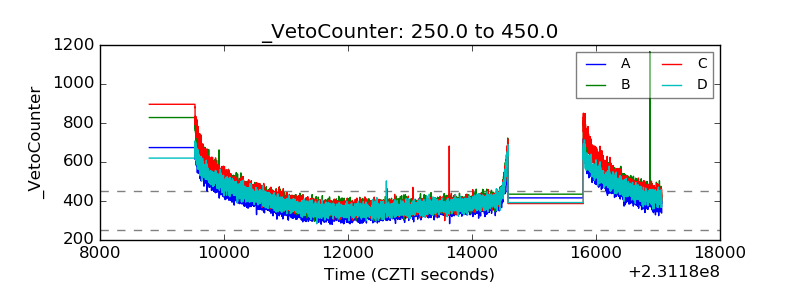 |