| Param | Original file | Final file |
|---|---|---|
| Filename | modeM0/AS1A03_102T01_9000001202_08584cztM0_level2.evt | modeM0/AS1A03_102T01_9000001202_08584cztM0_level2_quad_clean.evt |
| Size (bytes) | 429,505,920 | 105,105,600 |
| Size | 409.6 MB | 100.2 MB |
| Events in quadrant A | 3,048,368 | 678,442 |
| Events in quadrant B | 3,307,810 | 705,171 |
| Events in quadrant C | 2,919,184 | 686,024 |
| Events in quadrant D | 3,281,330 | 651,360 |
| Mode M9 | |||
|---|---|---|---|
| Quadrant | BADHDUFLAG | Total packets | Discarded packets |
| A | 0 | 17 | 0 |
| B | 0 | 17 | 0 |
| C | 0 | 17 | 0 |
| D | 0 | 18 | 0 |
| Mode SS | |||
|---|---|---|---|
| Quadrant | BADHDUFLAG | Total packets | Discarded packets |
| A | 0 | 136 | 0 |
| B | 0 | 136 | 0 |
| C | 0 | 136 | 0 |
| D | 0 | 136 | 0 |
| Mode M0 | |||
|---|---|---|---|
| Quadrant | BADHDUFLAG | Total packets | Discarded packets |
| A | 0 | 13831 | 3 |
| B | 0 | 14235 | 2 |
| C | 0 | 13518 | 2 |
| D | 0 | 14590 | 2 |
| Quadrant | Total seconds | Saturated seconds | Saturation percentage |
|---|---|---|---|
| A | 6625 | 55 | 0.830189% |
| B | 6625 | 59 | 0.890566% |
| C | 6625 | 28 | 0.422642% |
| D | 6625 | 76 | 1.147170% |
Noise dominated data is calculated using 1-second bins in cleaned event files. If a bin has >2000 counts, and if more than 50% of those come from <1% of pixels, then it is considered to be noise-dominated and hence unusable.
| Quadrant | # 1 sec bins | Bins with >0 counts | Bins with >2000 counts | High rate bins dominated by noise | Noise dominated (total time) | Noise dominated (detector-on time) | Marked lightcurve |
|---|---|---|---|---|---|---|---|
| A | 7845 | 6626 | 13 | 13 | 0.17% | 0.20% | 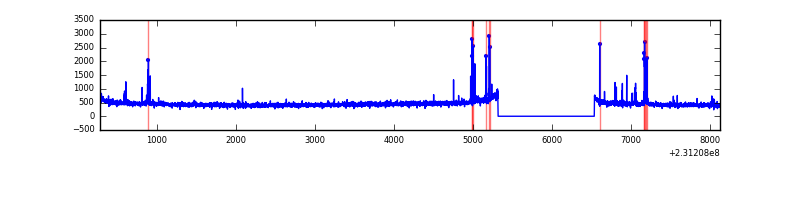 |
| B | 7845 | 6626 | 2 | 2 | 0.03% | 0.03% | 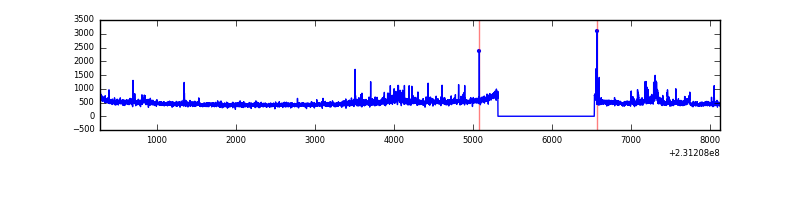 |
| C | 7845 | 6626 | 0 | 0 | 0.00% | 0.00% | 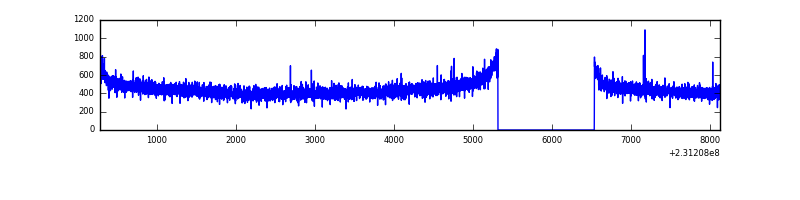 |
| D | 7845 | 6626 | 55 | 55 | 0.70% | 0.83% | 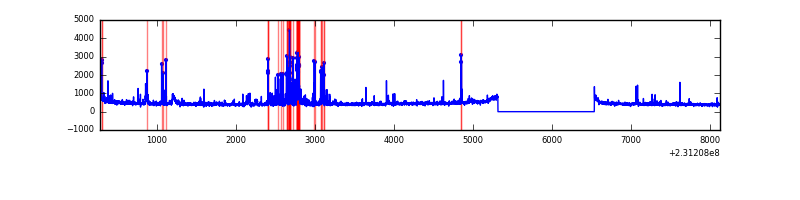 |
Top three noisy pixels from each quadrant. If the there are fewer than three noisy pixels in the level2.evt file, extra rows are filled as -1
| Pixel properties | Quadrant properties | ||||||
|---|---|---|---|---|---|---|---|
| Quadrant | DetID | PixID | Counts | Sigma | Mean | Median | Sigma |
| A | 15 | 223 | 65295 | 423.19 | 759 | 742 | 152.5 |
| A | 15 | 239 | 33205 | 212.82 | 759 | 742 | 152.5 |
| A | 13 | 248 | 11629 | 71.37 | 759 | 742 | 152.5 |
| B | 10 | 252 | 102155 | 696.08 | 776 | 757 | 145.7 |
| B | 0 | 214 | 94714 | 645.0 | 776 | 757 | 145.7 |
| B | 0 | 219 | 27542 | 183.87 | 776 | 757 | 145.7 |
| C | 13 | 61 | 5743 | 28.95 | 747 | 747 | 172.6 |
| C | 8 | 222 | 3295 | 14.76 | 747 | 747 | 172.6 |
| C | 14 | 67 | 3075 | 13.49 | 747 | 747 | 172.6 |
| D | 12 | 233 | 280689 | 1438.21 | 730 | 712 | 194.7 |
| D | 1 | 52 | 69632 | 354.03 | 730 | 712 | 194.7 |
| D | 7 | 71 | 56376 | 285.94 | 730 | 712 | 194.7 |
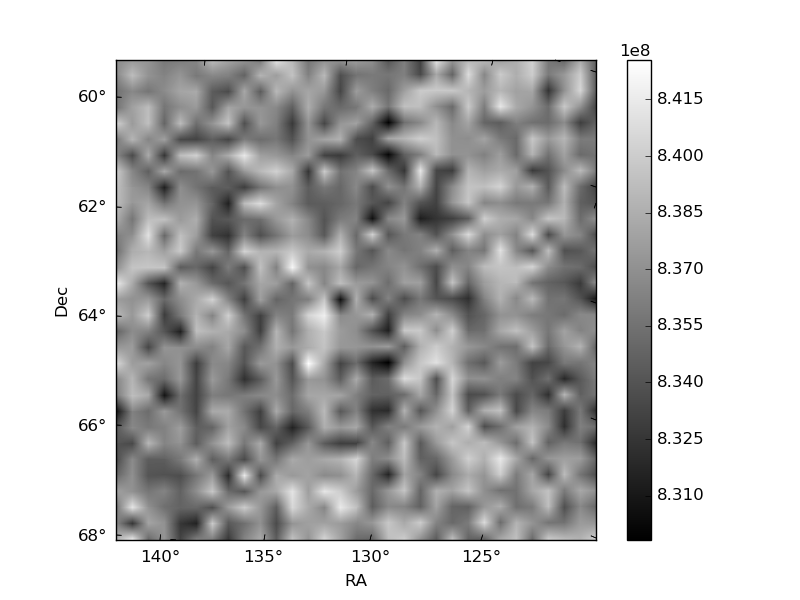
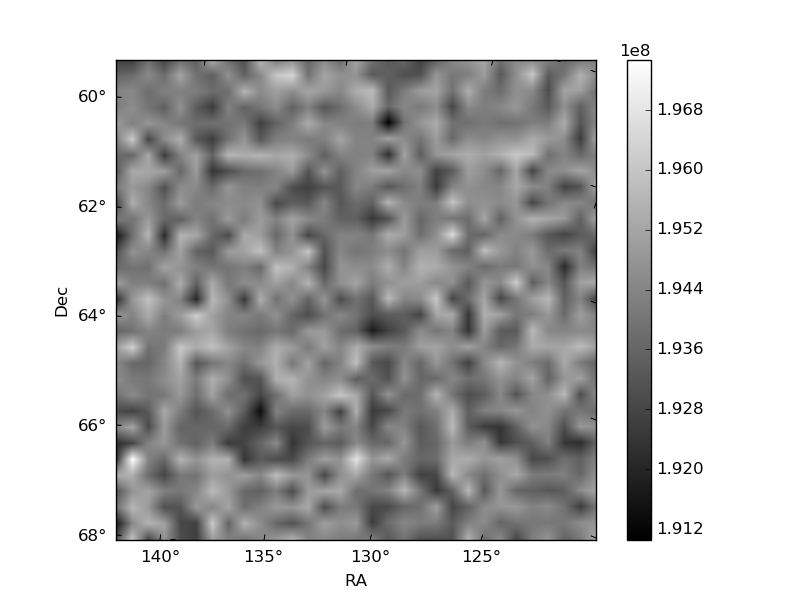
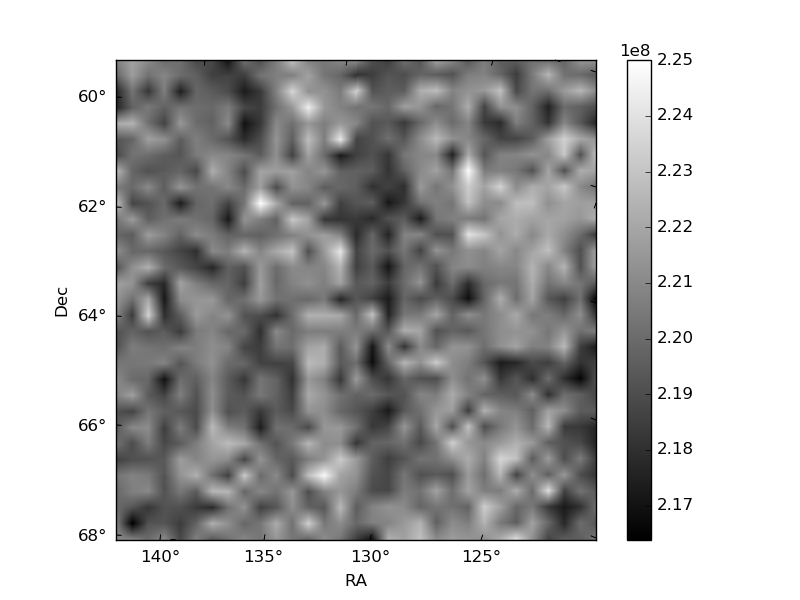
Histogram calculated using DETX and DETY for each event in the final _common_clean file
| Quadrant A | 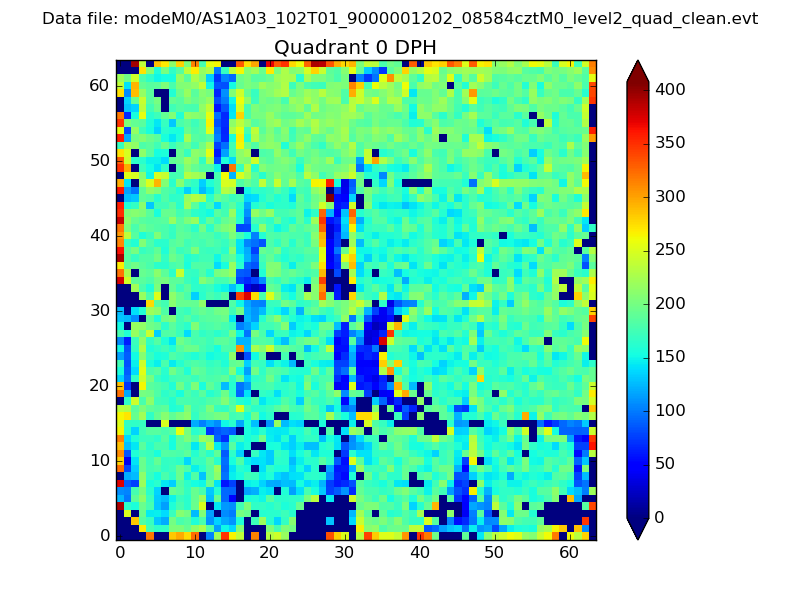 |
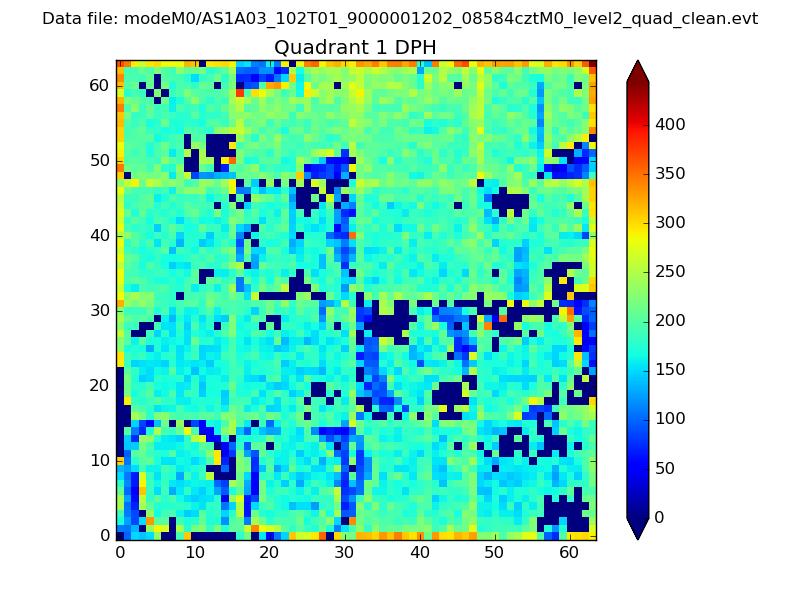 |
Quadrant B |
|---|---|---|---|
| Quadrant D | 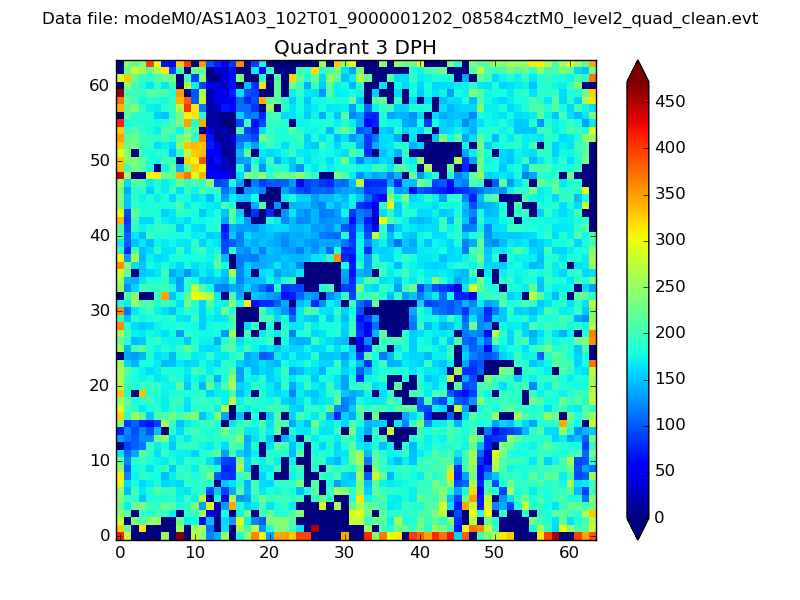 |
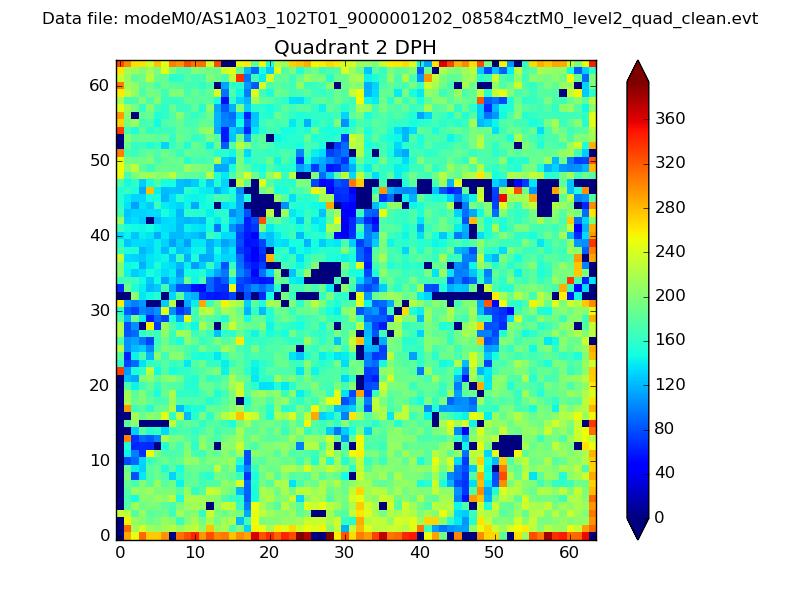 |
Quadrant C |
| Plot type | Count rate plots | Images |
|---|---|---|
| Comparison with Poisson distribution Blue bars denote a histogram of data divided into 1 sec bins. Red curve is a Poisson curve with rate = median count rate of data. |
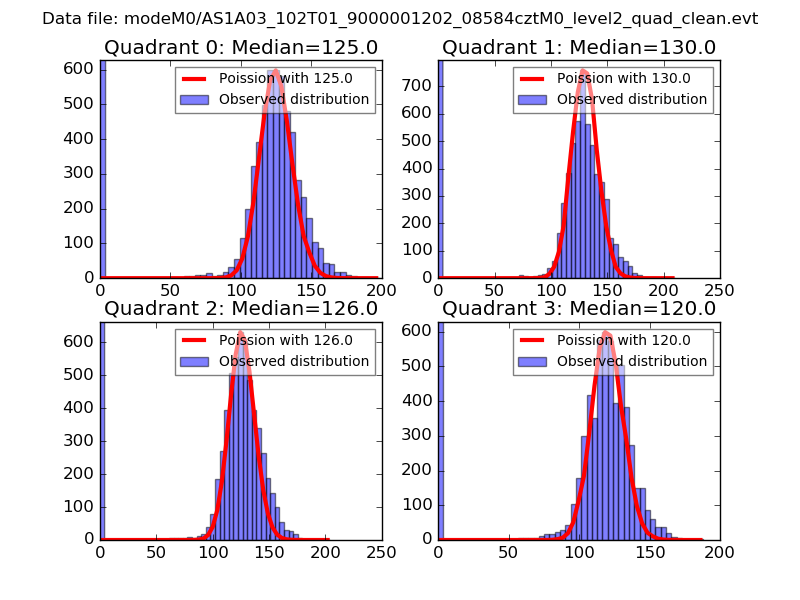 |
 |
| Quadrant-wise count rates Data is divided into 100 sec bins |
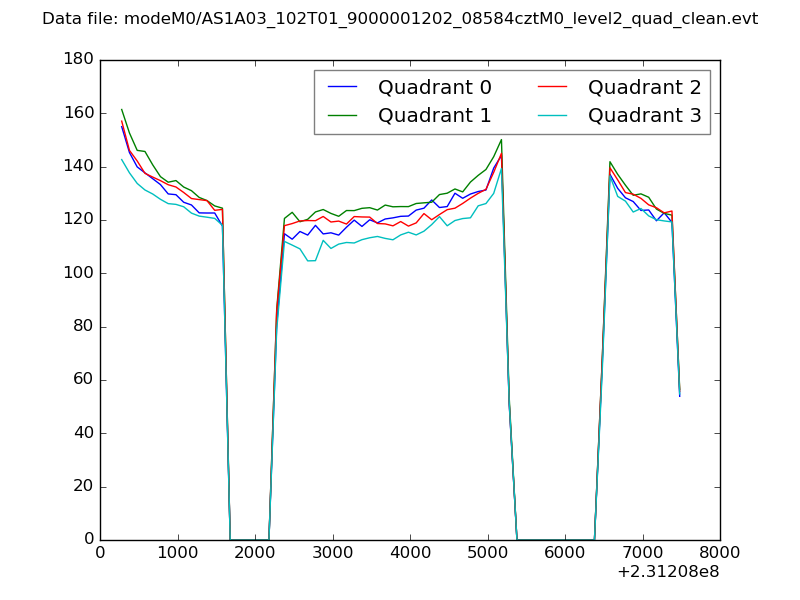 |
|
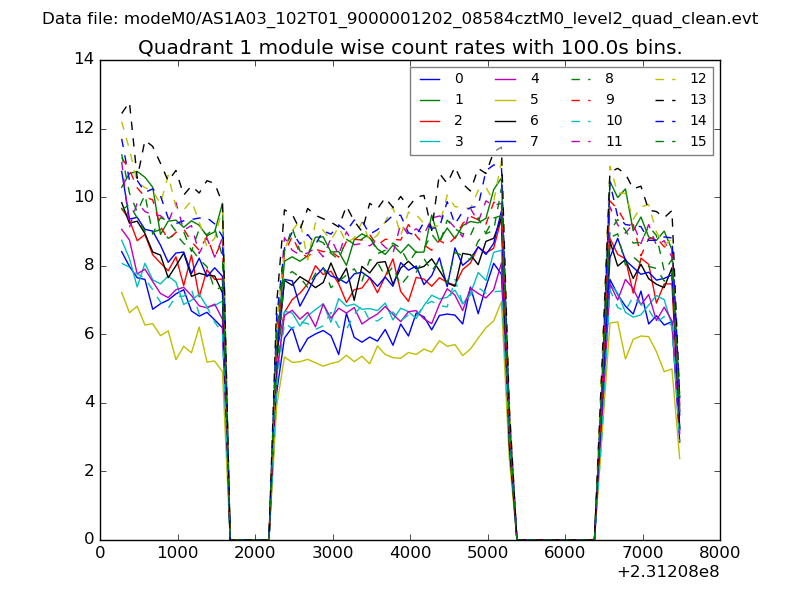
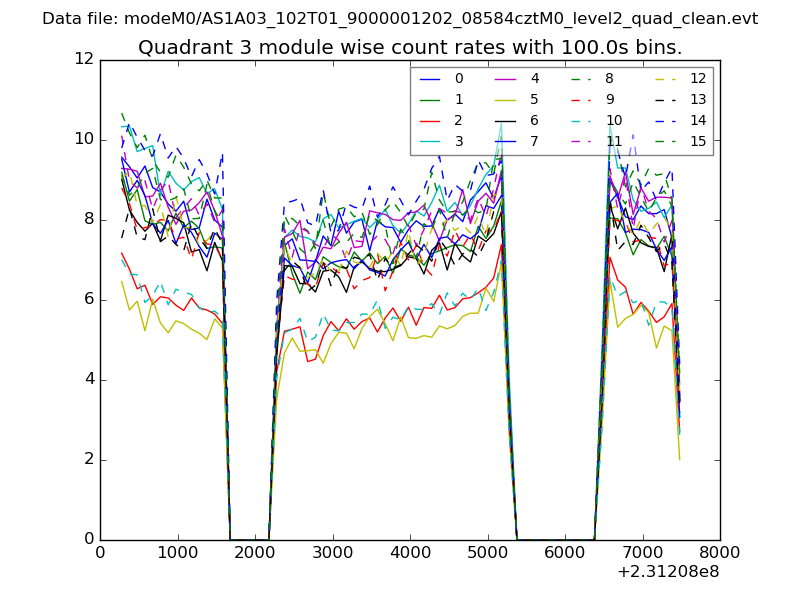
| Module-wise count rates for Quadrant A Data is divided into 100 sec bins |
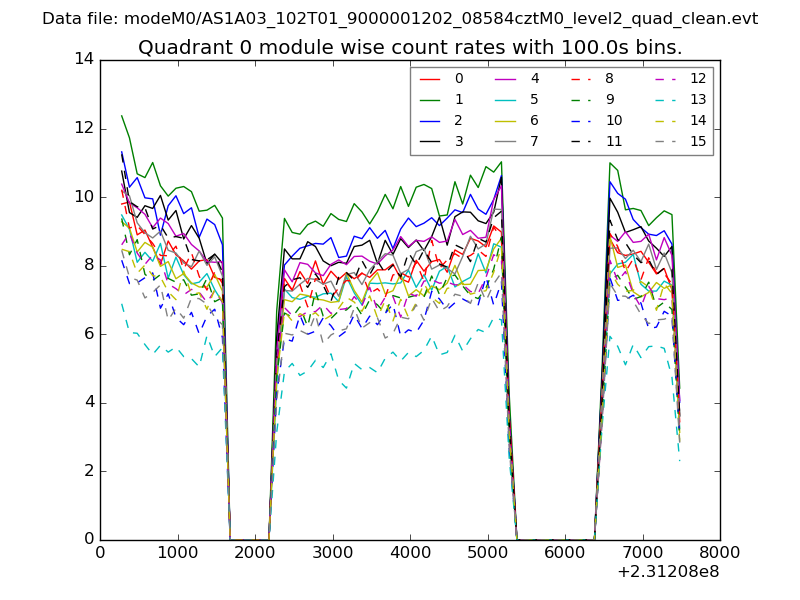 |
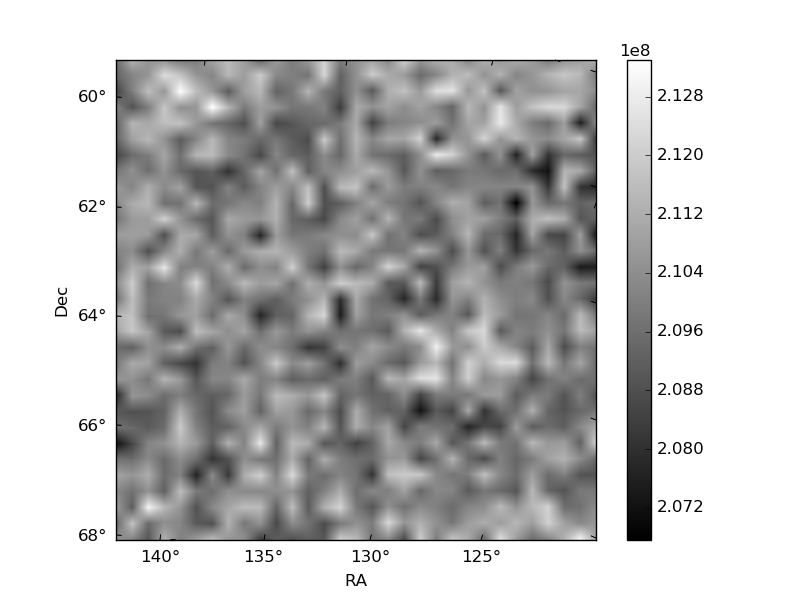 |
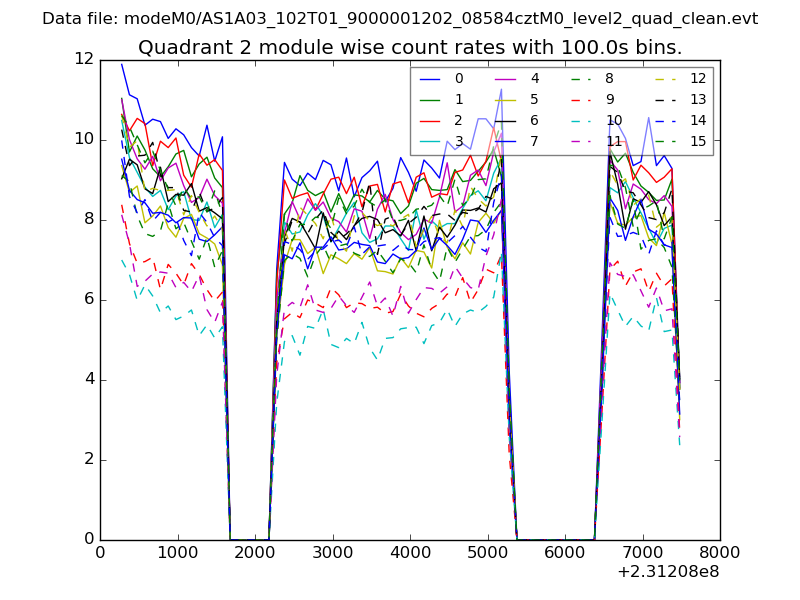
| Module-wise count rates for Quadrant B Data is divided into 100 sec bins |
 |
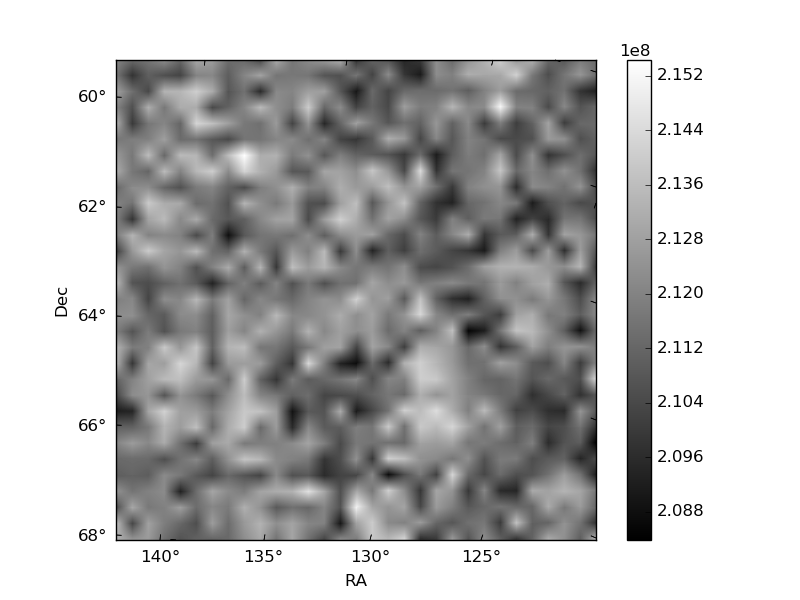 |
| Module-wise count rates for Quadrant C Data is divided into 100 sec bins |
 |
 |
| Module-wise count rates for Quadrant D Data is divided into 100 sec bins |
 |
 |
| Parameter | Plot |
|---|---|
| CZT HV Monitor | 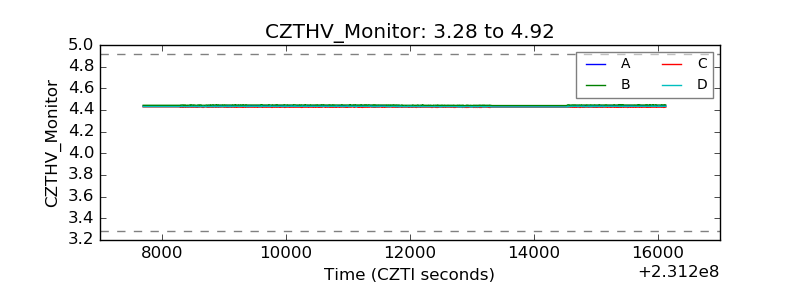 |
| D_VDD | 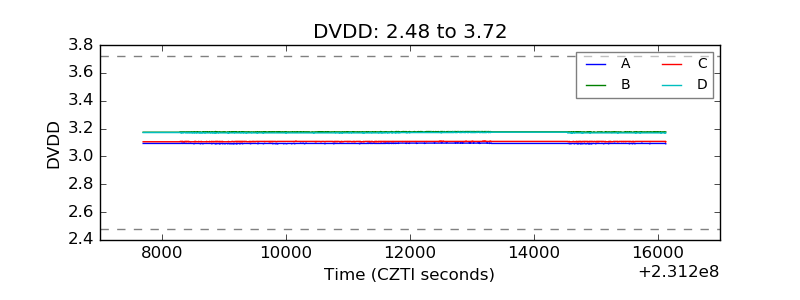 |
| Temperature 1 | 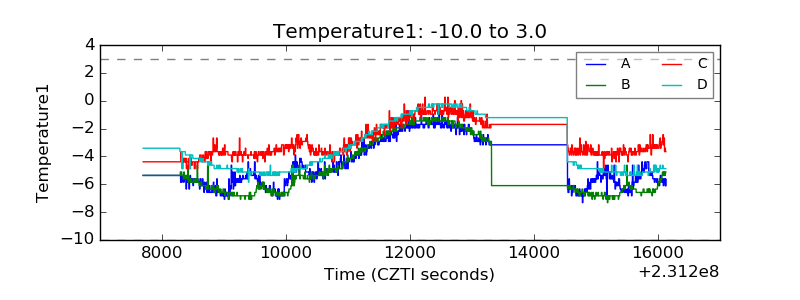 |
| Veto HV Monitor | 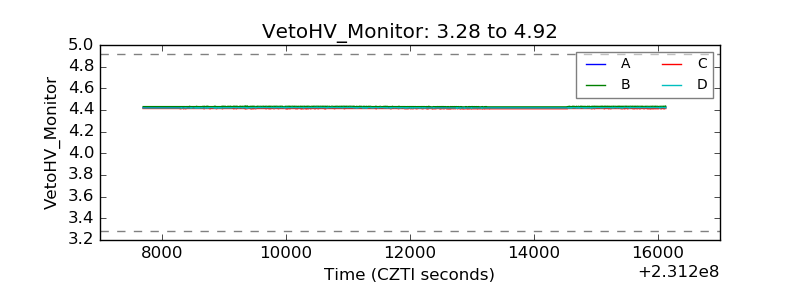 |
| Veto LLD | 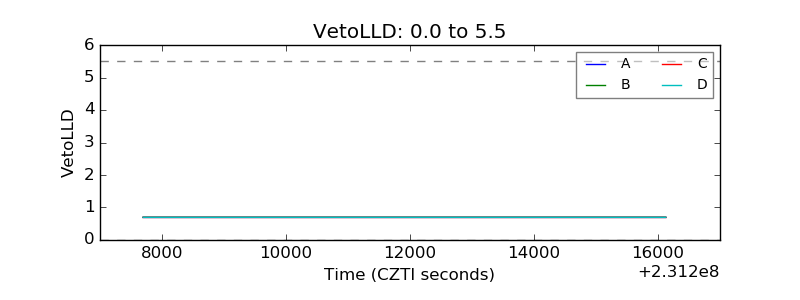 |
| Alpha Counter | 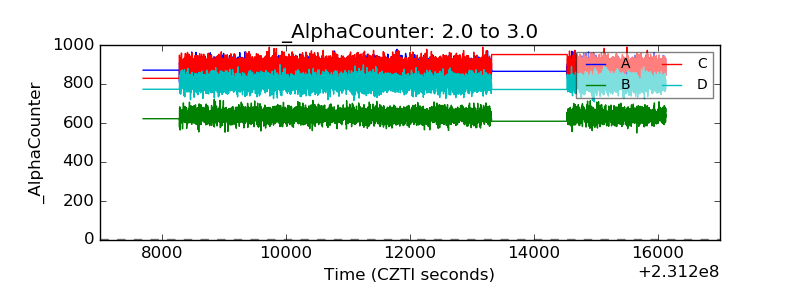 |
| _CPM_Rate | 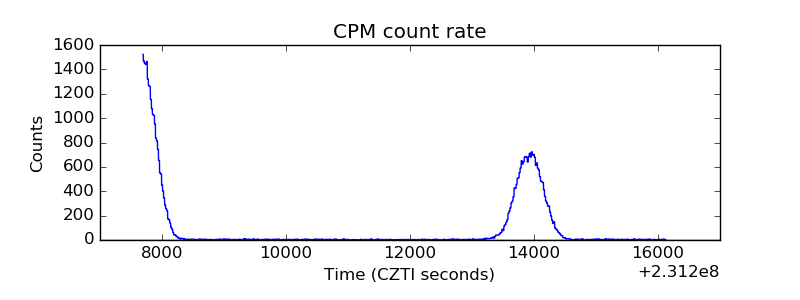 |
| CZT Counter | 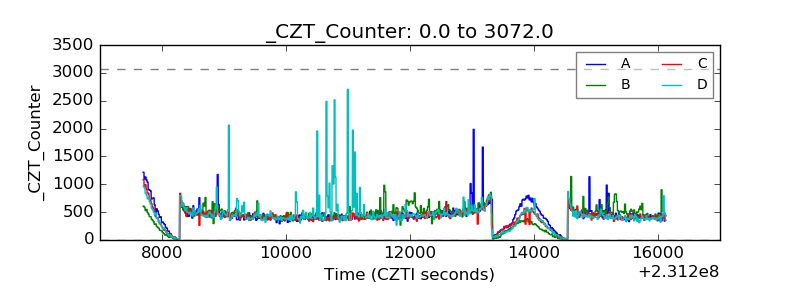 |
| +2.5 Volts monitor |  |
| +5 Volts monitor |  |
| _ROLL_ROT | 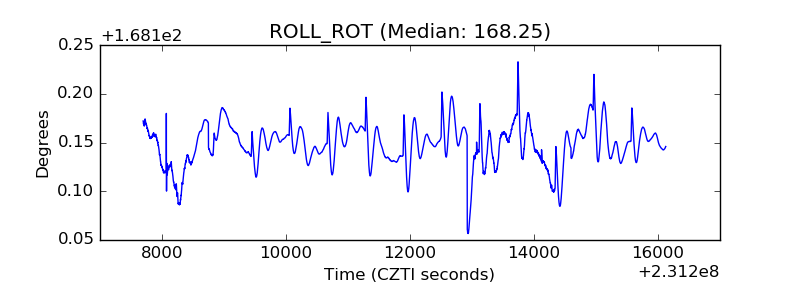 |
| _Roll_DEC | 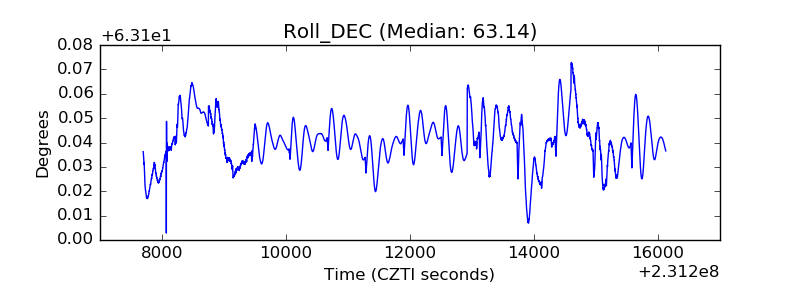 |
| _Roll_RA | 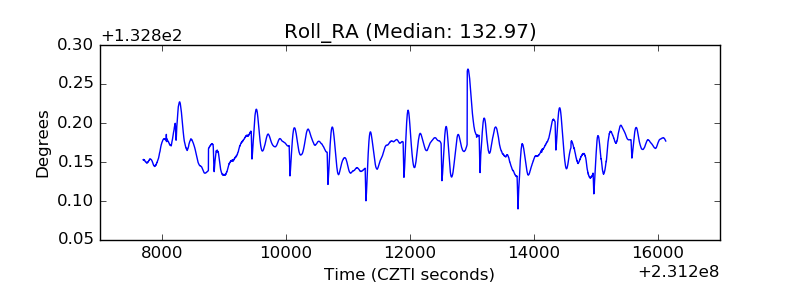 |
| Veto Counter | 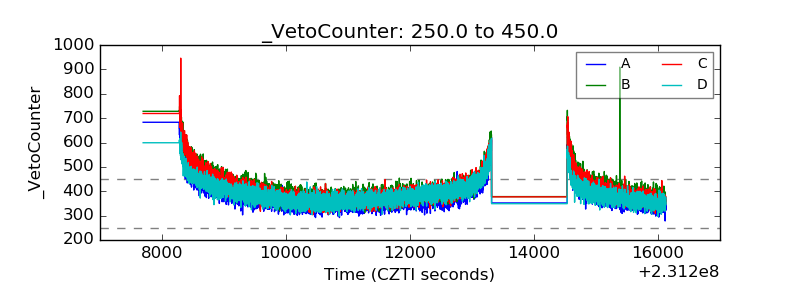 |