| Param | Original file | Final file |
|---|---|---|
| Filename | modeM0/AS1A03_102T01_9000001202_08585cztM0_level2.evt | modeM0/AS1A03_102T01_9000001202_08585cztM0_level2_quad_clean.evt |
| Size (bytes) | 402,672,960 | 94,250,880 |
| Size | 384.0 MB | 89.9 MB |
| Events in quadrant A | 2,832,120 | 603,760 |
| Events in quadrant B | 3,379,180 | 618,475 |
| Events in quadrant C | 2,710,399 | 609,921 |
| Events in quadrant D | 2,845,094 | 583,205 |
| Mode M9 | |||
|---|---|---|---|
| Quadrant | BADHDUFLAG | Total packets | Discarded packets |
| A | 0 | 10 | 0 |
| B | 0 | 10 | 0 |
| C | 0 | 10 | 0 |
| D | 0 | 10 | 0 |
| Mode SS | |||
|---|---|---|---|
| Quadrant | BADHDUFLAG | Total packets | Discarded packets |
| A | 0 | 128 | 0 |
| B | 0 | 128 | 0 |
| C | 0 | 128 | 0 |
| D | 0 | 128 | 0 |
| Mode M0 | |||
|---|---|---|---|
| Quadrant | BADHDUFLAG | Total packets | Discarded packets |
| A | 0 | 13012 | 2 |
| B | 0 | 14291 | 1 |
| C | 0 | 12780 | 1 |
| D | 0 | 13247 | 1 |
| Quadrant | Total seconds | Saturated seconds | Saturation percentage |
|---|---|---|---|
| A | 6288 | 48 | 0.763359% |
| B | 6288 | 146 | 2.321883% |
| C | 6288 | 33 | 0.524809% |
| D | 6288 | 44 | 0.699746% |
Noise dominated data is calculated using 1-second bins in cleaned event files. If a bin has >2000 counts, and if more than 50% of those come from <1% of pixels, then it is considered to be noise-dominated and hence unusable.
| Quadrant | # 1 sec bins | Bins with >0 counts | Bins with >2000 counts | High rate bins dominated by noise | Noise dominated (total time) | Noise dominated (detector-on time) | Marked lightcurve |
|---|---|---|---|---|---|---|---|
| A | 7253 | 6289 | 6 | 6 | 0.08% | 0.10% | 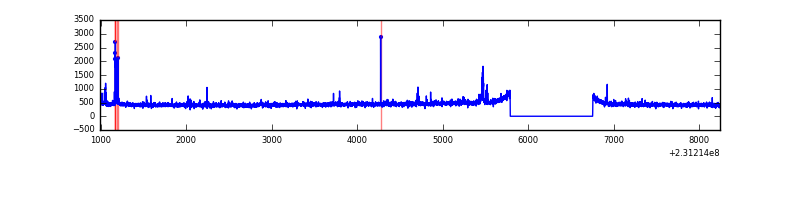 |
| B | 7253 | 6289 | 59 | 59 | 0.81% | 0.94% | 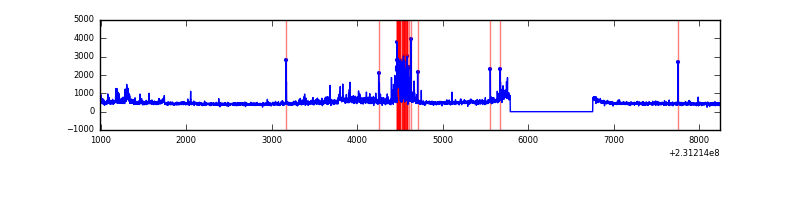 |
| C | 7253 | 6289 | 0 | 0 | 0.00% | 0.00% | 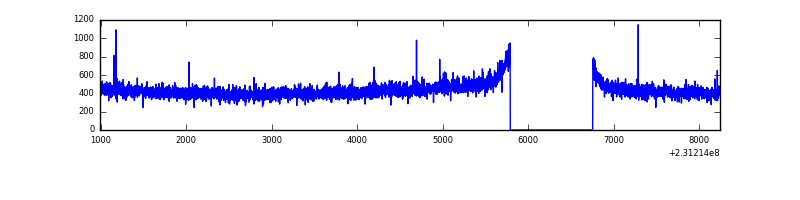 |
| D | 7253 | 6289 | 20 | 20 | 0.28% | 0.32% | 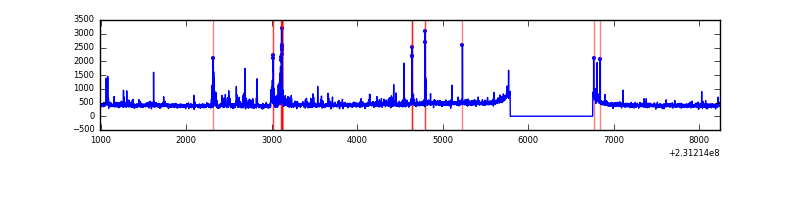 |
Top three noisy pixels from each quadrant. If the there are fewer than three noisy pixels in the level2.evt file, extra rows are filled as -1
| Pixel properties | Quadrant properties | ||||||
|---|---|---|---|---|---|---|---|
| Quadrant | DetID | PixID | Counts | Sigma | Mean | Median | Sigma |
| A | 15 | 223 | 61706 | 428.72 | 709 | 692 | 142.3 |
| A | 15 | 239 | 16677 | 112.32 | 709 | 692 | 142.3 |
| A | 13 | 248 | 8710 | 56.34 | 709 | 692 | 142.3 |
| B | 5 | 255 | 180737 | 1322.19 | 719 | 700 | 136.2 |
| B | 0 | 214 | 117199 | 855.57 | 719 | 700 | 136.2 |
| B | 10 | 252 | 107144 | 781.72 | 719 | 700 | 136.2 |
| C | 13 | 61 | 5377 | 29.38 | 694 | 694 | 159.4 |
| C | 8 | 222 | 3473 | 17.43 | 694 | 694 | 159.4 |
| C | 14 | 67 | 1916 | 7.67 | 694 | 694 | 159.4 |
| D | 7 | 71 | 101525 | 552.15 | 682 | 665 | 182.7 |
| D | 12 | 233 | 90279 | 490.58 | 682 | 665 | 182.7 |
| D | 2 | 234 | 20377 | 107.91 | 682 | 665 | 182.7 |
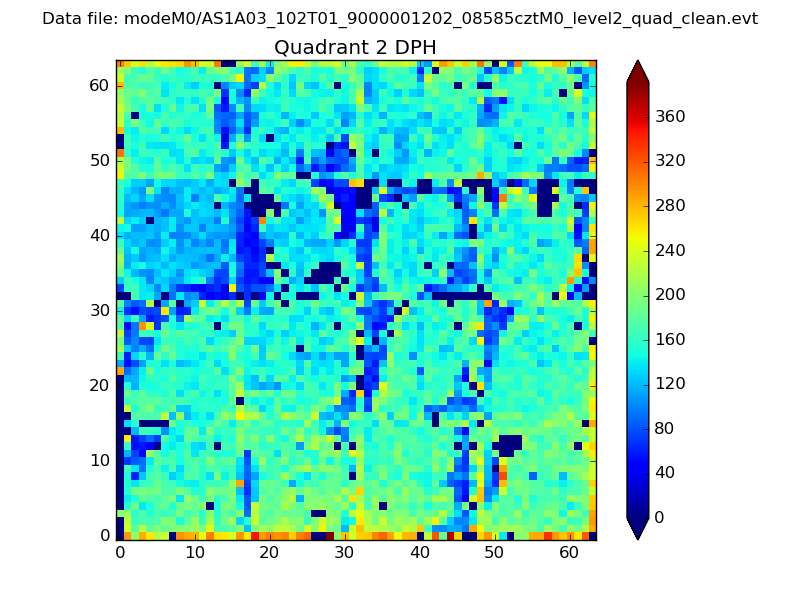
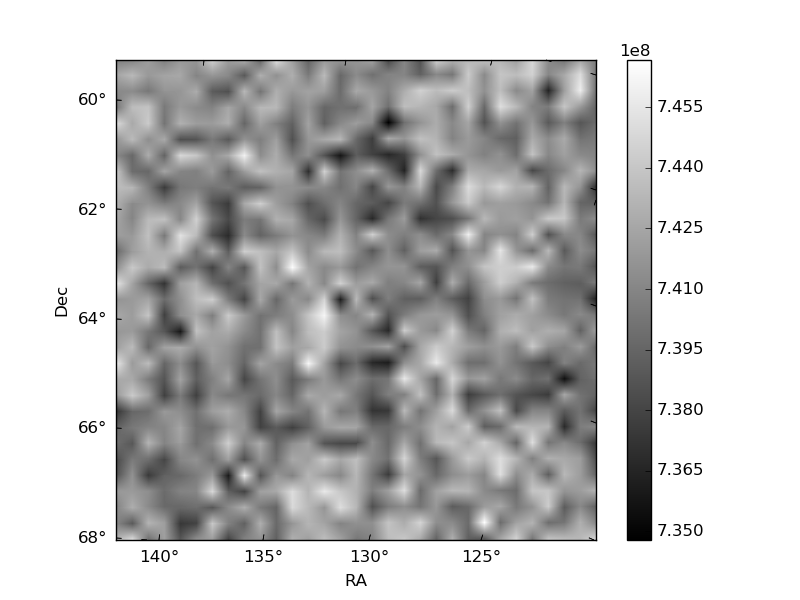
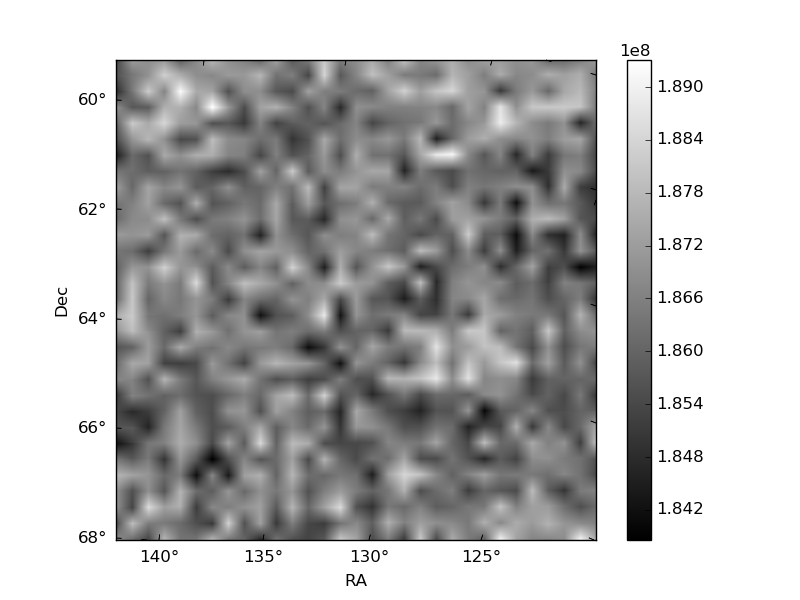
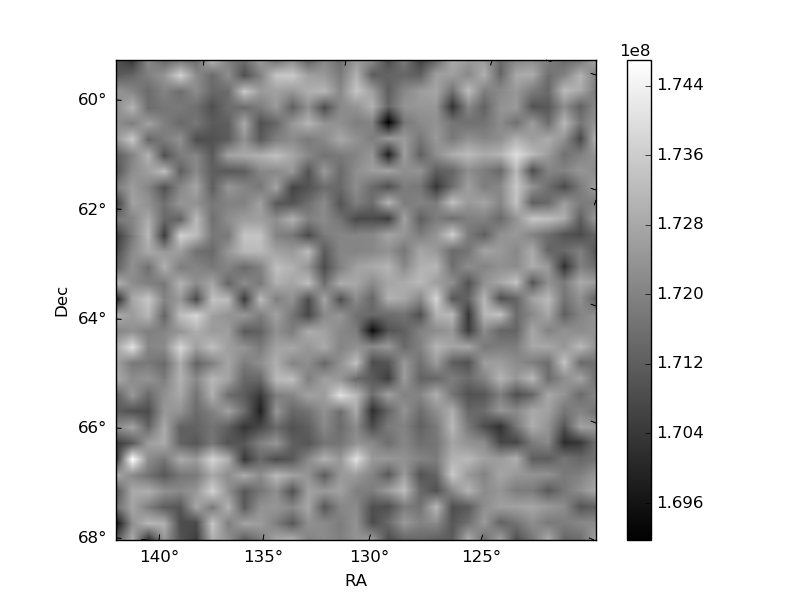
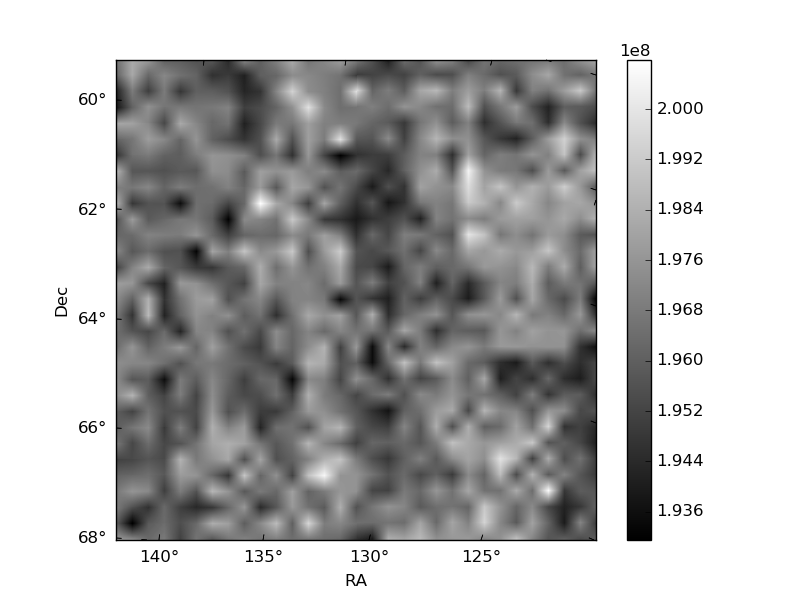
Histogram calculated using DETX and DETY for each event in the final _common_clean file
| Quadrant A | 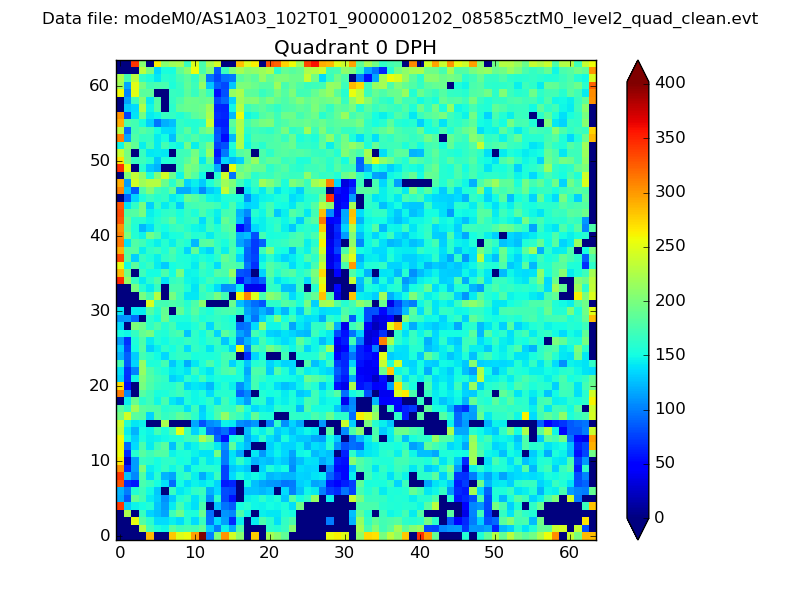 |
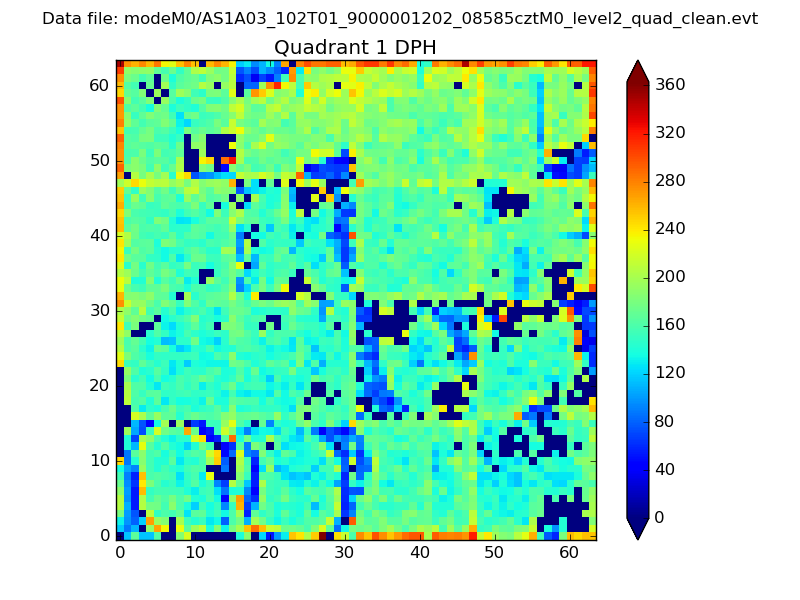 |
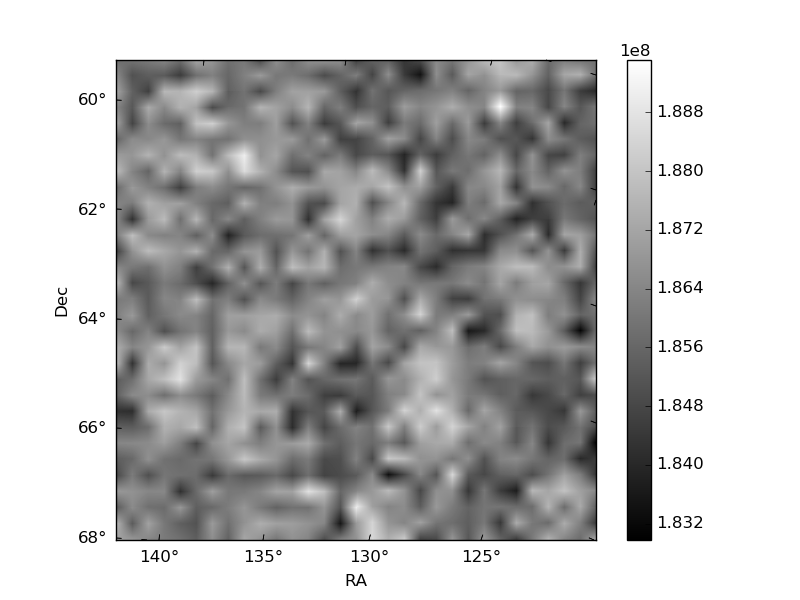
Quadrant B |
|---|---|---|---|
| Quadrant D | 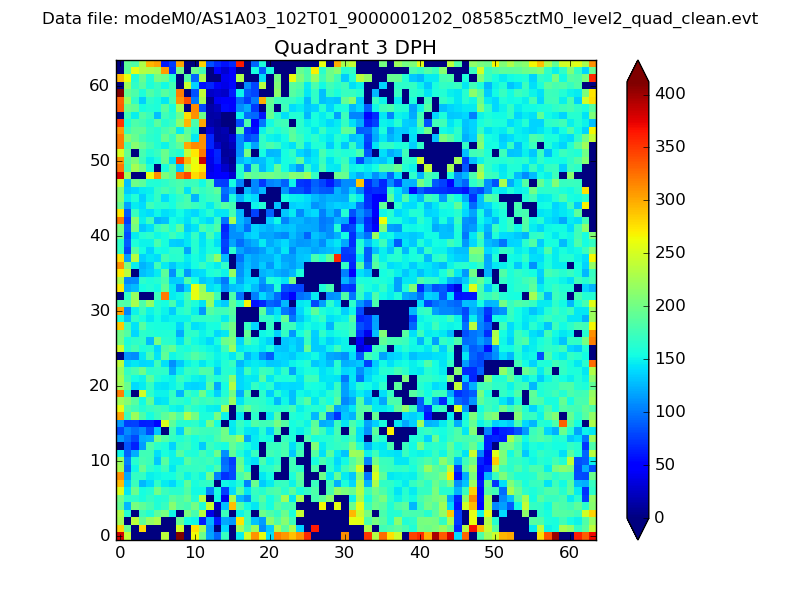 |
 |
Quadrant C |
| Plot type | Count rate plots | Images |
|---|---|---|
| Comparison with Poisson distribution Blue bars denote a histogram of data divided into 1 sec bins. Red curve is a Poisson curve with rate = median count rate of data. |
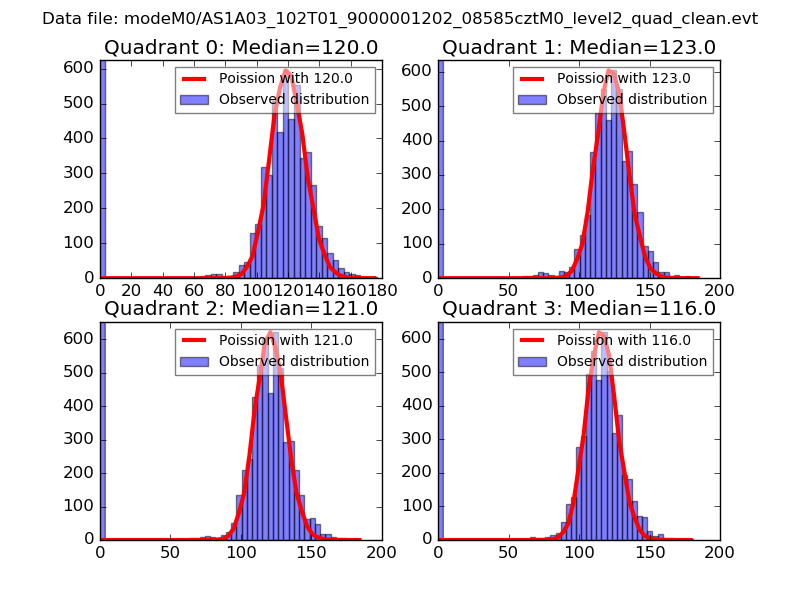 |
 |
| Quadrant-wise count rates Data is divided into 100 sec bins |
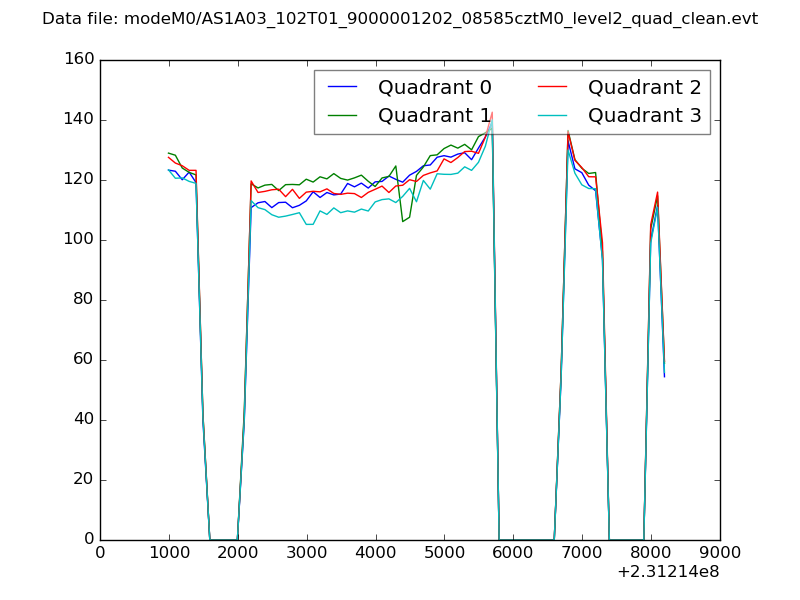 |
|
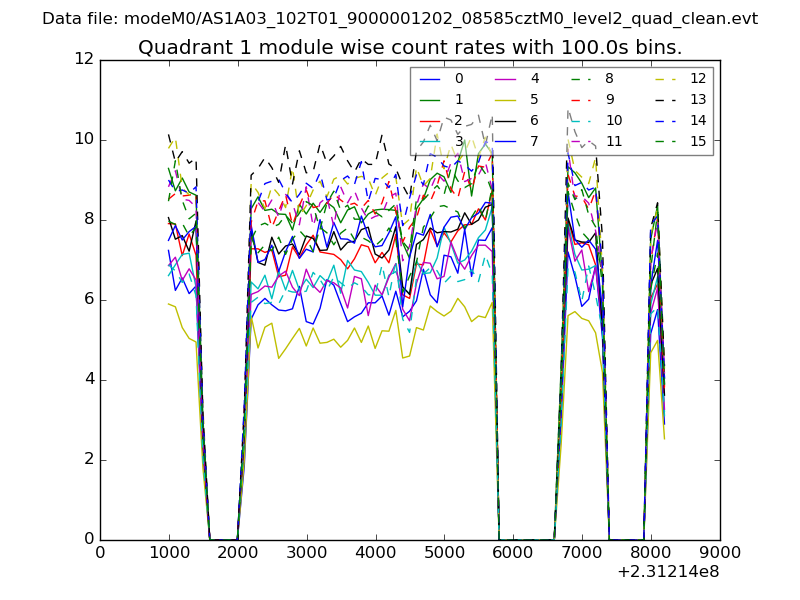
| Module-wise count rates for Quadrant A Data is divided into 100 sec bins |
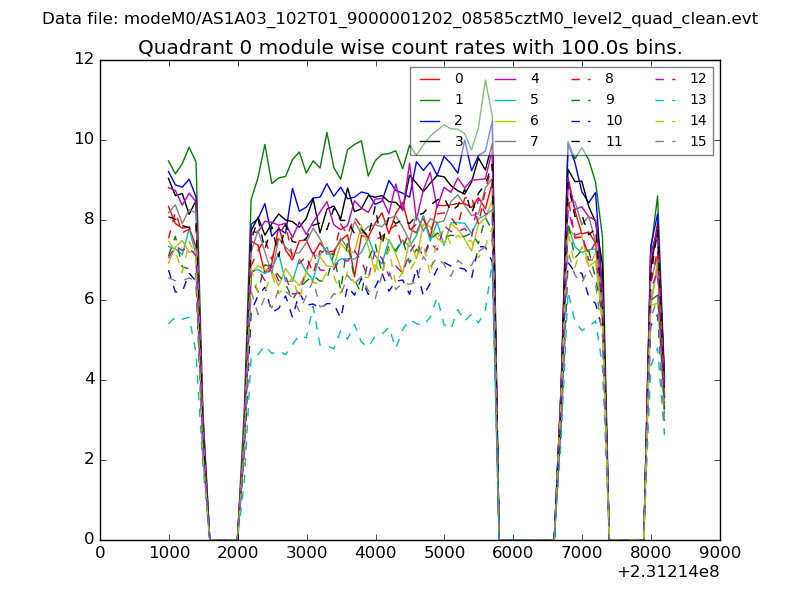 |
 |
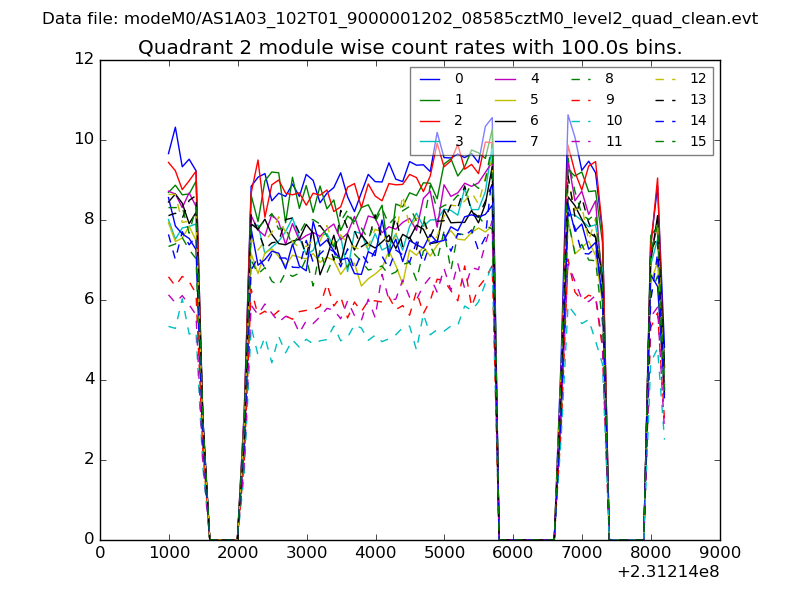
| Module-wise count rates for Quadrant B Data is divided into 100 sec bins |
 |
 |
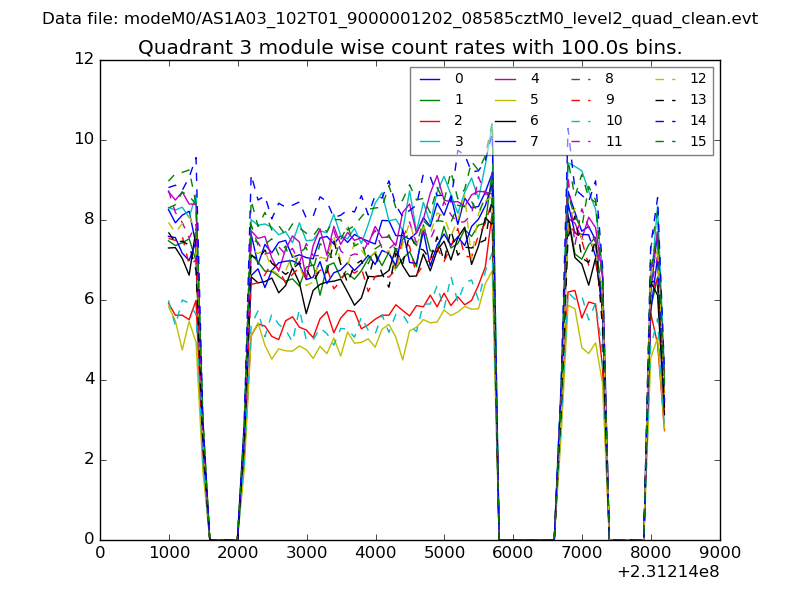
| Module-wise count rates for Quadrant C Data is divided into 100 sec bins |
 |
 |
| Module-wise count rates for Quadrant D Data is divided into 100 sec bins |
 |
 |
| Parameter | Plot |
|---|---|
| CZT HV Monitor | 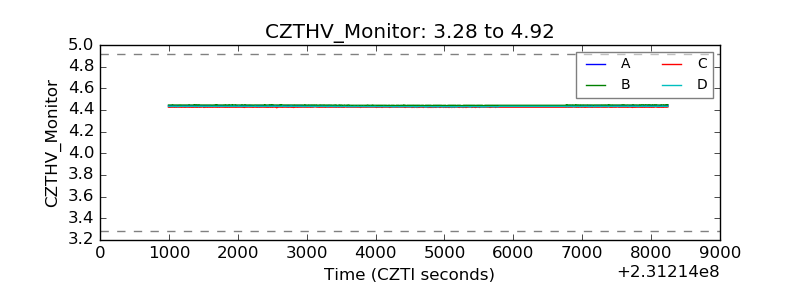 |
| D_VDD | 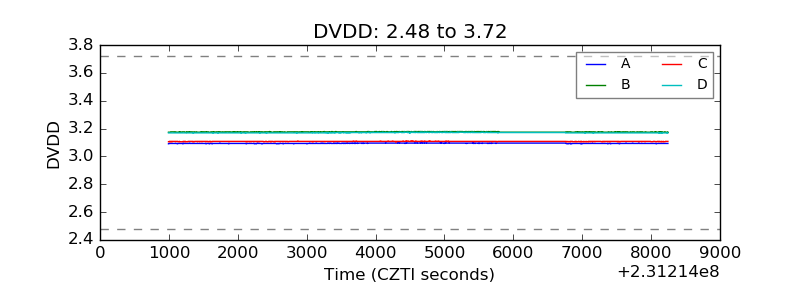 |
| Temperature 1 | 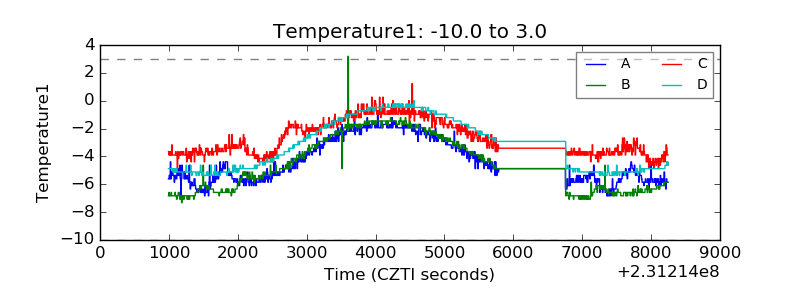 |
| Veto HV Monitor | 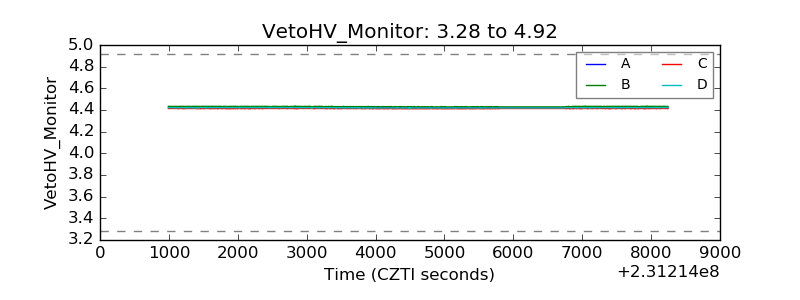 |
| Veto LLD | 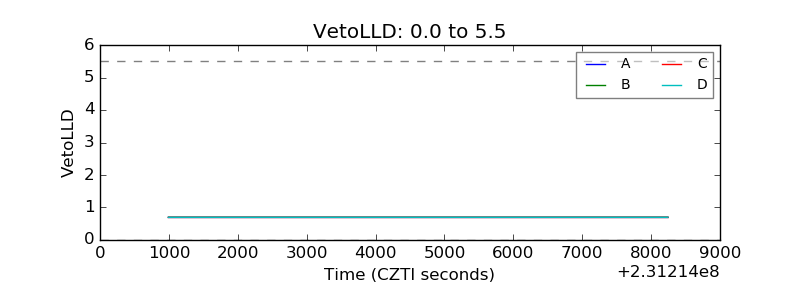 |
| Alpha Counter | 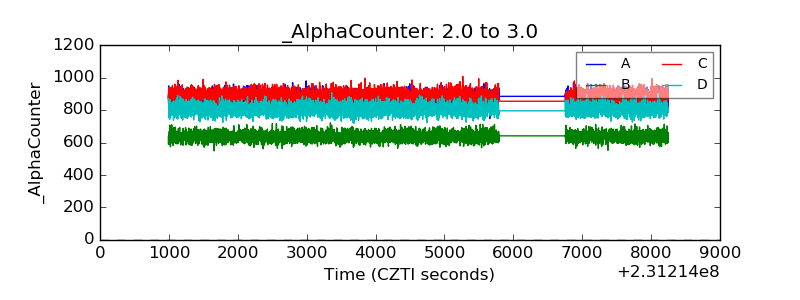 |
| _CPM_Rate | 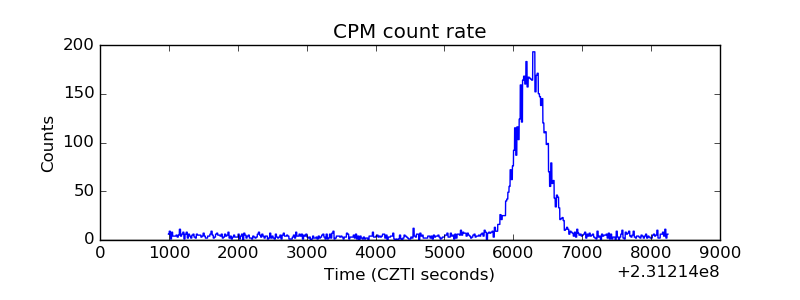 |
| CZT Counter | 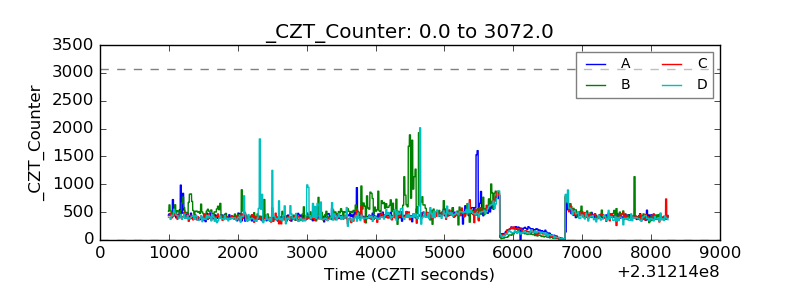 |
| +2.5 Volts monitor |  |
| +5 Volts monitor | 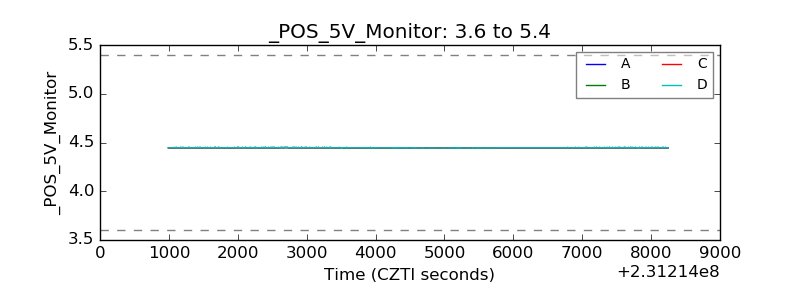 |
| _ROLL_ROT | 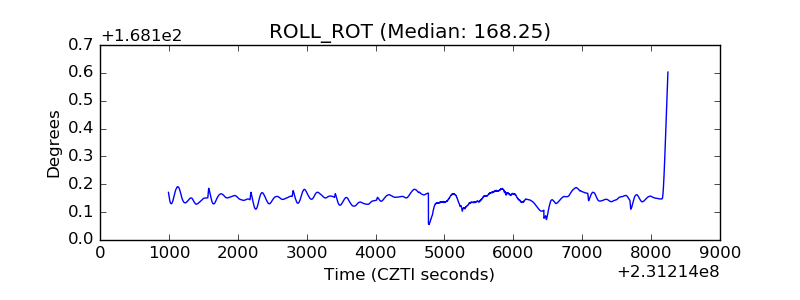 |
| _Roll_DEC | 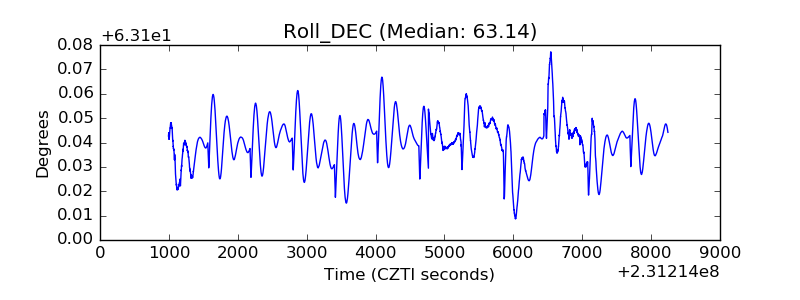 |
| _Roll_RA | 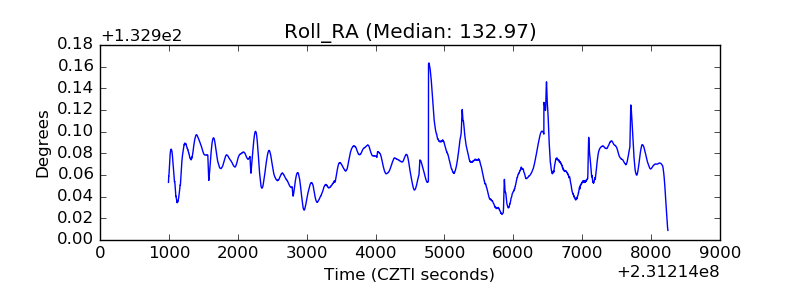 |
| Veto Counter | 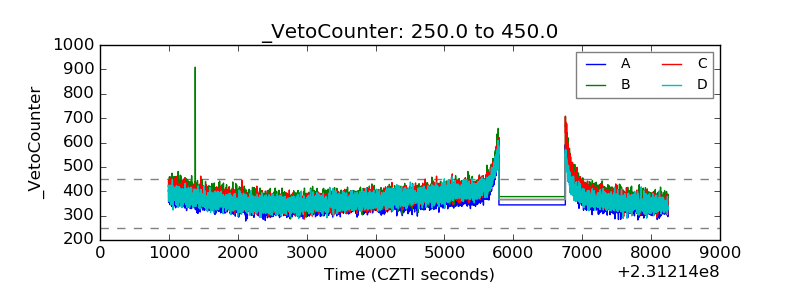 |