| Param | Original file | Final file |
|---|---|---|
| Filename | modeM0/AS1A03_102T01_9000001202_08591cztM0_level2.evt | modeM0/AS1A03_102T01_9000001202_08591cztM0_level2_quad_clean.evt |
| Size (bytes) | 919,690,560 | 233,821,440 |
| Size | 877.1 MB | 223.0 MB |
| Events in quadrant A | 6,911,651 | 1,518,832 |
| Events in quadrant B | 7,038,920 | 1,565,638 |
| Events in quadrant C | 6,273,511 | 1,522,180 |
| Events in quadrant D | 6,638,000 | 1,466,388 |
| Mode M9 | |||
|---|---|---|---|
| Quadrant | BADHDUFLAG | Total packets | Discarded packets |
| A | 0 | 10 | 0 |
| B | 0 | 10 | 0 |
| C | 0 | 10 | 0 |
| D | 0 | 10 | 0 |
| Mode SS | |||
|---|---|---|---|
| Quadrant | BADHDUFLAG | Total packets | Discarded packets |
| A | 0 | 296 | 0 |
| B | 0 | 296 | 0 |
| C | 0 | 296 | 0 |
| D | 0 | 296 | 0 |
| Mode M0 | |||
|---|---|---|---|
| Quadrant | BADHDUFLAG | Total packets | Discarded packets |
| A | 0 | 31022 | 5 |
| B | 0 | 30758 | 7 |
| C | 0 | 29614 | 4 |
| D | 0 | 30798 | 6 |
| Quadrant | Total seconds | Saturated seconds | Saturation percentage |
|---|---|---|---|
| A | 14622 | 249 | 1.702913% |
| B | 14621 | 122 | 0.834416% |
| C | 14622 | 74 | 0.506087% |
| D | 14621 | 182 | 1.244785% |
Noise dominated data is calculated using 1-second bins in cleaned event files. If a bin has >2000 counts, and if more than 50% of those come from <1% of pixels, then it is considered to be noise-dominated and hence unusable.
| Quadrant | # 1 sec bins | Bins with >0 counts | Bins with >2000 counts | High rate bins dominated by noise | Noise dominated (total time) | Noise dominated (detector-on time) | Marked lightcurve |
|---|---|---|---|---|---|---|---|
| A | 15608 | 14624 | 110 | 110 | 0.70% | 0.75% | 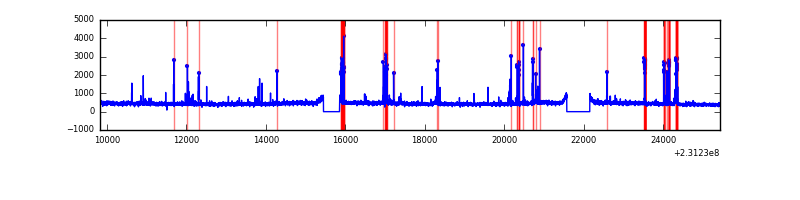 |
| B | 15608 | 14625 | 25 | 25 | 0.16% | 0.17% | 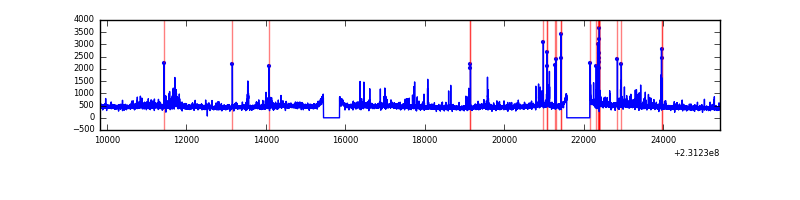 |
| C | 15608 | 14625 | 3 | 3 | 0.02% | 0.02% | 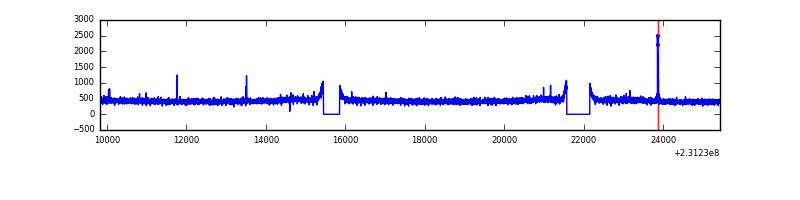 |
| D | 15608 | 14624 | 67 | 67 | 0.43% | 0.46% | 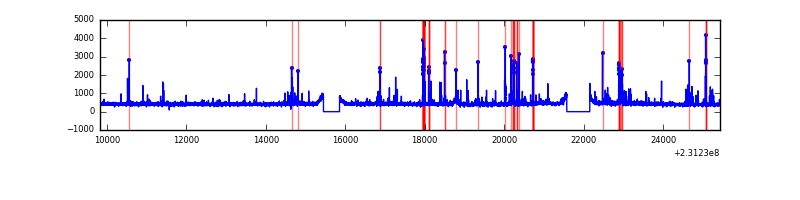 |
Top three noisy pixels from each quadrant. If the there are fewer than three noisy pixels in the level2.evt file, extra rows are filled as -1
| Pixel properties | Quadrant properties | ||||||
|---|---|---|---|---|---|---|---|
| Quadrant | DetID | PixID | Counts | Sigma | Mean | Median | Sigma |
| A | 15 | 223 | 181165 | 545.34 | 1629 | 1592 | 329.3 |
| A | 13 | 248 | 166234 | 500.0 | 1629 | 1592 | 329.3 |
| A | 5 | 16 | 78960 | 234.96 | 1629 | 1592 | 329.3 |
| B | 0 | 214 | 233671 | 738.55 | 1652 | 1608 | 314.2 |
| B | 0 | 219 | 112603 | 353.25 | 1652 | 1608 | 314.2 |
| B | 4 | 80 | 91295 | 285.43 | 1652 | 1608 | 314.2 |
| C | 14 | 234 | 20125 | 50.09 | 1597 | 1601 | 369.8 |
| C | 13 | 61 | 12349 | 29.06 | 1597 | 1601 | 369.8 |
| C | 8 | 222 | 11782 | 27.53 | 1597 | 1601 | 369.8 |
| D | 10 | 253 | 141363 | 361.99 | 1597 | 1544 | 386.2 |
| D | 1 | 52 | 111262 | 284.06 | 1597 | 1544 | 386.2 |
| D | 12 | 233 | 96380 | 245.53 | 1597 | 1544 | 386.2 |
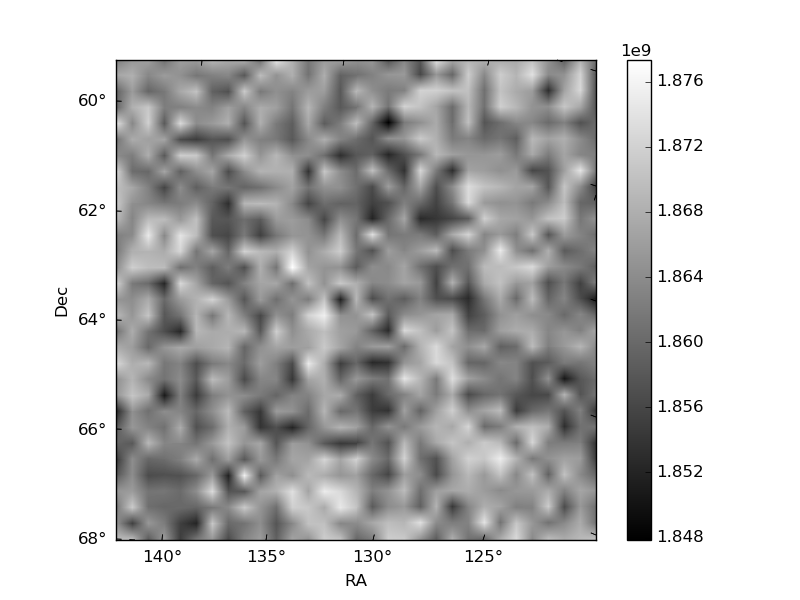
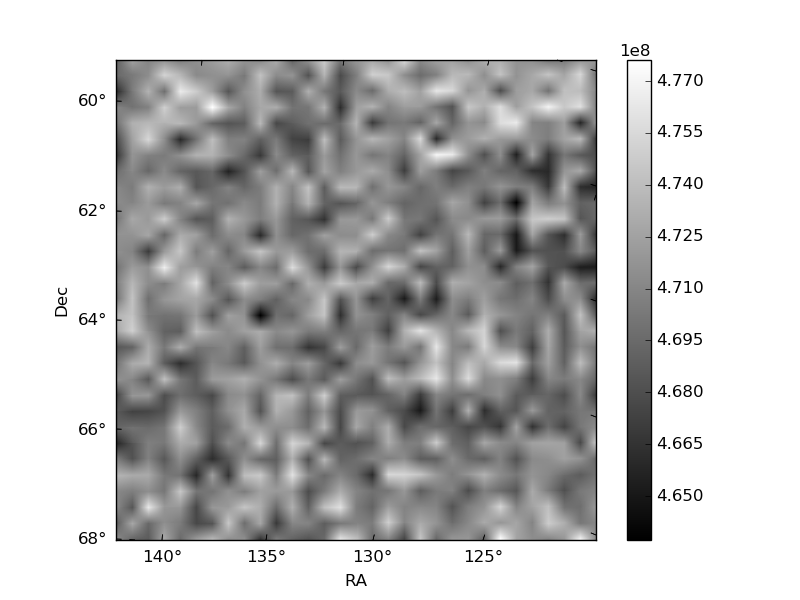
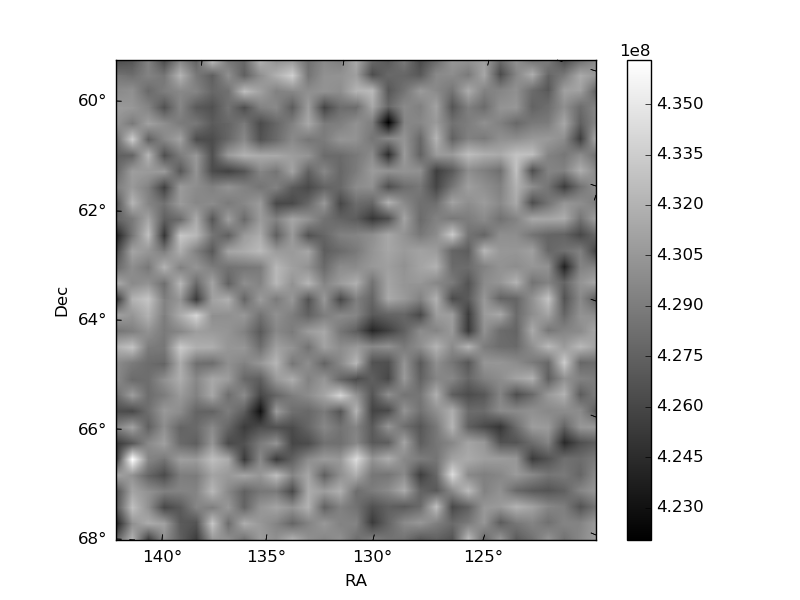
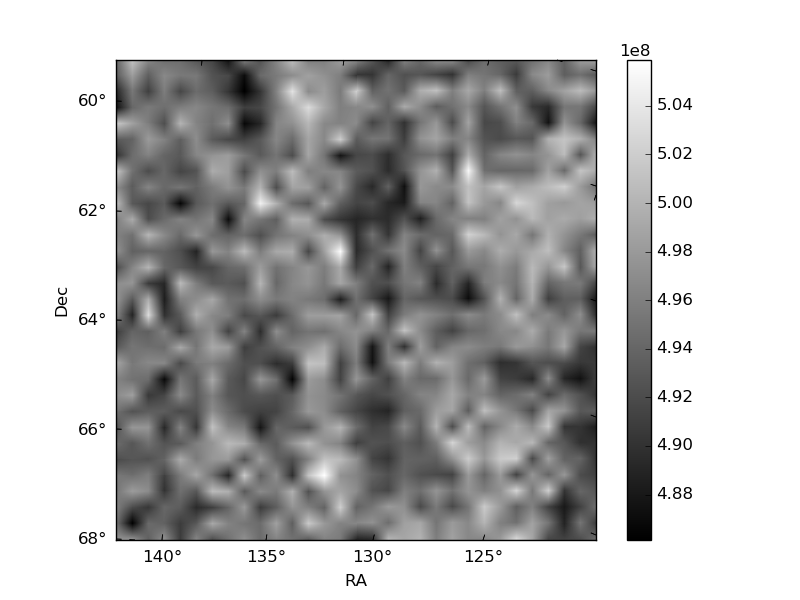
Histogram calculated using DETX and DETY for each event in the final _common_clean file
| Quadrant A | 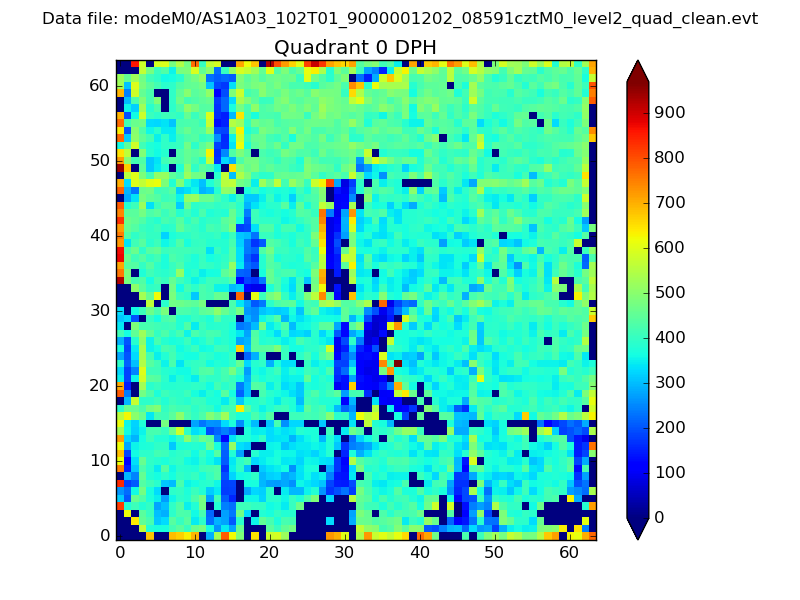 |
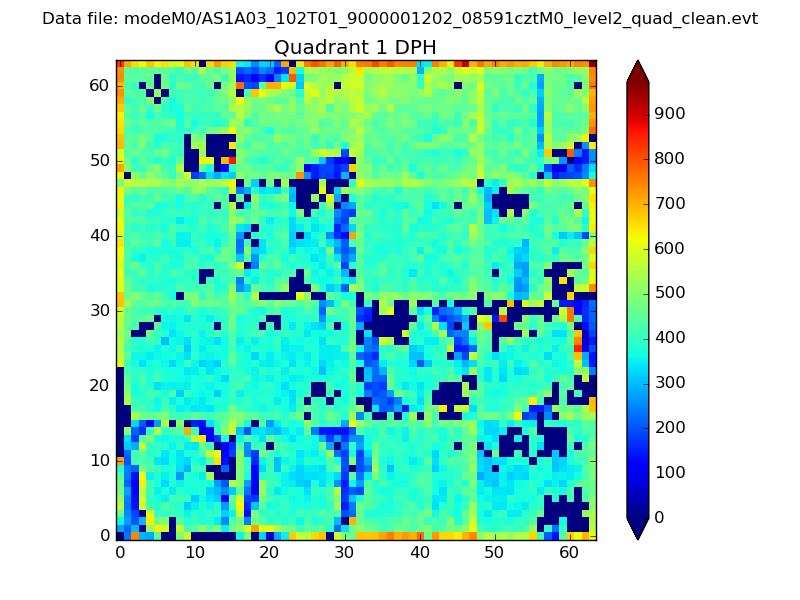 |
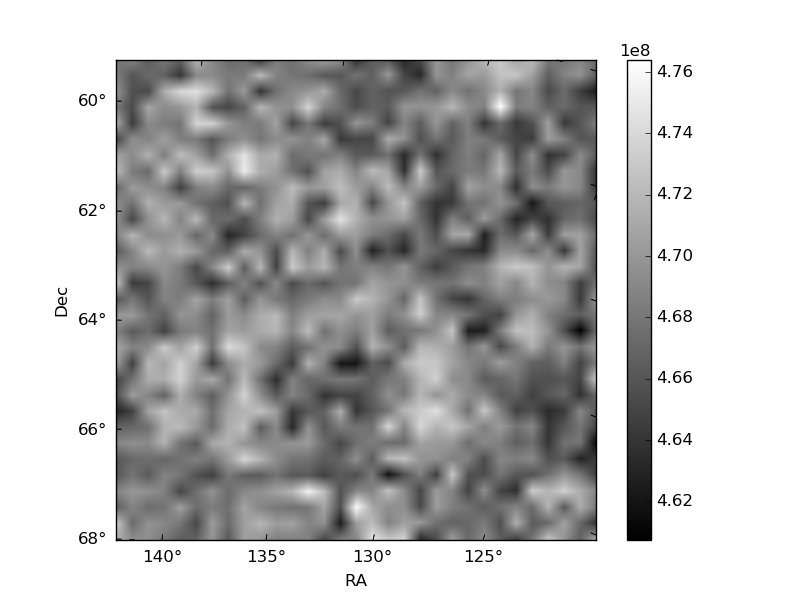
Quadrant B |
|---|---|---|---|
| Quadrant D | 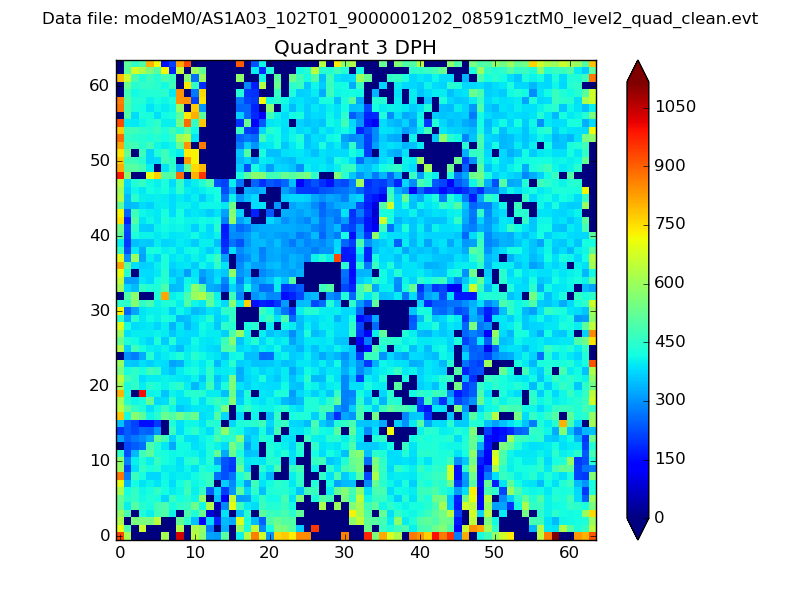 |
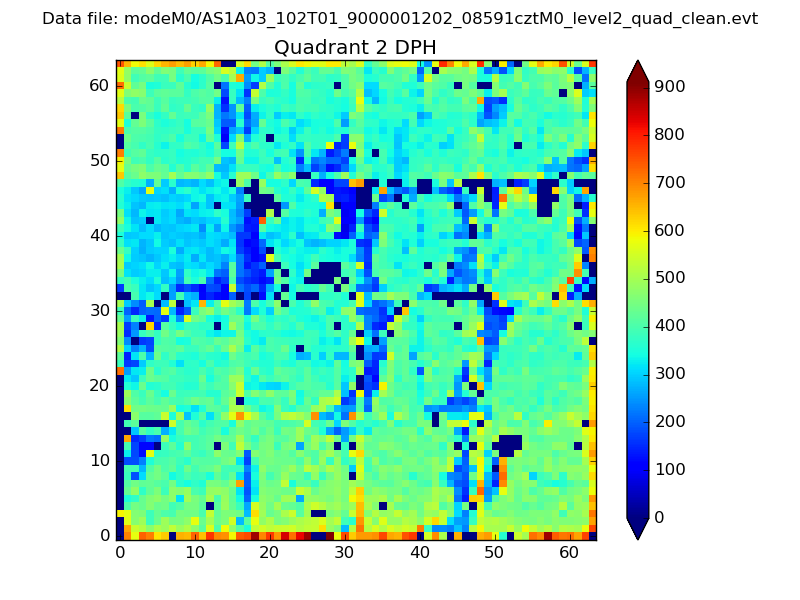 |
Quadrant C |
| Plot type | Count rate plots | Images |
|---|---|---|
| Comparison with Poisson distribution Blue bars denote a histogram of data divided into 1 sec bins. Red curve is a Poisson curve with rate = median count rate of data. |
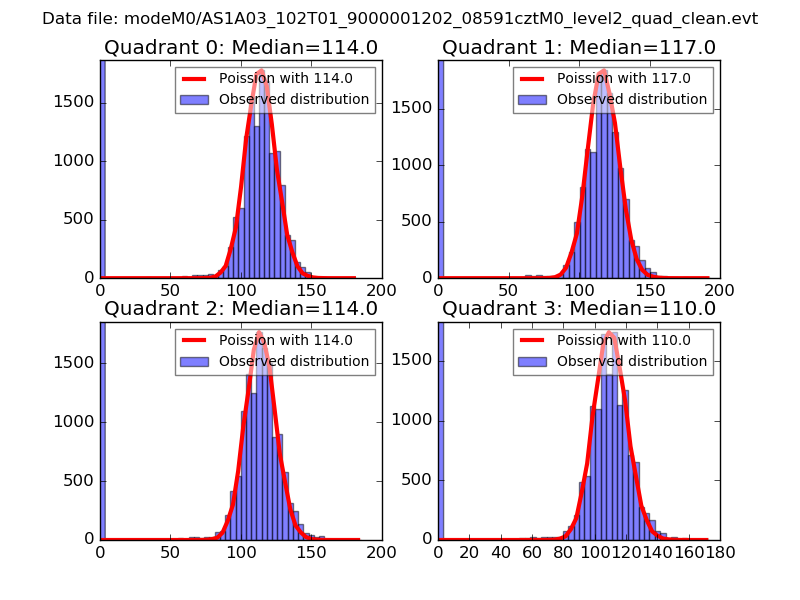 |
 |
| Quadrant-wise count rates Data is divided into 100 sec bins |
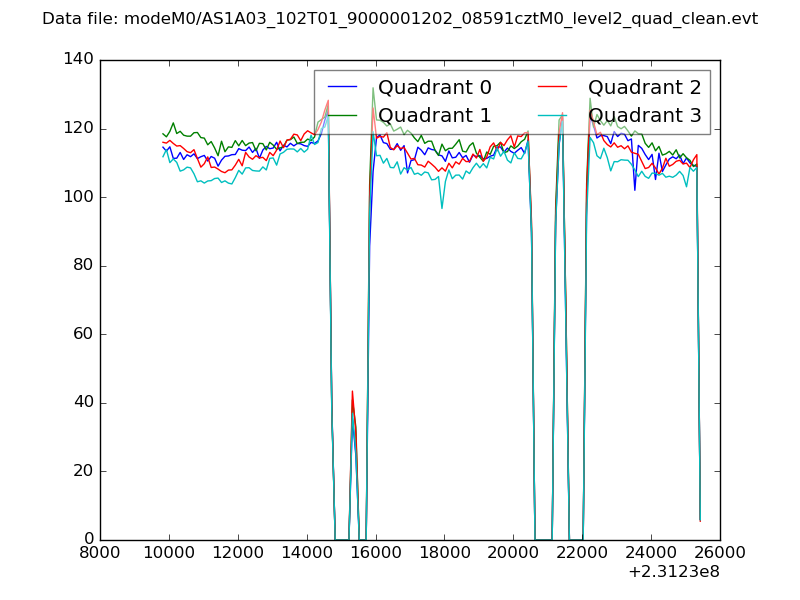 |
|
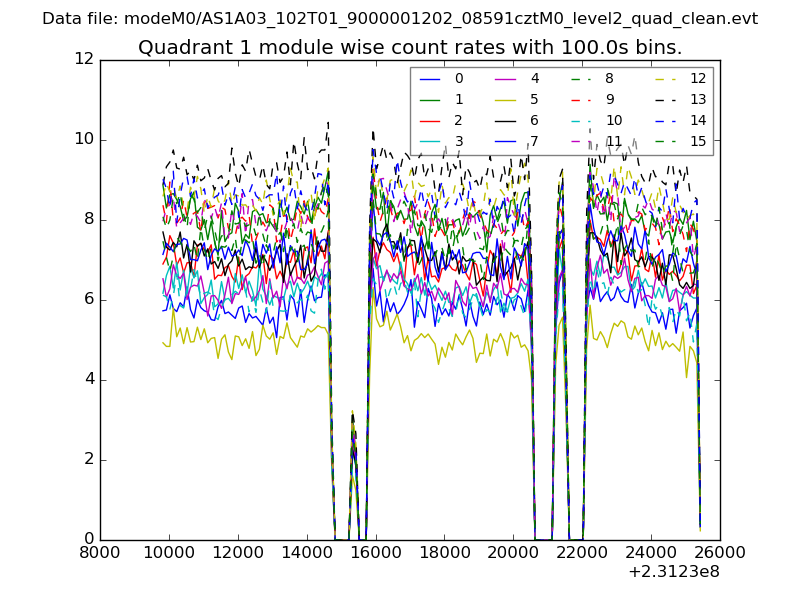
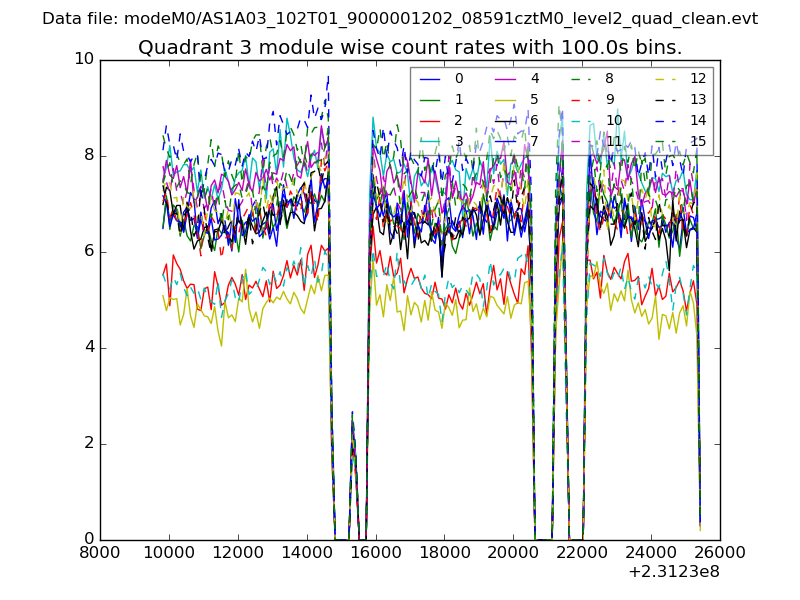
| Module-wise count rates for Quadrant A Data is divided into 100 sec bins |
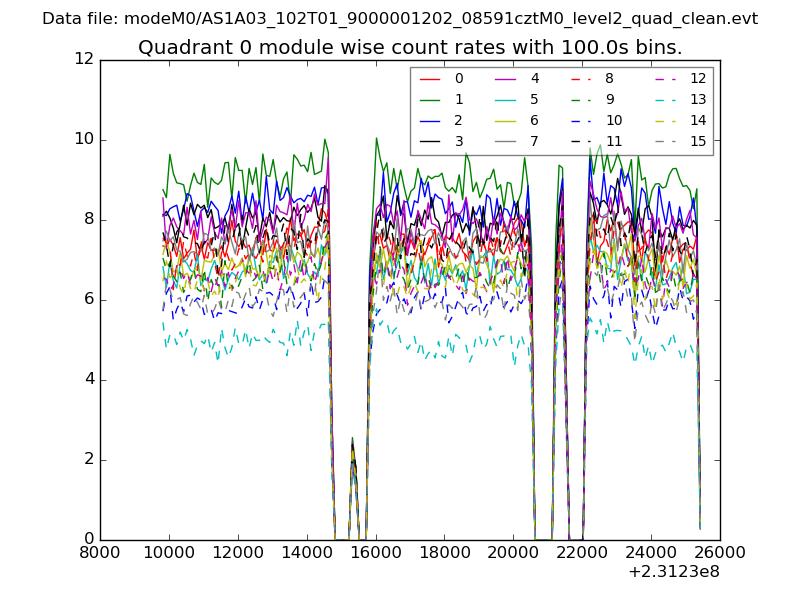 |
 |
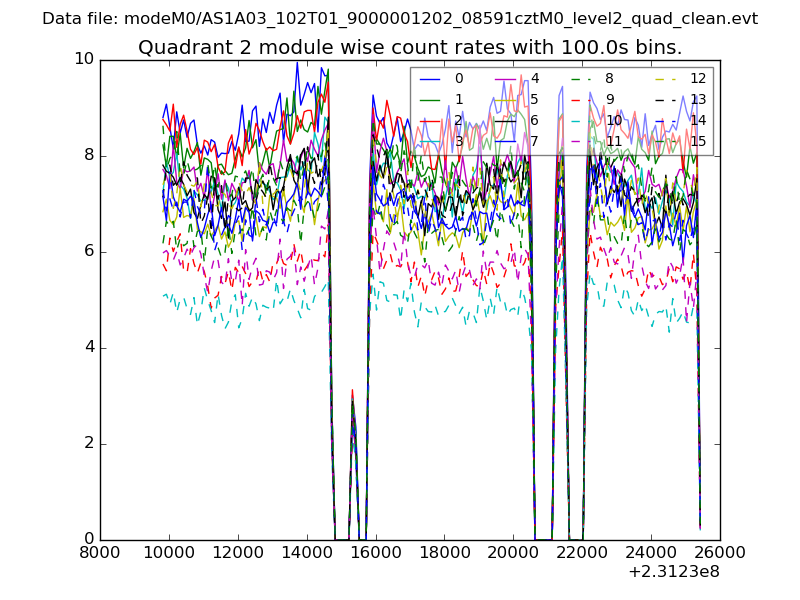
| Module-wise count rates for Quadrant B Data is divided into 100 sec bins |
 |
 |
| Module-wise count rates for Quadrant C Data is divided into 100 sec bins |
 |
 |
| Module-wise count rates for Quadrant D Data is divided into 100 sec bins |
 |
 |
| Parameter | Plot |
|---|---|
| CZT HV Monitor | 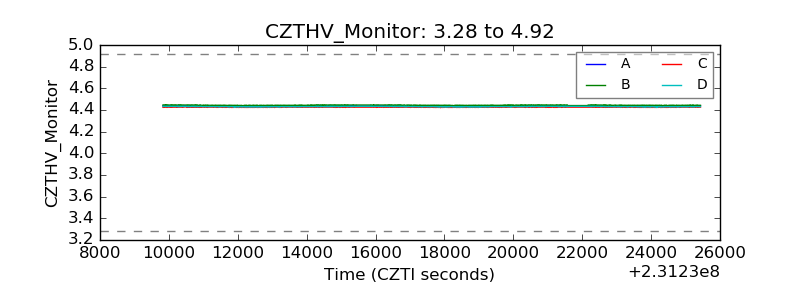 |
| D_VDD |  |
| Temperature 1 | 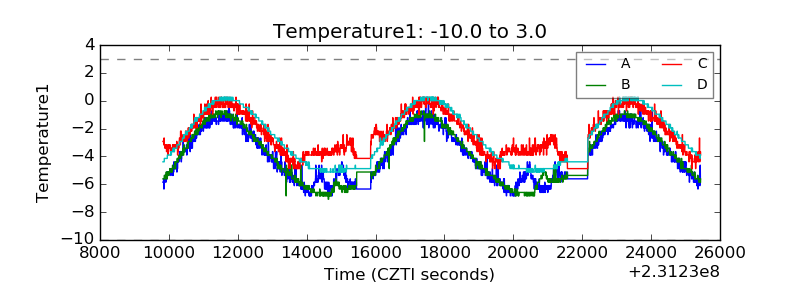 |
| Veto HV Monitor | 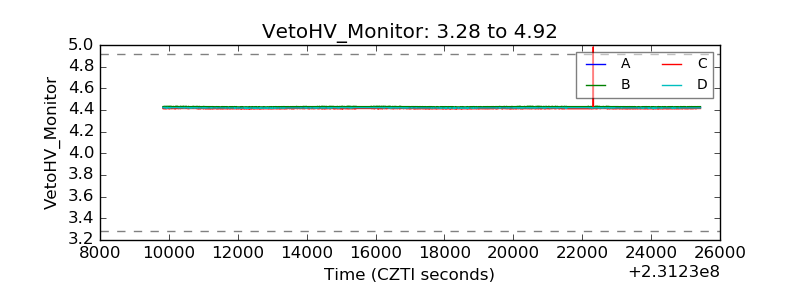 |
| Veto LLD | 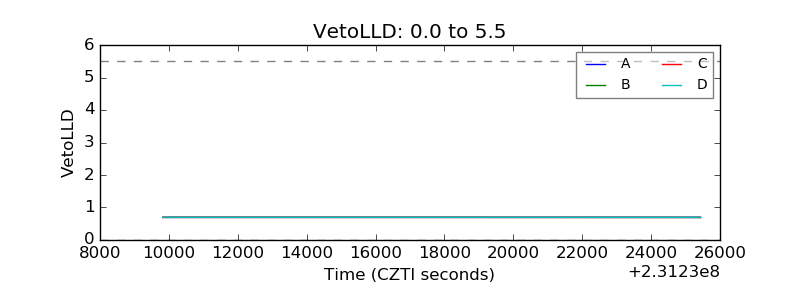 |
| Alpha Counter | 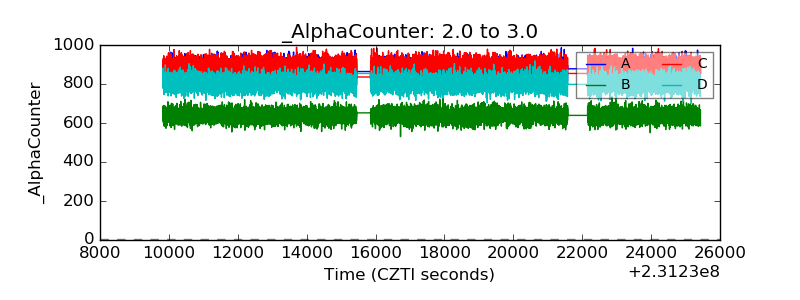 |
| _CPM_Rate | 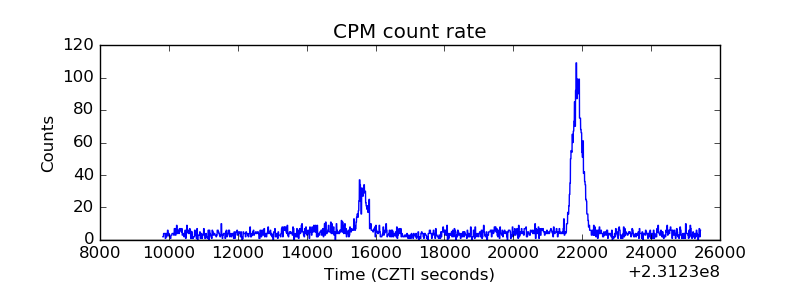 |
| CZT Counter | 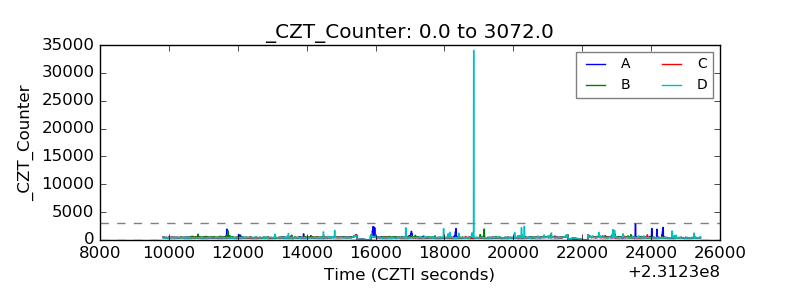 |
| +2.5 Volts monitor |  |
| +5 Volts monitor |  |
| _ROLL_ROT | 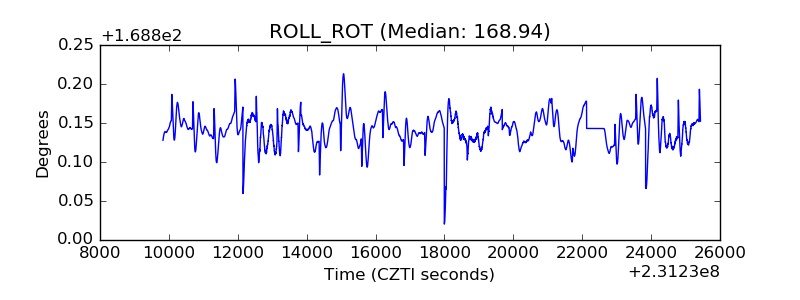 |
| _Roll_DEC | 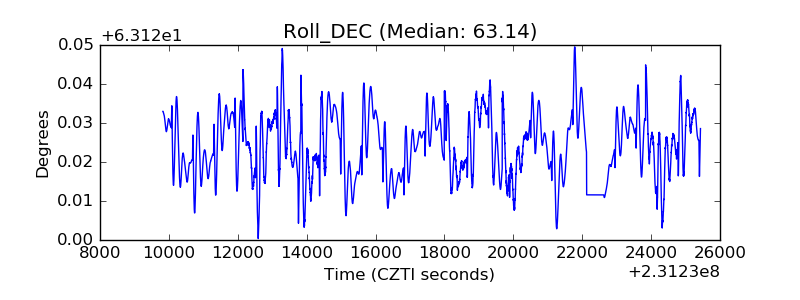 |
| _Roll_RA | 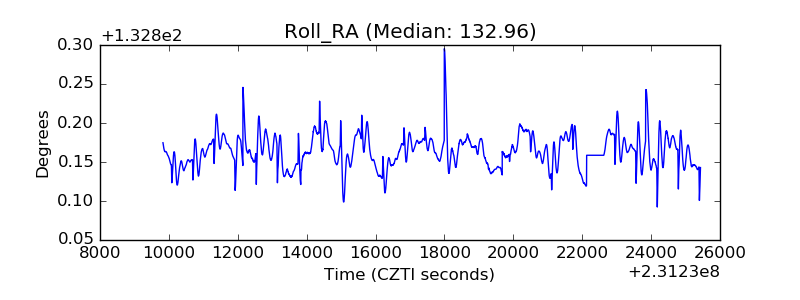 |
| Veto Counter | 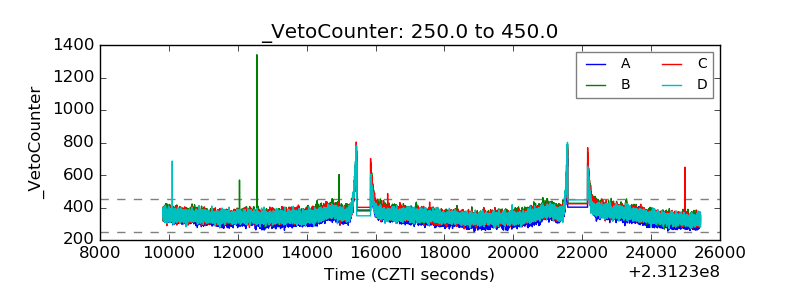 |