| Param | Original file | Final file |
|---|---|---|
| Filename | modeM0/AS1A03_102T01_9000001202_08592cztM0_level2.evt | modeM0/AS1A03_102T01_9000001202_08592cztM0_level2_quad_clean.evt |
| Size (bytes) | 645,992,640 | 156,401,280 |
| Size | 616.1 MB | 149.2 MB |
| Events in quadrant A | 4,758,521 | 1,013,934 |
| Events in quadrant B | 4,730,356 | 1,038,634 |
| Events in quadrant C | 4,342,897 | 1,020,066 |
| Events in quadrant D | 5,059,573 | 977,393 |
| Mode M9 | |||
|---|---|---|---|
| Quadrant | BADHDUFLAG | Total packets | Discarded packets |
| A | 0 | 17 | 0 |
| B | 0 | 17 | 0 |
| C | 0 | 17 | 0 |
| D | 0 | 17 | 0 |
| Mode SS | |||
|---|---|---|---|
| Quadrant | BADHDUFLAG | Total packets | Discarded packets |
| A | 0 | 202 | 0 |
| B | 0 | 202 | 0 |
| C | 0 | 202 | 0 |
| D | 0 | 202 | 0 |
| Mode M0 | |||
|---|---|---|---|
| Quadrant | BADHDUFLAG | Total packets | Discarded packets |
| A | 0 | 21132 | 3 |
| B | 0 | 20940 | 2 |
| C | 0 | 20150 | 2 |
| D | 0 | 22233 | 2 |
| Quadrant | Total seconds | Saturated seconds | Saturation percentage |
|---|---|---|---|
| A | 9912 | 140 | 1.412429% |
| B | 9912 | 103 | 1.039144% |
| C | 9912 | 85 | 0.857546% |
| D | 9912 | 244 | 2.461663% |
Noise dominated data is calculated using 1-second bins in cleaned event files. If a bin has >2000 counts, and if more than 50% of those come from <1% of pixels, then it is considered to be noise-dominated and hence unusable.
| Quadrant | # 1 sec bins | Bins with >0 counts | Bins with >2000 counts | High rate bins dominated by noise | Noise dominated (total time) | Noise dominated (detector-on time) | Marked lightcurve |
|---|---|---|---|---|---|---|---|
| A | 11607 | 9912 | 46 | 46 | 0.40% | 0.46% | 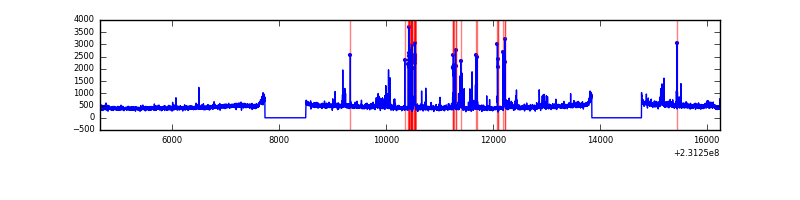 |
| B | 11607 | 9912 | 6 | 6 | 0.05% | 0.06% | 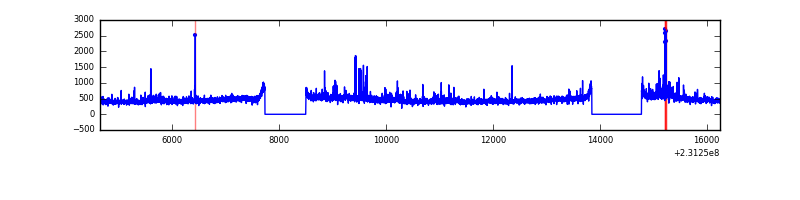 |
| C | 11607 | 9912 | 0 | 0 | 0.00% | 0.00% | 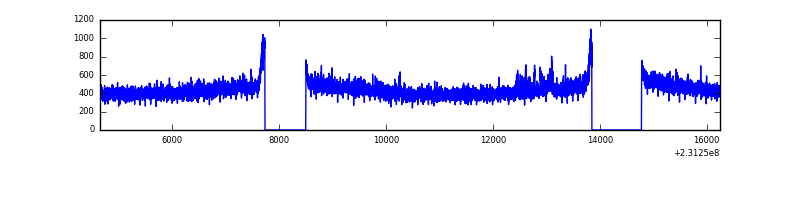 |
| D | 11607 | 9912 | 144 | 144 | 1.24% | 1.45% | 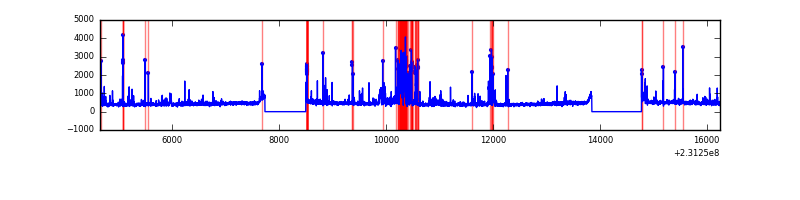 |
Top three noisy pixels from each quadrant. If the there are fewer than three noisy pixels in the level2.evt file, extra rows are filled as -1
| Pixel properties | Quadrant properties | ||||||
|---|---|---|---|---|---|---|---|
| Quadrant | DetID | PixID | Counts | Sigma | Mean | Median | Sigma |
| A | 15 | 223 | 256458 | 1131.21 | 1121 | 1093 | 225.7 |
| A | 15 | 239 | 101455 | 444.58 | 1121 | 1093 | 225.7 |
| A | 8 | 5 | 52133 | 226.1 | 1121 | 1093 | 225.7 |
| B | 0 | 214 | 95440 | 436.01 | 1137 | 1111 | 216.3 |
| B | 0 | 219 | 76575 | 348.81 | 1137 | 1111 | 216.3 |
| B | 4 | 173 | 63694 | 289.27 | 1137 | 1111 | 216.3 |
| C | 14 | 67 | 32199 | 121.93 | 1102 | 1107 | 255.0 |
| C | 8 | 222 | 8762 | 30.02 | 1102 | 1107 | 255.0 |
| C | 13 | 61 | 8264 | 28.06 | 1102 | 1107 | 255.0 |
| D | 10 | 253 | 370918 | 1388.67 | 1094 | 1061 | 266.3 |
| D | 7 | 71 | 144827 | 539.78 | 1094 | 1061 | 266.3 |
| D | 13 | 105 | 137067 | 510.65 | 1094 | 1061 | 266.3 |
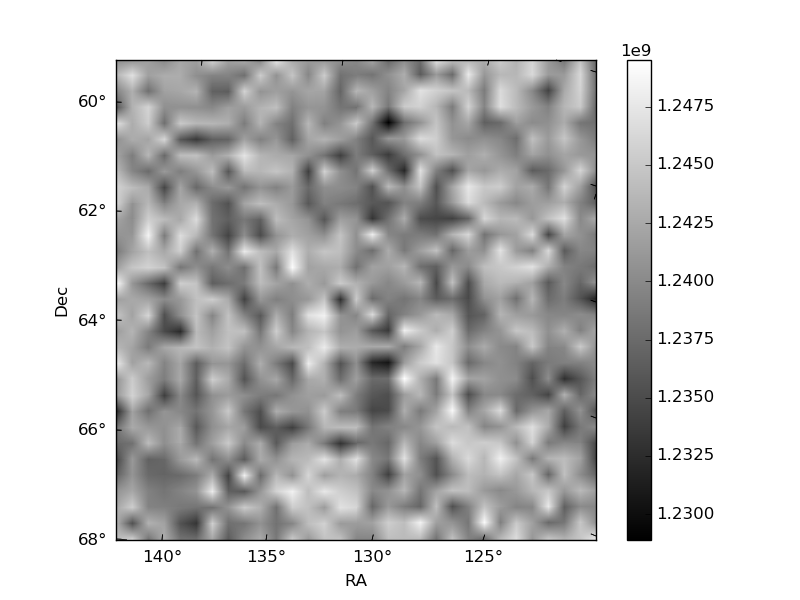
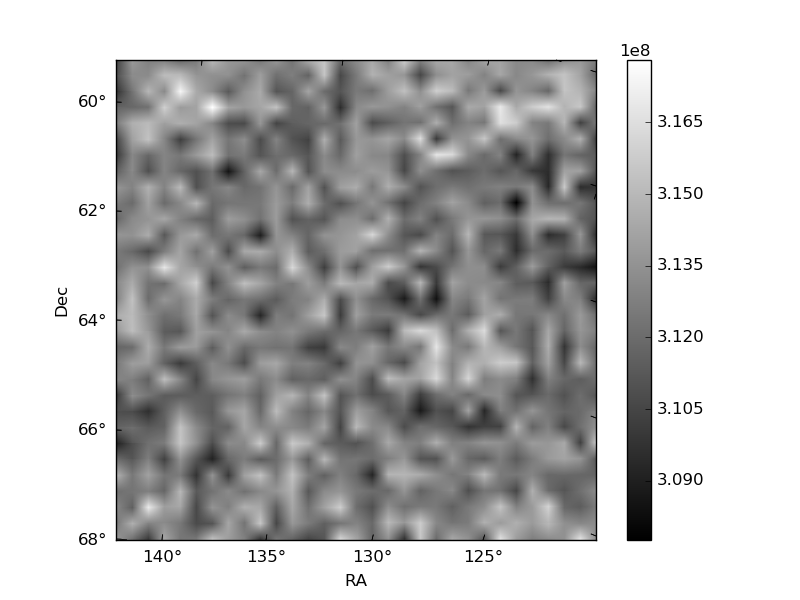
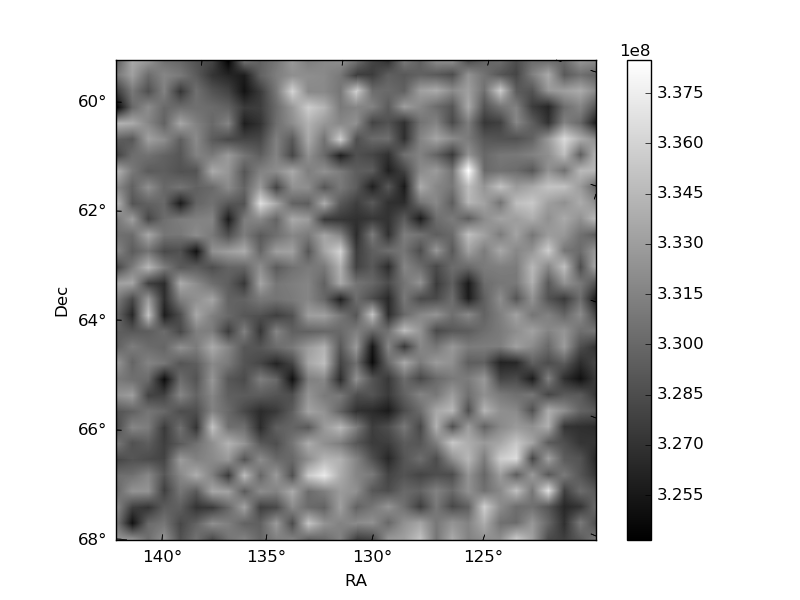
Histogram calculated using DETX and DETY for each event in the final _common_clean file
| Quadrant A | 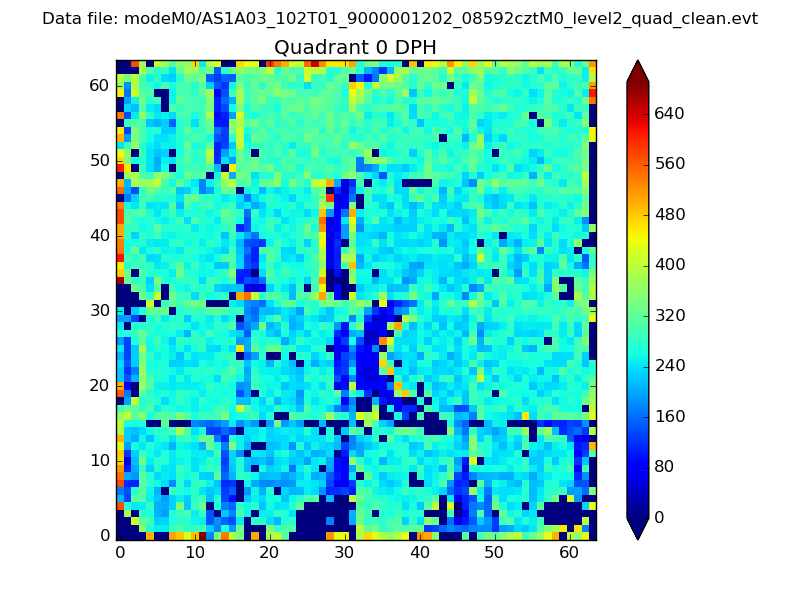 |
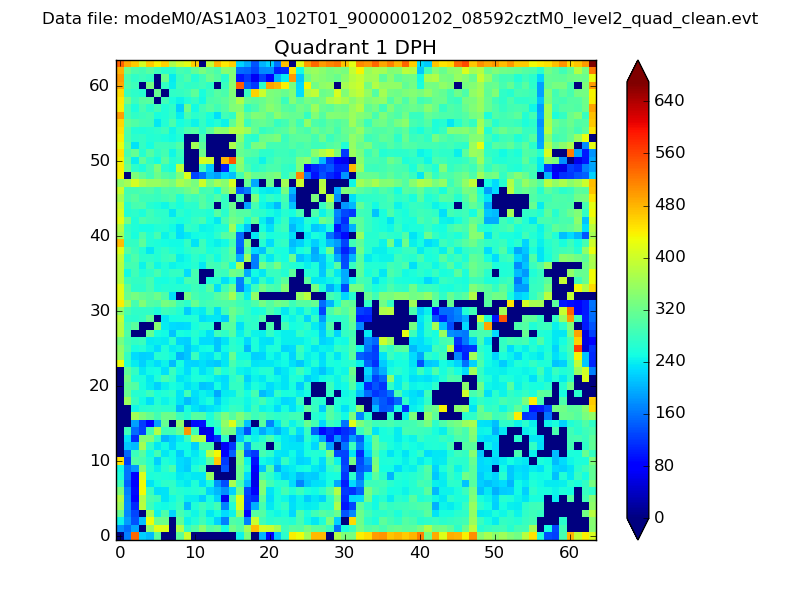 |
Quadrant B |
|---|---|---|---|
| Quadrant D |  |
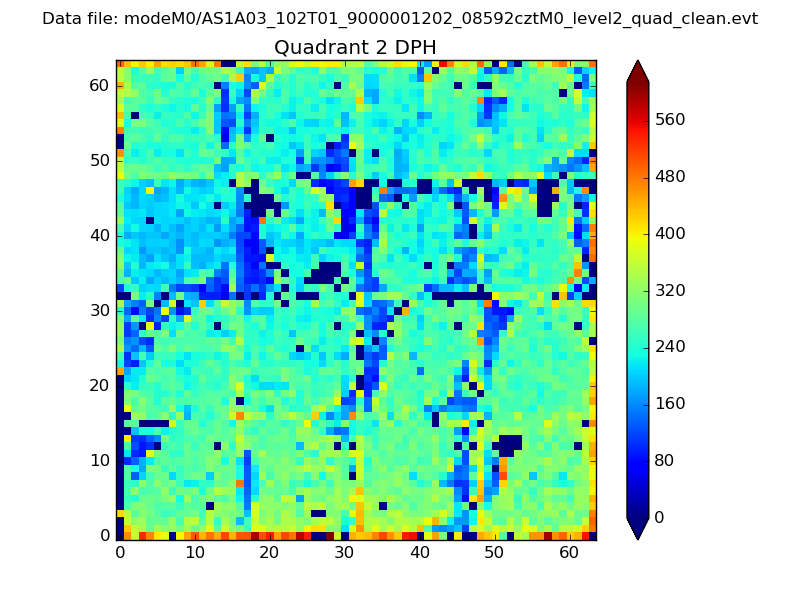 |
Quadrant C |
| Plot type | Count rate plots | Images |
|---|---|---|
| Comparison with Poisson distribution Blue bars denote a histogram of data divided into 1 sec bins. Red curve is a Poisson curve with rate = median count rate of data. |
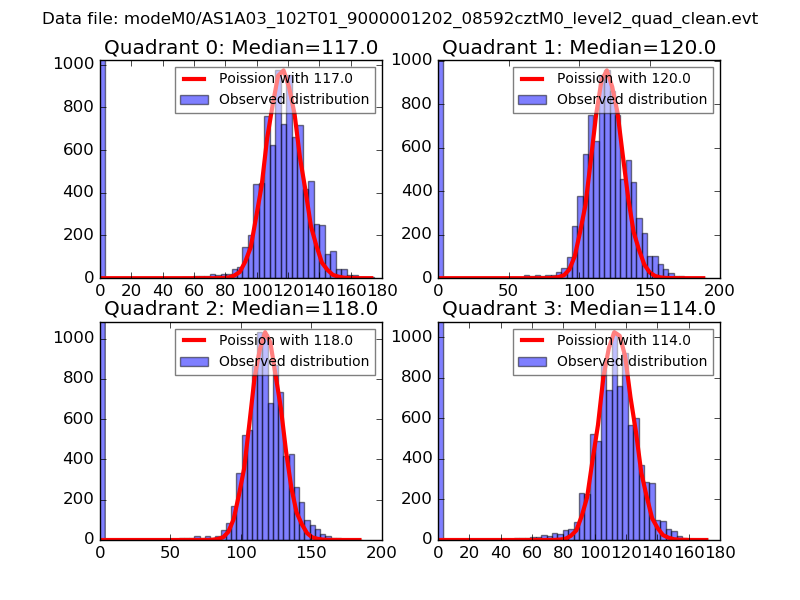 |
 |
| Quadrant-wise count rates Data is divided into 100 sec bins |
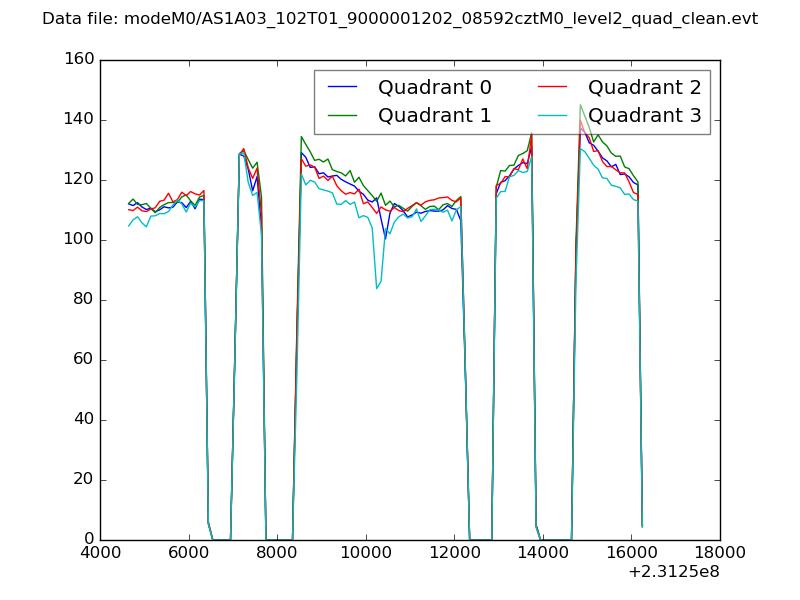 |
|
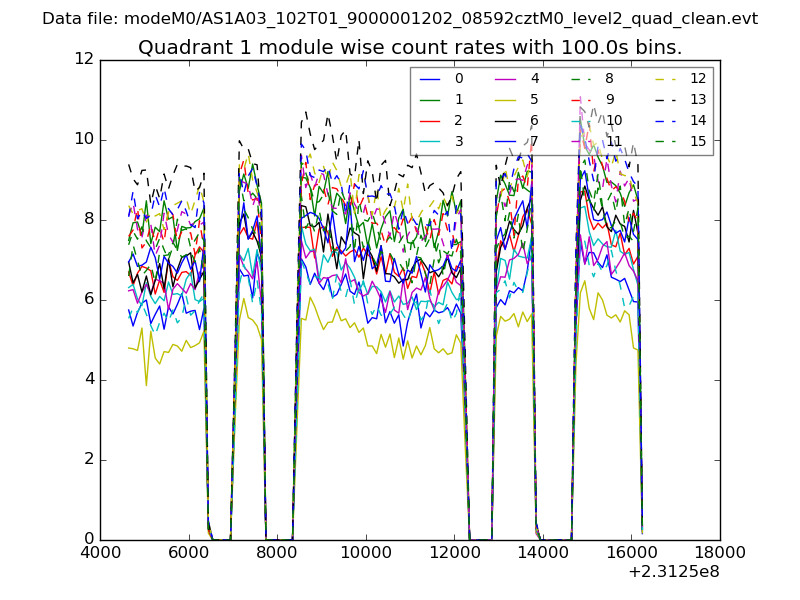
| Module-wise count rates for Quadrant A Data is divided into 100 sec bins |
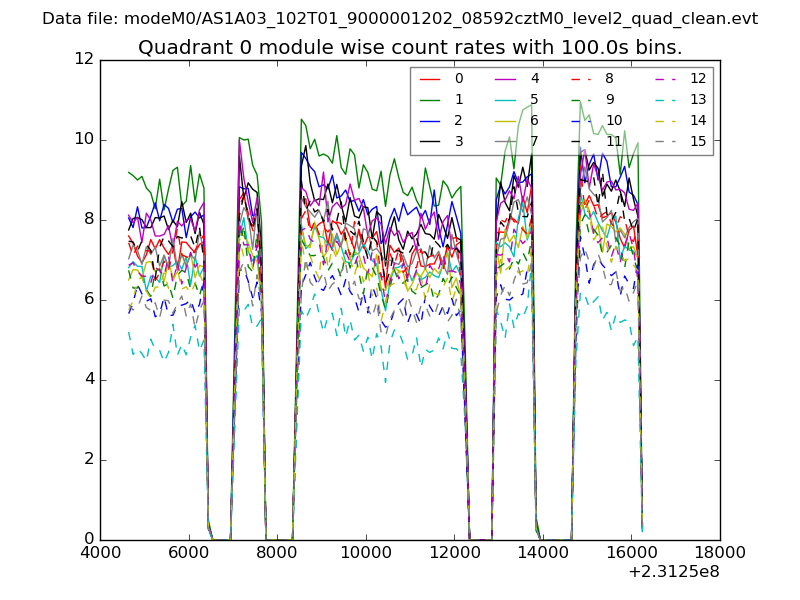 |
 |
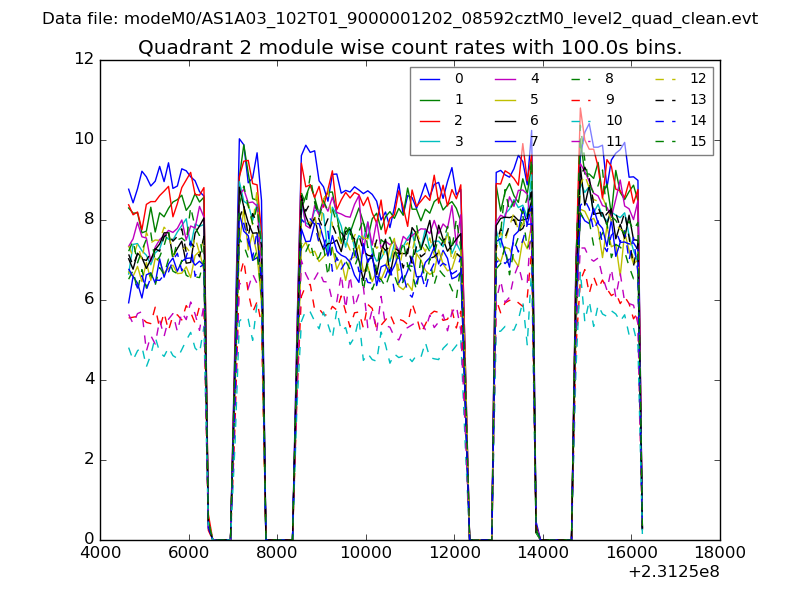
| Module-wise count rates for Quadrant B Data is divided into 100 sec bins |
 |
 |
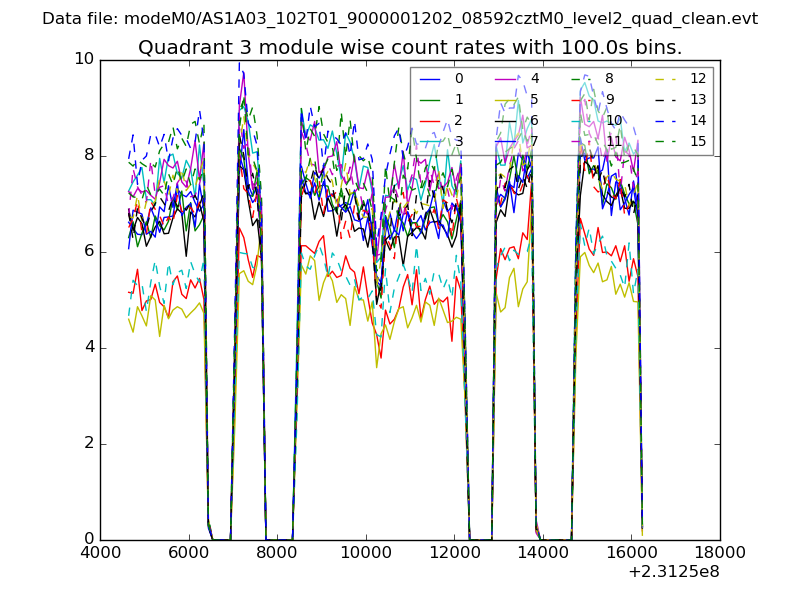
| Module-wise count rates for Quadrant C Data is divided into 100 sec bins |
 |
 |
| Module-wise count rates for Quadrant D Data is divided into 100 sec bins |
 |
 |
| Parameter | Plot |
|---|---|
| CZT HV Monitor | 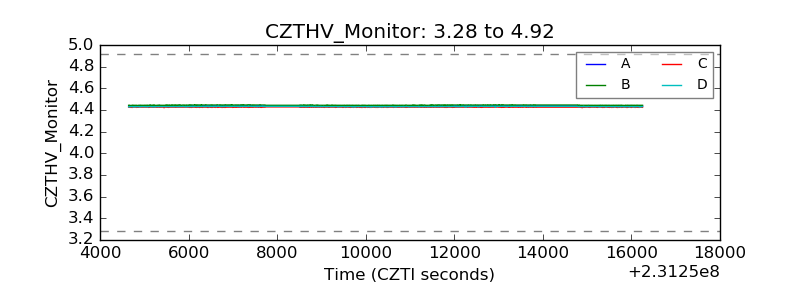 |
| D_VDD | 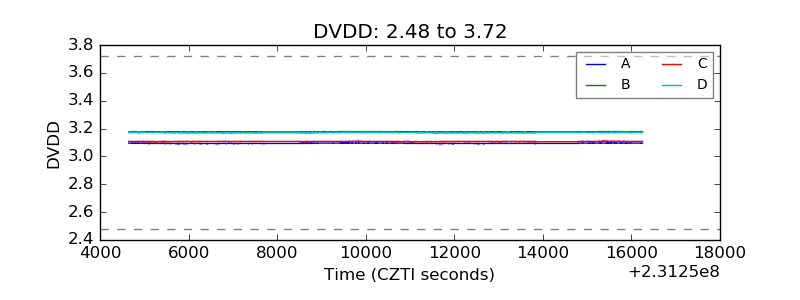 |
| Temperature 1 |  |
| Veto HV Monitor | 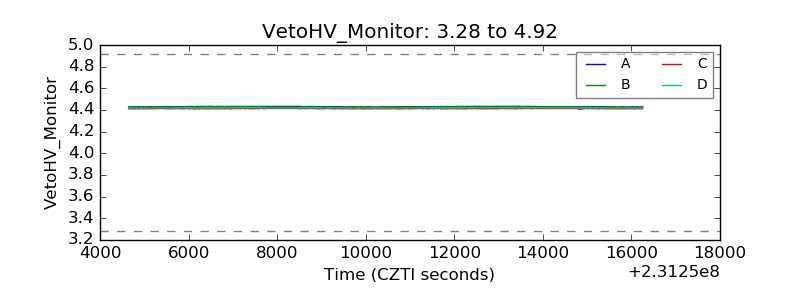 |
| Veto LLD | 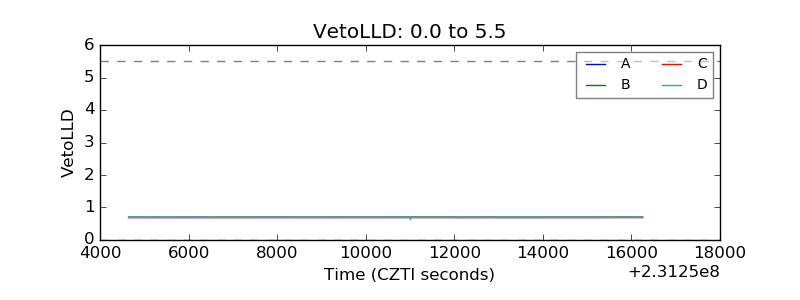 |
| Alpha Counter | 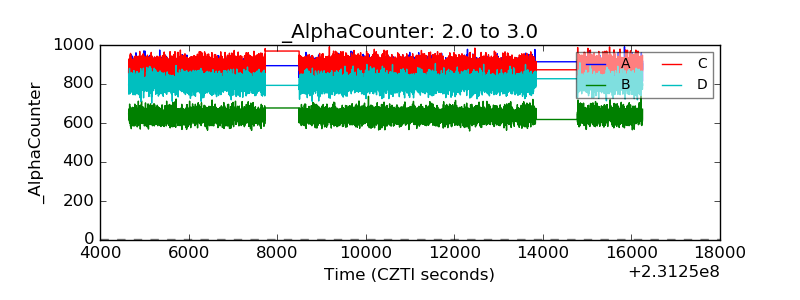 |
| _CPM_Rate | 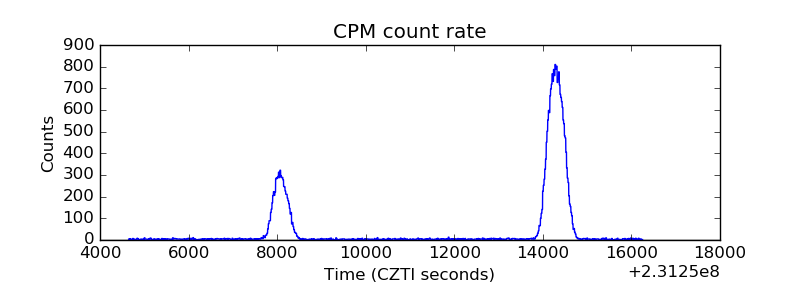 |
| CZT Counter | 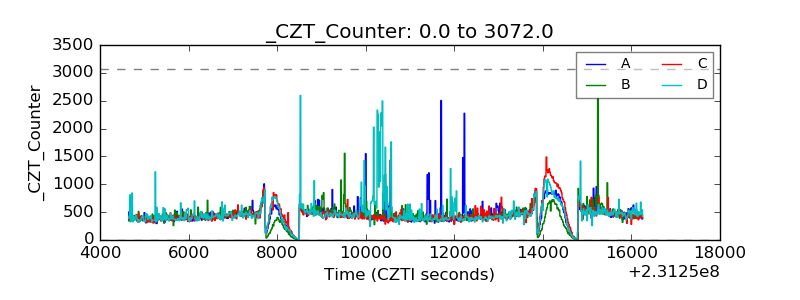 |
| +2.5 Volts monitor |  |
| +5 Volts monitor |  |
| _ROLL_ROT | 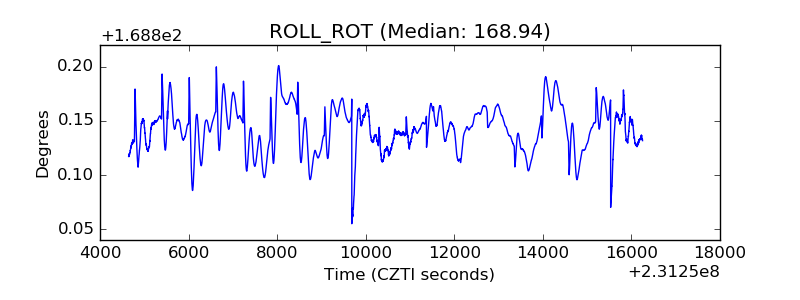 |
| _Roll_DEC | 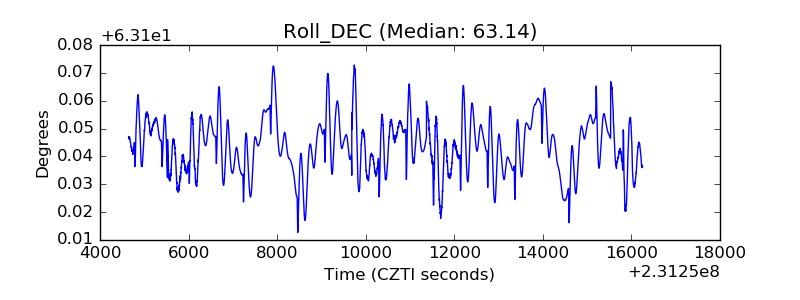 |
| _Roll_RA | 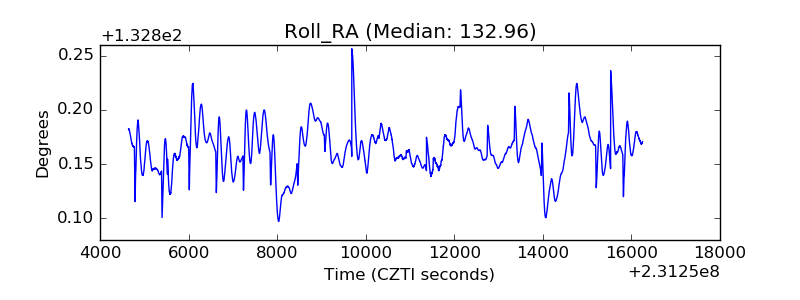 |
| Veto Counter | 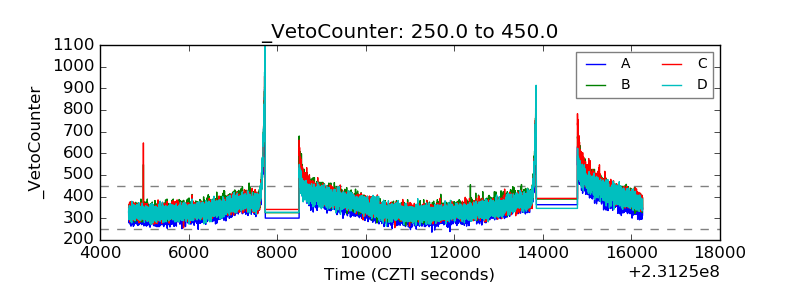 |