| Param | Original file | Final file |
|---|---|---|
| Filename | modeM0/AS1A03_102T01_9000001202_08594cztM0_level2.evt | modeM0/AS1A03_102T01_9000001202_08594cztM0_level2_quad_clean.evt |
| Size (bytes) | 395,703,360 | 103,705,920 |
| Size | 377.4 MB | 98.9 MB |
| Events in quadrant A | 2,829,719 | 675,765 |
| Events in quadrant B | 3,104,976 | 695,308 |
| Events in quadrant C | 2,724,387 | 684,300 |
| Events in quadrant D | 2,903,112 | 652,850 |
| Mode M9 | |||
|---|---|---|---|
| Quadrant | BADHDUFLAG | Total packets | Discarded packets |
| A | 0 | 11 | 0 |
| B | 0 | 11 | 0 |
| C | 0 | 11 | 0 |
| D | 0 | 11 | 0 |
| Mode SS | |||
|---|---|---|---|
| Quadrant | BADHDUFLAG | Total packets | Discarded packets |
| A | 0 | 126 | 0 |
| B | 0 | 126 | 0 |
| C | 0 | 126 | 0 |
| D | 0 | 126 | 0 |
| Mode M0 | |||
|---|---|---|---|
| Quadrant | BADHDUFLAG | Total packets | Discarded packets |
| A | 0 | 12803 | 2 |
| B | 0 | 13449 | 1 |
| C | 0 | 12570 | 1 |
| D | 0 | 13080 | 1 |
| Quadrant | Total seconds | Saturated seconds | Saturation percentage |
|---|---|---|---|
| A | 6197 | 31 | 0.500242% |
| B | 6197 | 42 | 0.677747% |
| C | 6197 | 23 | 0.371147% |
| D | 6197 | 54 | 0.871389% |
Noise dominated data is calculated using 1-second bins in cleaned event files. If a bin has >2000 counts, and if more than 50% of those come from <1% of pixels, then it is considered to be noise-dominated and hence unusable.
| Quadrant | # 1 sec bins | Bins with >0 counts | Bins with >2000 counts | High rate bins dominated by noise | Noise dominated (total time) | Noise dominated (detector-on time) | Marked lightcurve |
|---|---|---|---|---|---|---|---|
| A | 7277 | 6198 | 7 | 7 | 0.10% | 0.11% | 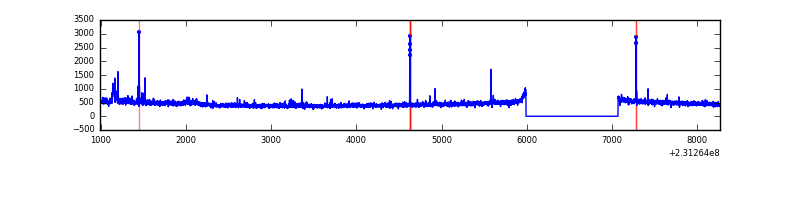 |
| B | 7277 | 6197 | 6 | 6 | 0.08% | 0.10% | 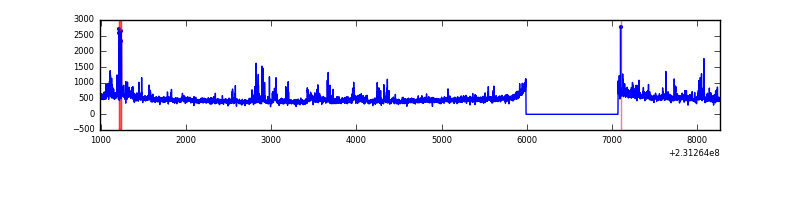 |
| C | 7277 | 6197 | 0 | 0 | 0.00% | 0.00% |  |
| D | 7277 | 6197 | 26 | 26 | 0.36% | 0.42% | 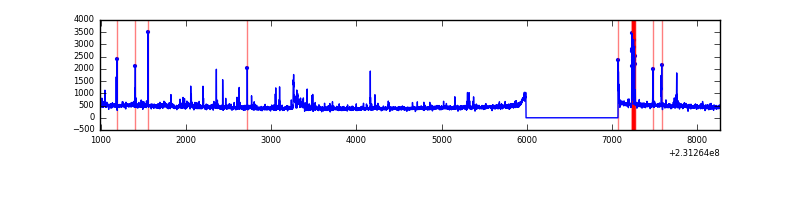 |
Top three noisy pixels from each quadrant. If the there are fewer than three noisy pixels in the level2.evt file, extra rows are filled as -1
| Pixel properties | Quadrant properties | ||||||
|---|---|---|---|---|---|---|---|
| Quadrant | DetID | PixID | Counts | Sigma | Mean | Median | Sigma |
| A | 15 | 223 | 41429 | 285.87 | 704 | 689 | 142.5 |
| A | 8 | 5 | 30159 | 206.79 | 704 | 689 | 142.5 |
| A | 5 | 16 | 15646 | 104.95 | 704 | 689 | 142.5 |
| B | 4 | 173 | 164497 | 1215.63 | 716 | 700 | 134.7 |
| B | 0 | 214 | 40854 | 298.0 | 716 | 700 | 134.7 |
| B | 0 | 219 | 38104 | 277.6 | 716 | 700 | 134.7 |
| C | 13 | 61 | 5269 | 28.41 | 697 | 700 | 160.8 |
| C | 14 | 67 | 4375 | 22.85 | 697 | 700 | 160.8 |
| C | 8 | 222 | 3402 | 16.8 | 697 | 700 | 160.8 |
| D | 7 | 71 | 135611 | 792.06 | 695 | 673 | 170.4 |
| D | 13 | 105 | 51064 | 295.79 | 695 | 673 | 170.4 |
| D | 2 | 234 | 24672 | 140.87 | 695 | 673 | 170.4 |
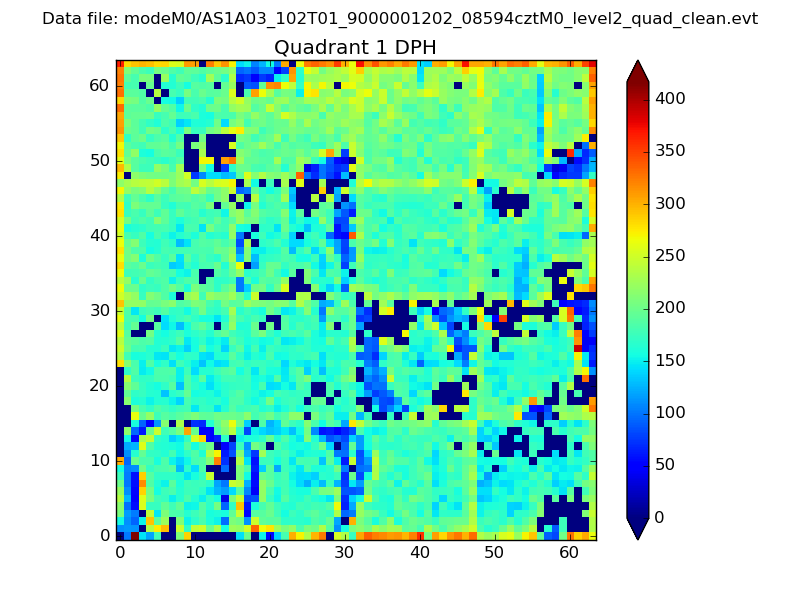
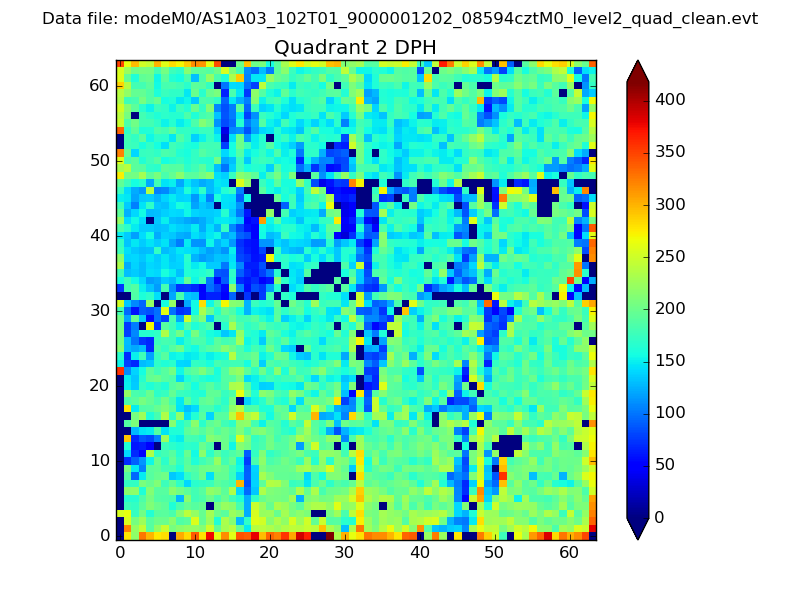
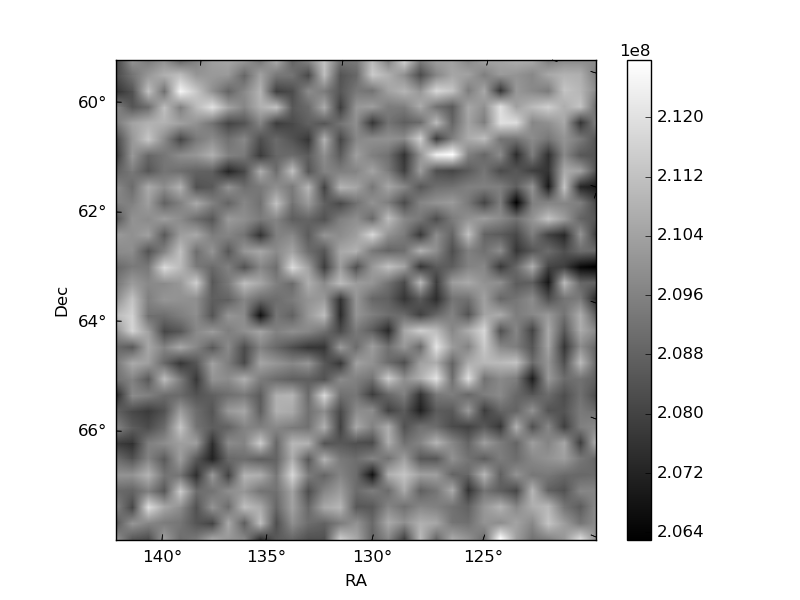
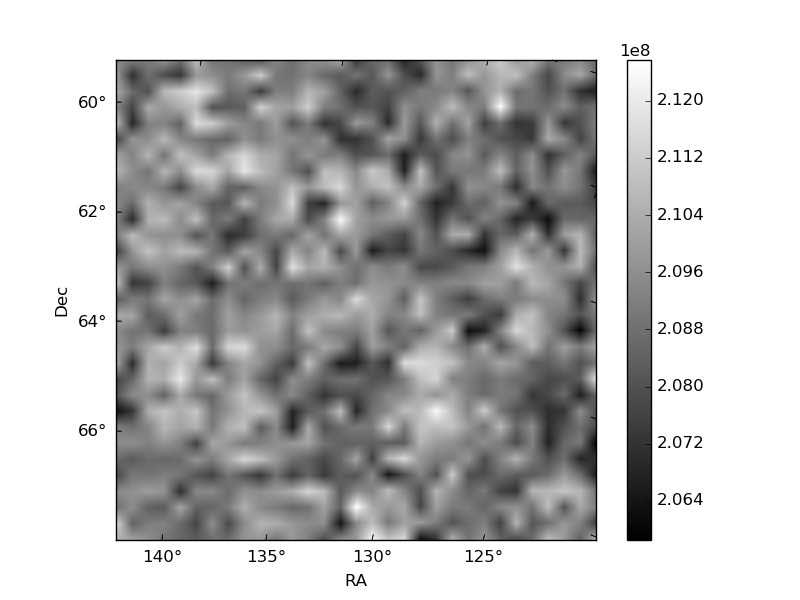
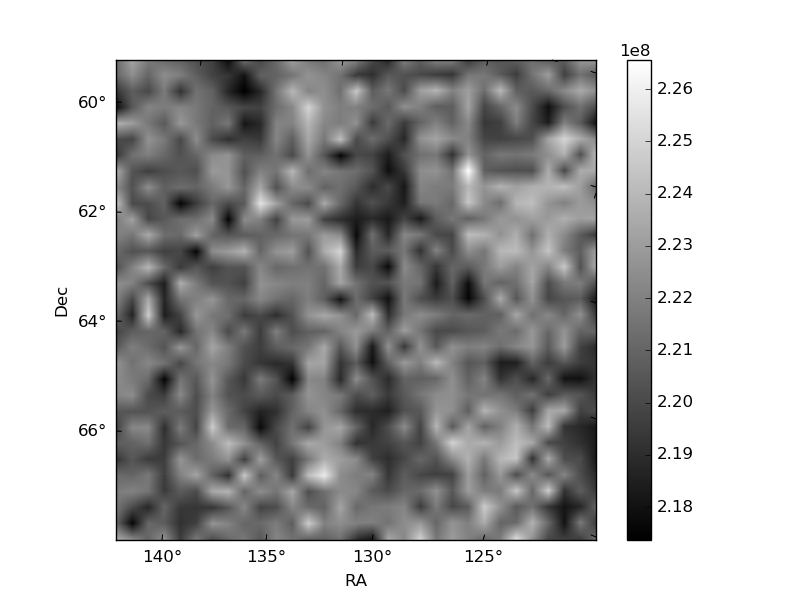
Histogram calculated using DETX and DETY for each event in the final _common_clean file
| Quadrant A | 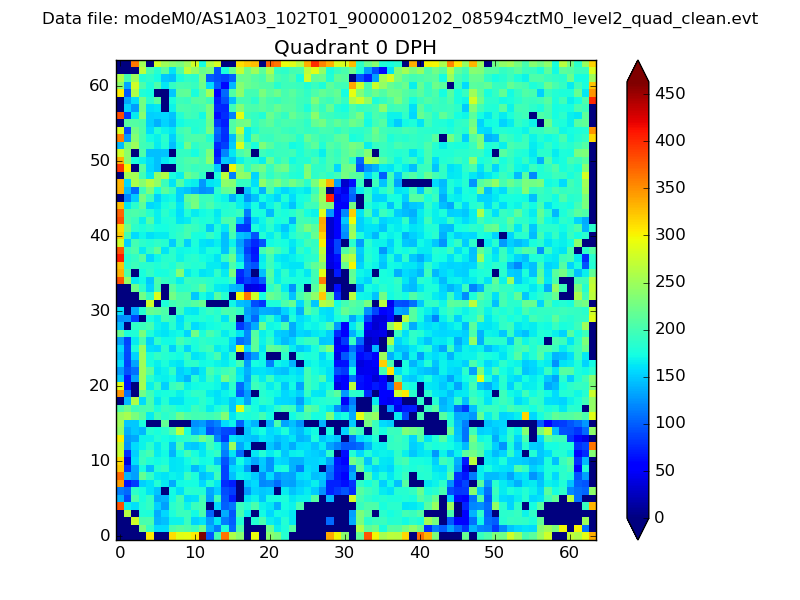 |
 |
Quadrant B |
|---|---|---|---|
| Quadrant D | 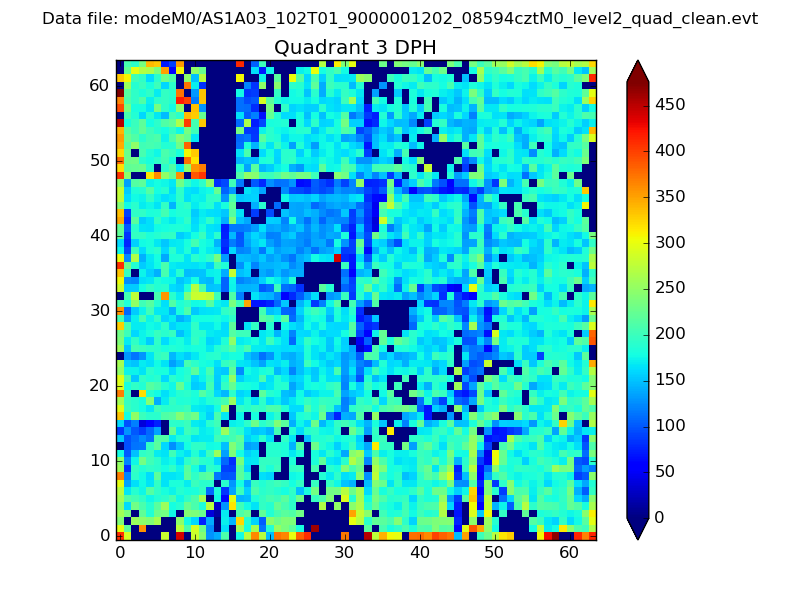 |
 |
Quadrant C |
| Plot type | Count rate plots | Images |
|---|---|---|
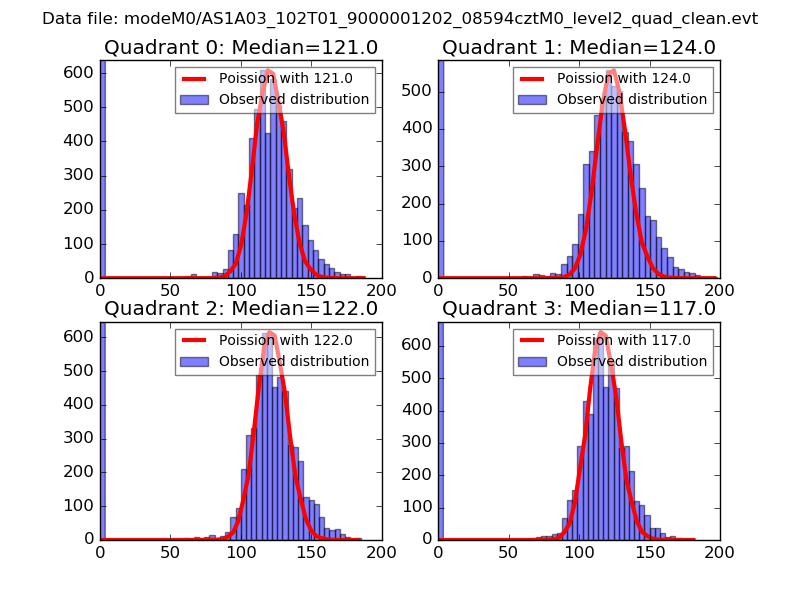
| Comparison with Poisson distribution Blue bars denote a histogram of data divided into 1 sec bins. Red curve is a Poisson curve with rate = median count rate of data. |
 |
 |
| Quadrant-wise count rates Data is divided into 100 sec bins |
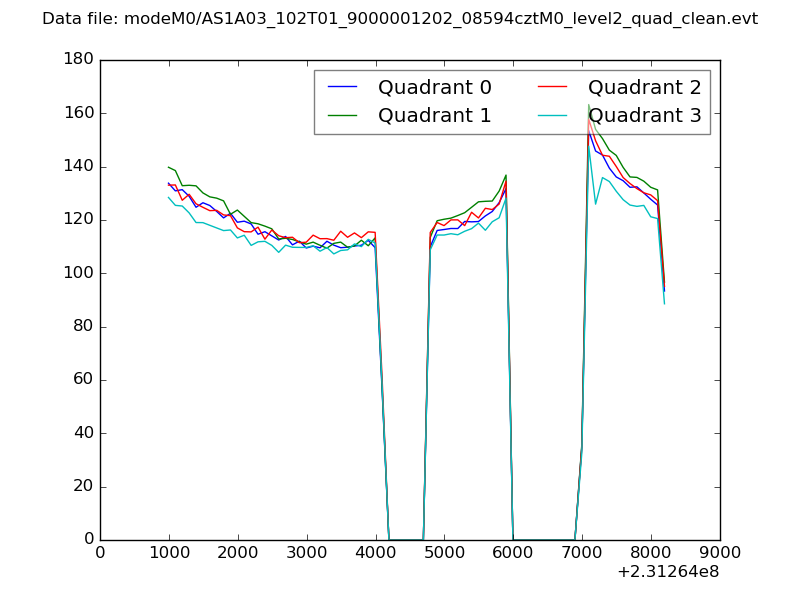 |
|
| Module-wise count rates for Quadrant A Data is divided into 100 sec bins |
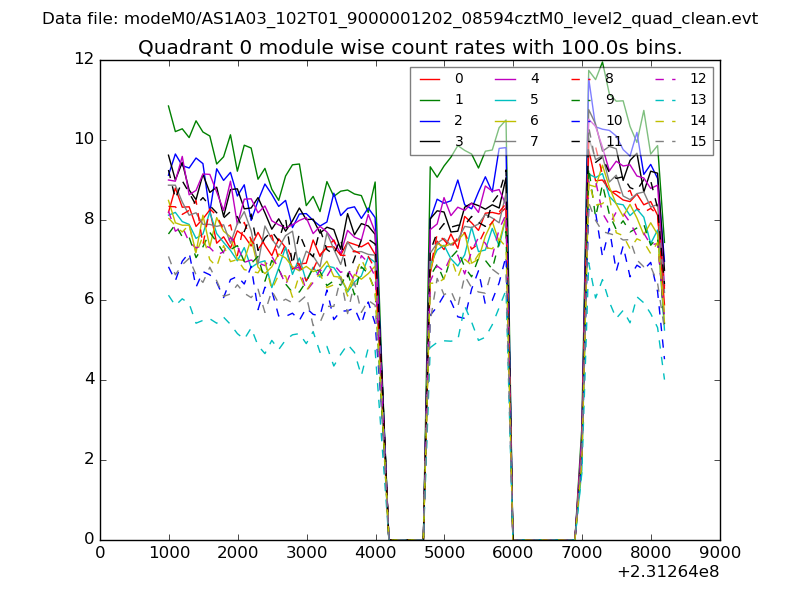 |
 |
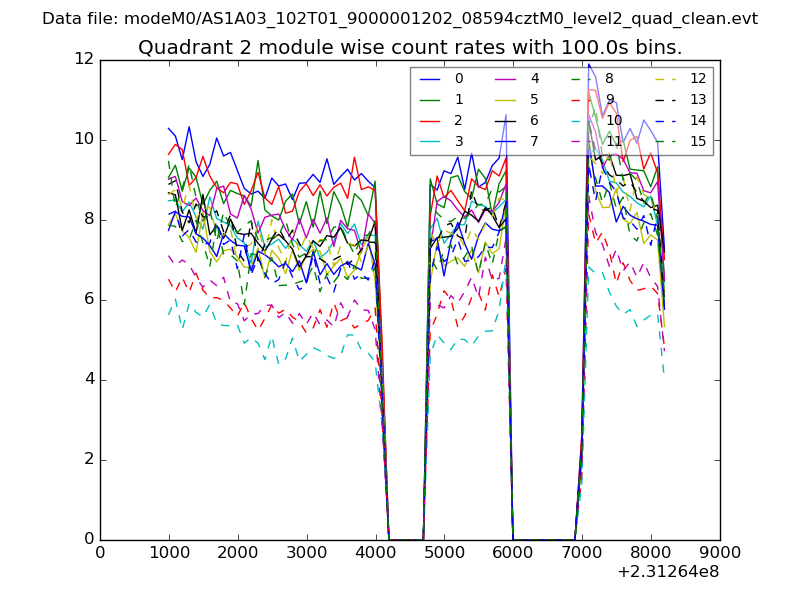
| Module-wise count rates for Quadrant B Data is divided into 100 sec bins |
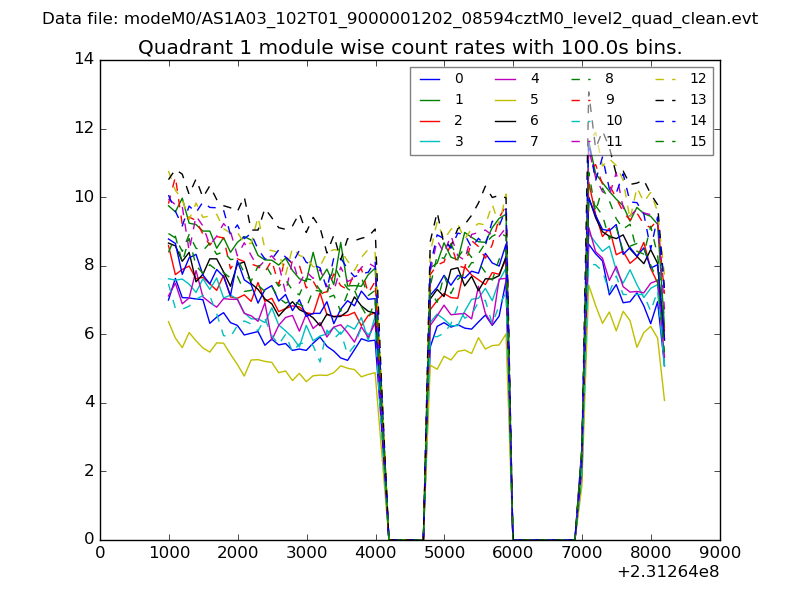 |
 |
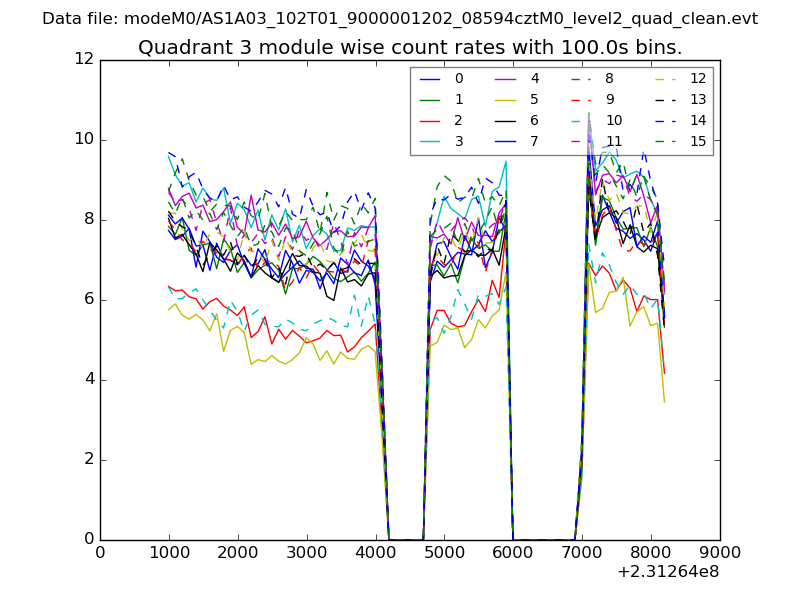
| Module-wise count rates for Quadrant C Data is divided into 100 sec bins |
 |
 |
| Module-wise count rates for Quadrant D Data is divided into 100 sec bins |
 |
 |
| Parameter | Plot |
|---|---|
| CZT HV Monitor | 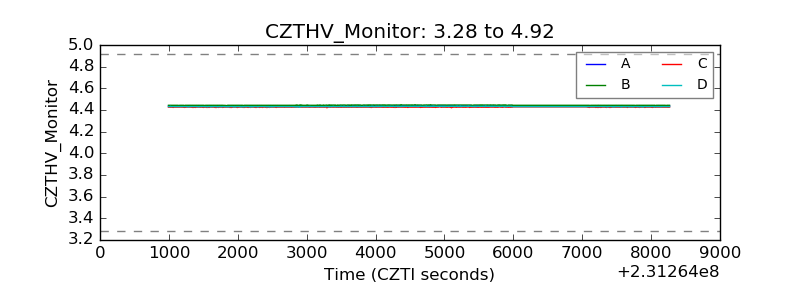 |
| D_VDD |  |
| Temperature 1 | 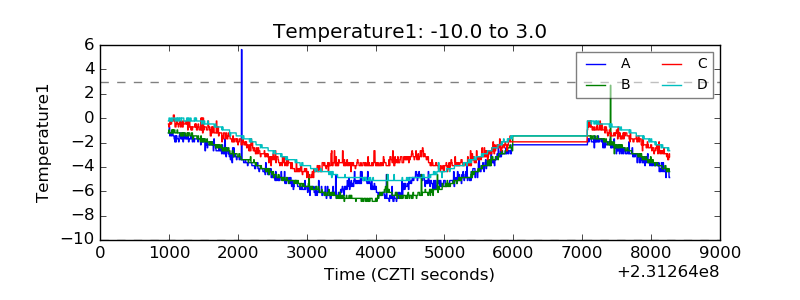 |
| Veto HV Monitor | 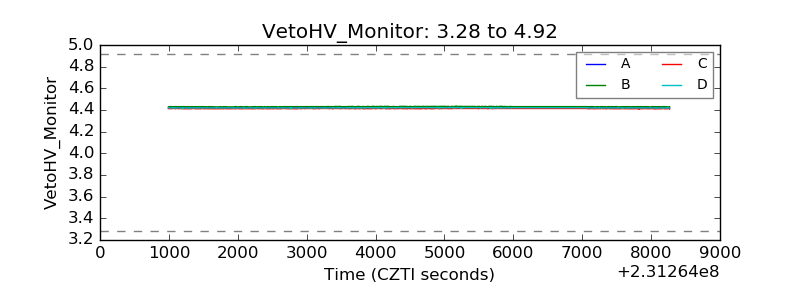 |
| Veto LLD | 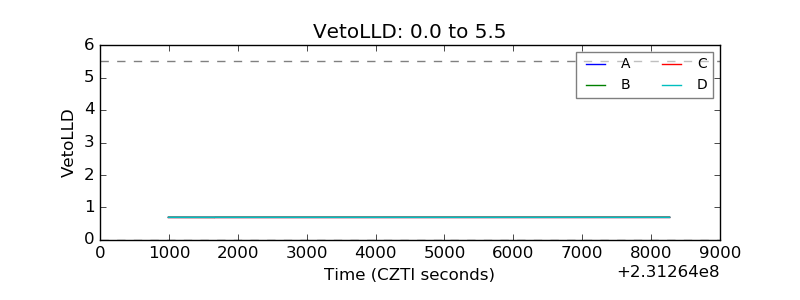 |
| Alpha Counter | 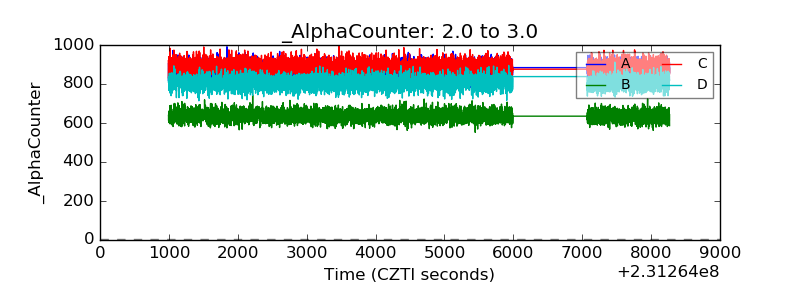 |
| _CPM_Rate | 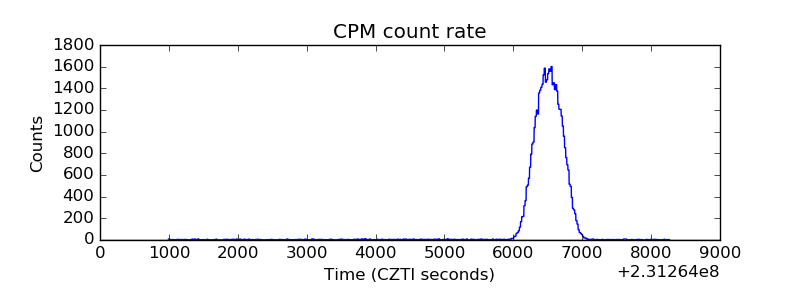 |
| CZT Counter | 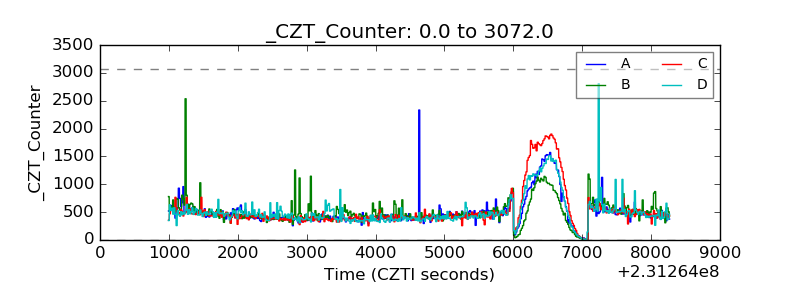 |
| +2.5 Volts monitor |  |
| +5 Volts monitor | 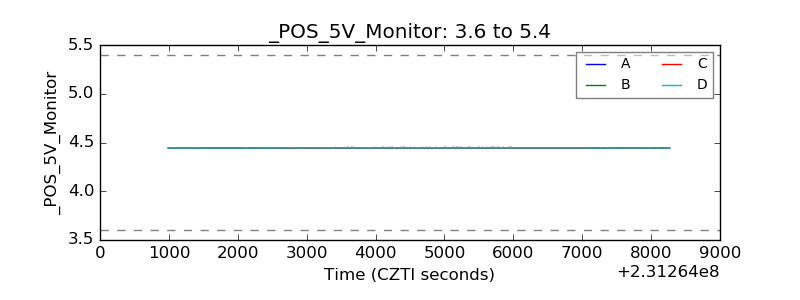 |
| _ROLL_ROT | 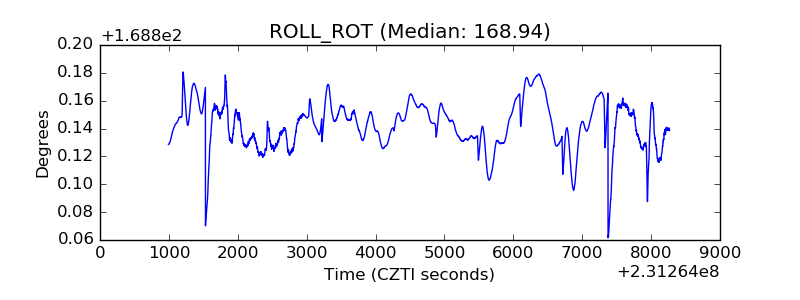 |
| _Roll_DEC | 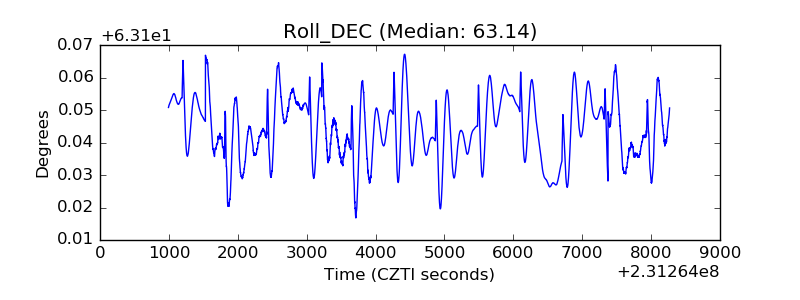 |
| _Roll_RA | 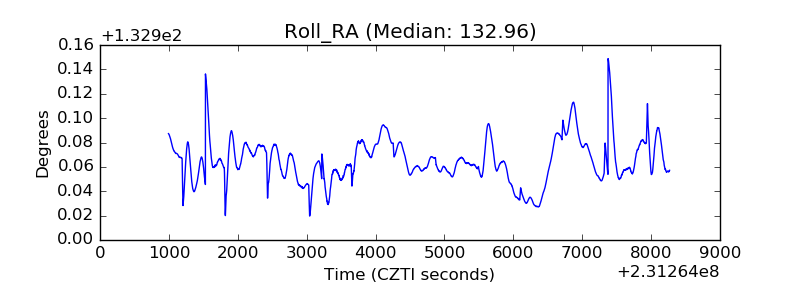 |
| Veto Counter | 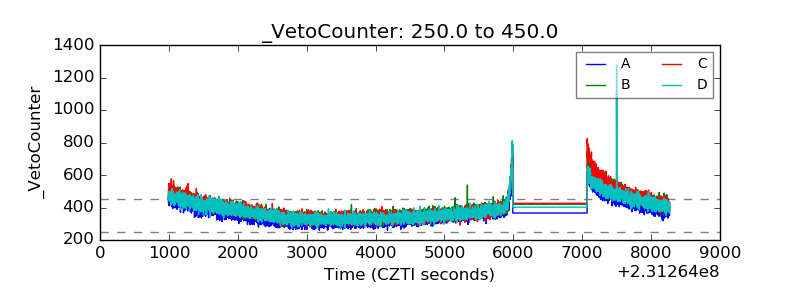 |