| Param | Original file | Final file |
|---|---|---|
| Filename | modeM0/AS1A03_102T01_9000001202_08596cztM0_level2.evt | modeM0/AS1A03_102T01_9000001202_08596cztM0_level2_quad_clean.evt |
| Size (bytes) | 420,364,800 | 109,653,120 |
| Size | 400.9 MB | 104.6 MB |
| Events in quadrant A | 2,970,944 | 720,833 |
| Events in quadrant B | 3,084,995 | 754,341 |
| Events in quadrant C | 2,826,928 | 741,424 |
| Events in quadrant D | 3,424,575 | 669,994 |
| Mode M9 | |||
|---|---|---|---|
| Quadrant | BADHDUFLAG | Total packets | Discarded packets |
| A | 0 | 20 | 0 |
| B | 0 | 20 | 0 |
| C | 0 | 20 | 0 |
| D | 0 | 21 | 0 |
| Mode SS | |||
|---|---|---|---|
| Quadrant | BADHDUFLAG | Total packets | Discarded packets |
| A | 0 | 128 | 0 |
| B | 0 | 128 | 0 |
| C | 0 | 128 | 0 |
| D | 0 | 128 | 0 |
| Mode M0 | |||
|---|---|---|---|
| Quadrant | BADHDUFLAG | Total packets | Discarded packets |
| A | 0 | 13112 | 3 |
| B | 0 | 13427 | 2 |
| C | 0 | 12755 | 2 |
| D | 0 | 14738 | 2 |
| Quadrant | Total seconds | Saturated seconds | Saturation percentage |
|---|---|---|---|
| A | 6216 | 29 | 0.466538% |
| B | 6216 | 29 | 0.466538% |
| C | 6216 | 14 | 0.225225% |
| D | 6216 | 280 | 4.504505% |
Noise dominated data is calculated using 1-second bins in cleaned event files. If a bin has >2000 counts, and if more than 50% of those come from <1% of pixels, then it is considered to be noise-dominated and hence unusable.
| Quadrant | # 1 sec bins | Bins with >0 counts | Bins with >2000 counts | High rate bins dominated by noise | Noise dominated (total time) | Noise dominated (detector-on time) | Marked lightcurve |
|---|---|---|---|---|---|---|---|
| A | 7471 | 6217 | 10 | 10 | 0.13% | 0.16% | 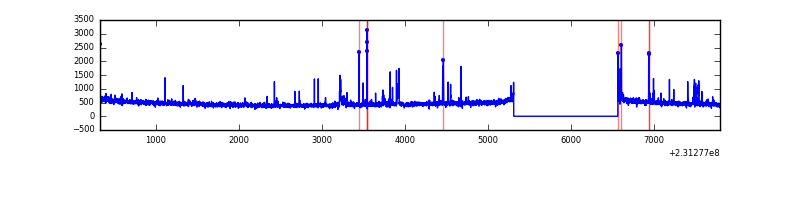 |
| B | 7471 | 6217 | 4 | 4 | 0.05% | 0.06% | 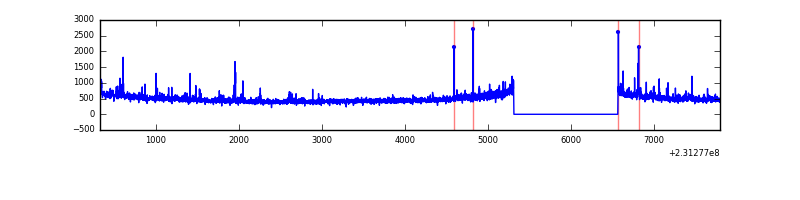 |
| C | 7471 | 6217 | 0 | 0 | 0.00% | 0.00% | 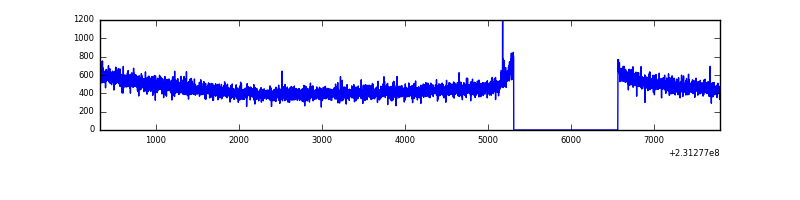 |
| D | 7471 | 6217 | 246 | 246 | 3.29% | 3.96% | 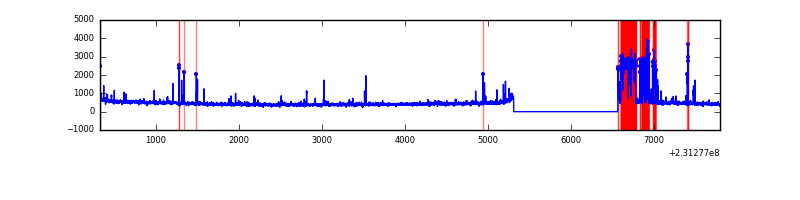 |
Top three noisy pixels from each quadrant. If the there are fewer than three noisy pixels in the level2.evt file, extra rows are filled as -1
| Pixel properties | Quadrant properties | ||||||
|---|---|---|---|---|---|---|---|
| Quadrant | DetID | PixID | Counts | Sigma | Mean | Median | Sigma |
| A | 5 | 16 | 83230 | 566.19 | 724 | 710 | 145.7 |
| A | 13 | 248 | 44315 | 299.18 | 724 | 710 | 145.7 |
| A | 15 | 223 | 26646 | 177.95 | 724 | 710 | 145.7 |
| B | 0 | 214 | 82790 | 589.55 | 741 | 722 | 139.2 |
| B | 4 | 80 | 22874 | 159.13 | 741 | 722 | 139.2 |
| B | 5 | 255 | 19168 | 132.51 | 741 | 722 | 139.2 |
| C | 14 | 234 | 5928 | 31.24 | 722 | 725 | 166.6 |
| C | 13 | 61 | 5473 | 28.51 | 722 | 725 | 166.6 |
| C | 8 | 222 | 3277 | 15.32 | 722 | 725 | 166.6 |
| D | 10 | 253 | 667021 | 4005.12 | 687 | 666 | 166.4 |
| D | 7 | 71 | 38639 | 228.24 | 687 | 666 | 166.4 |
| D | 2 | 14 | 31888 | 187.66 | 687 | 666 | 166.4 |
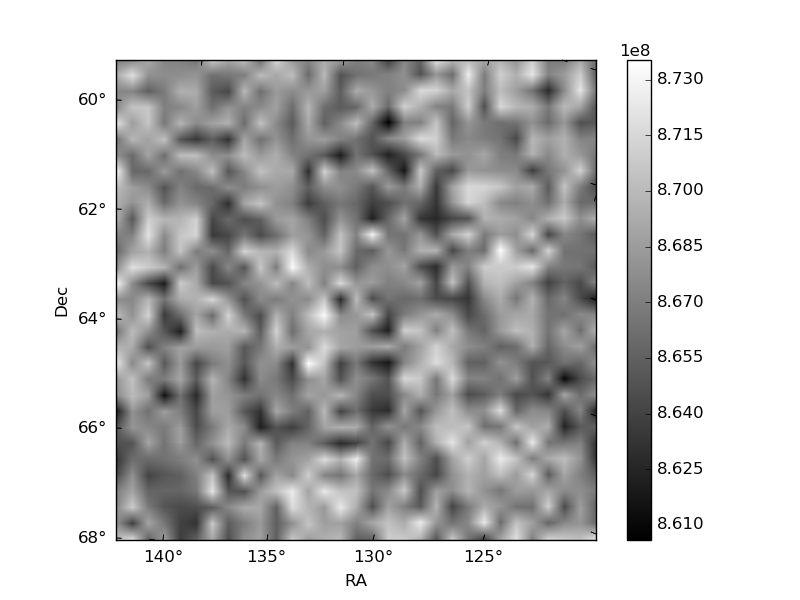
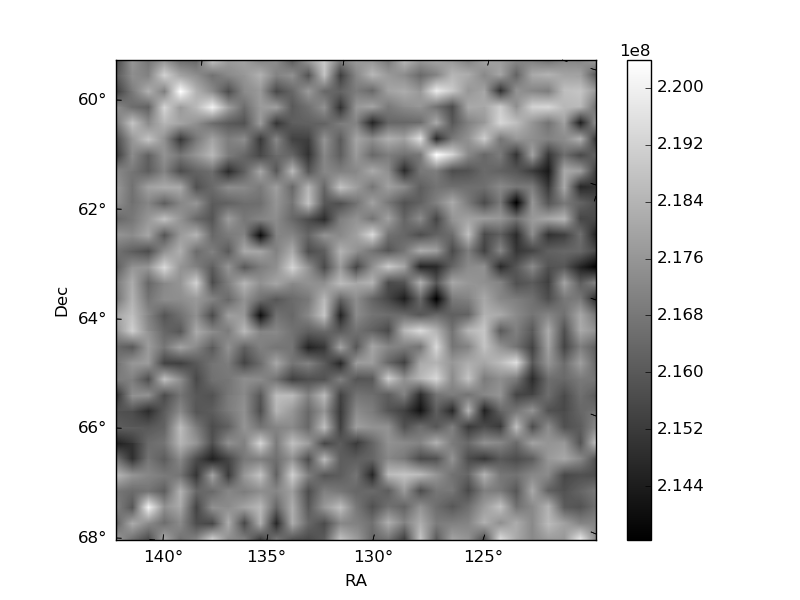
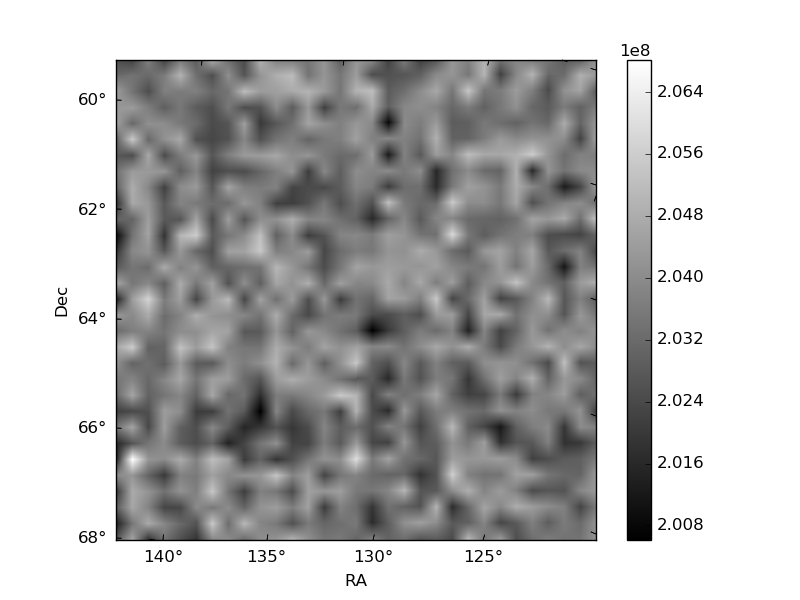
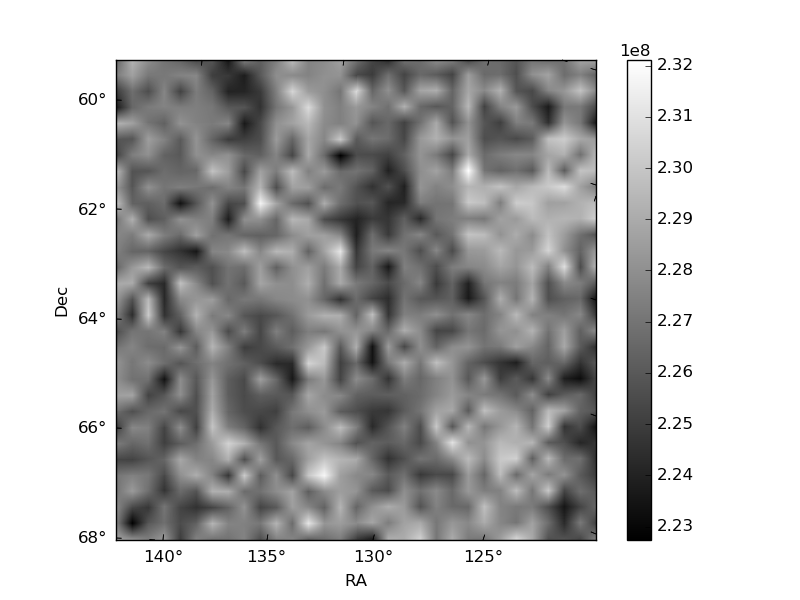
Histogram calculated using DETX and DETY for each event in the final _common_clean file
| Quadrant A | 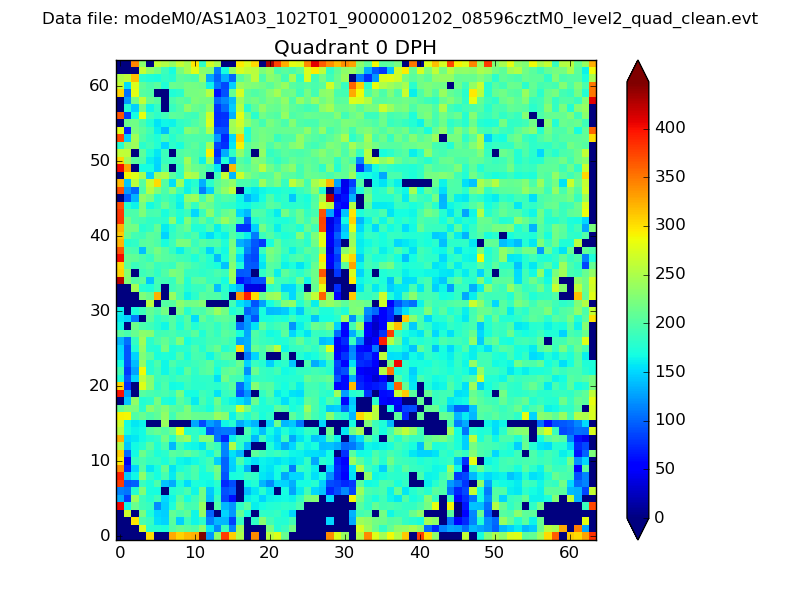 |
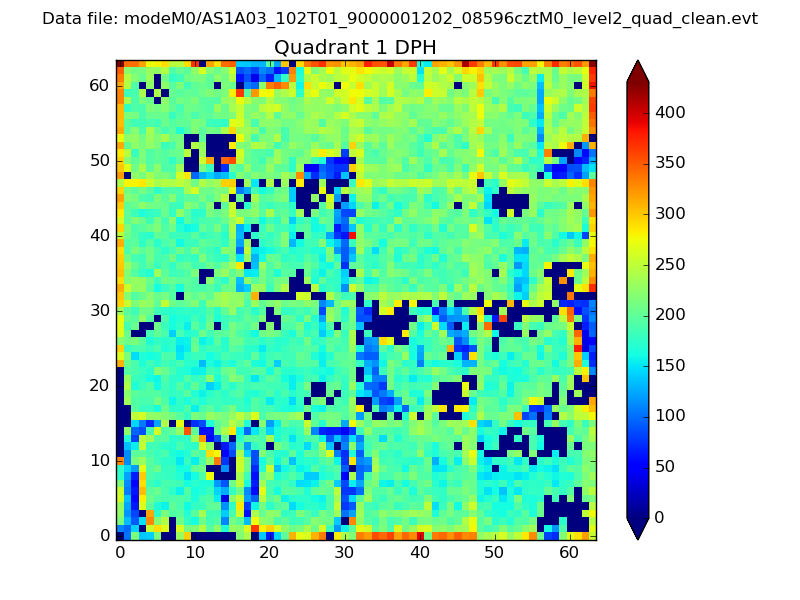 |
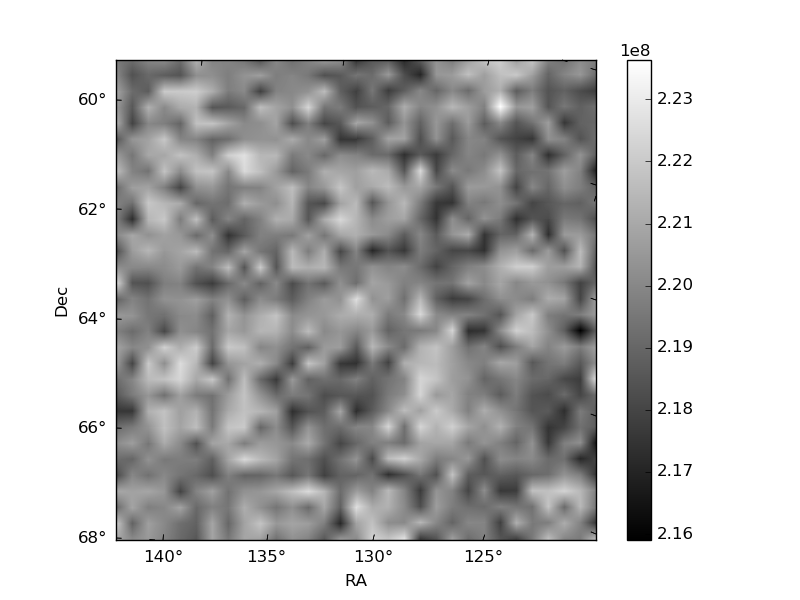
Quadrant B |
|---|---|---|---|
| Quadrant D | 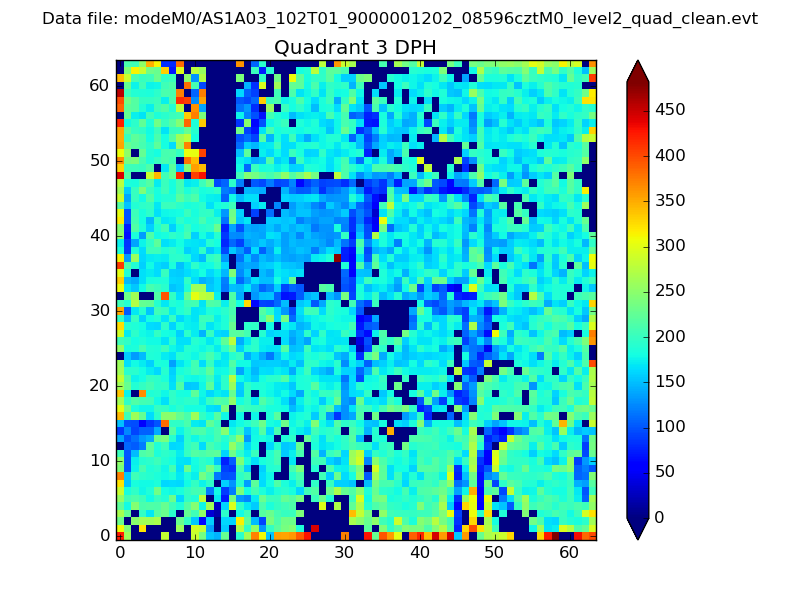 |
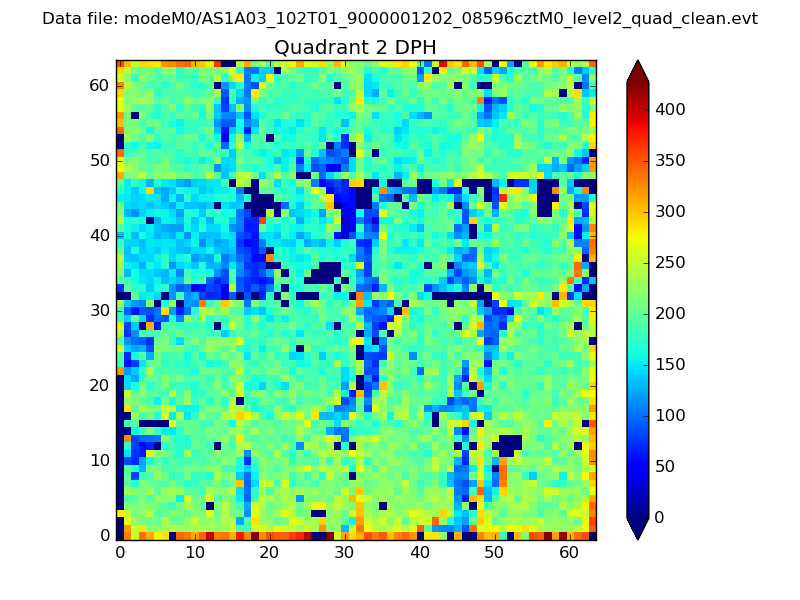 |
Quadrant C |
| Plot type | Count rate plots | Images |
|---|---|---|
| Comparison with Poisson distribution Blue bars denote a histogram of data divided into 1 sec bins. Red curve is a Poisson curve with rate = median count rate of data. |
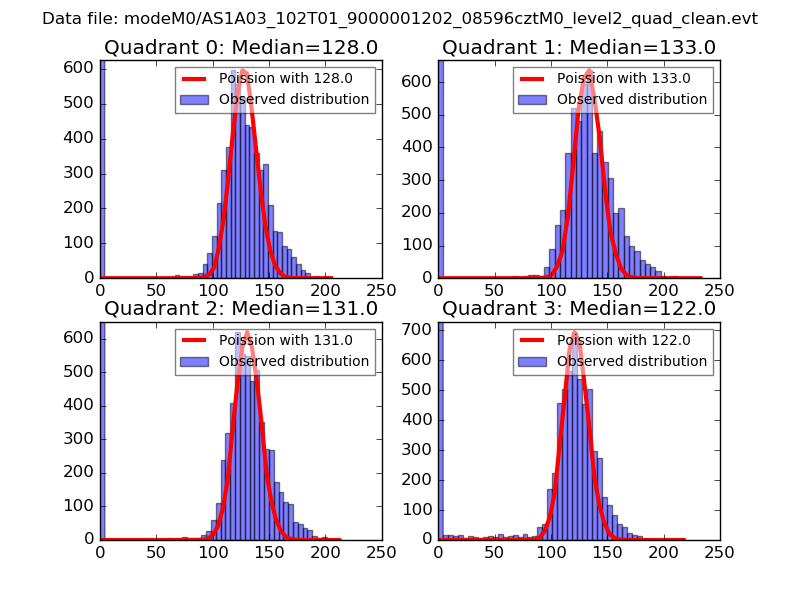 |
 |
| Quadrant-wise count rates Data is divided into 100 sec bins |
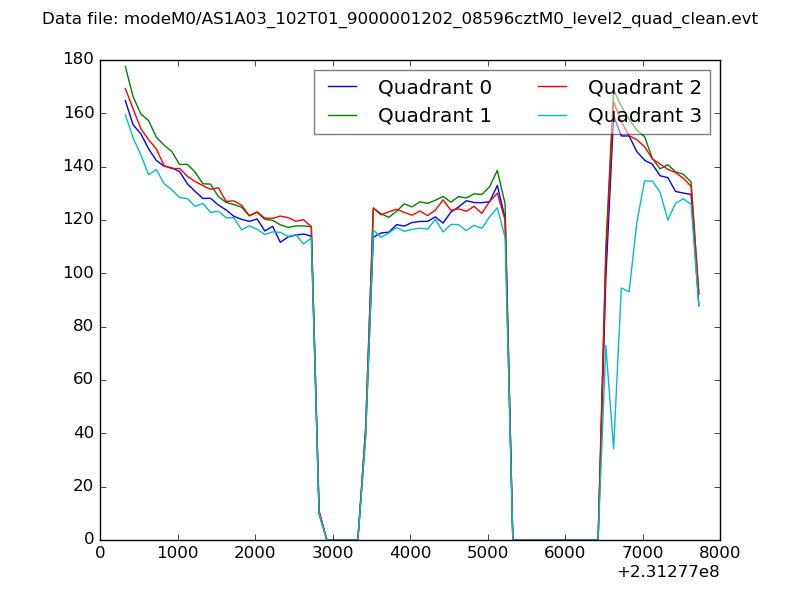 |
|
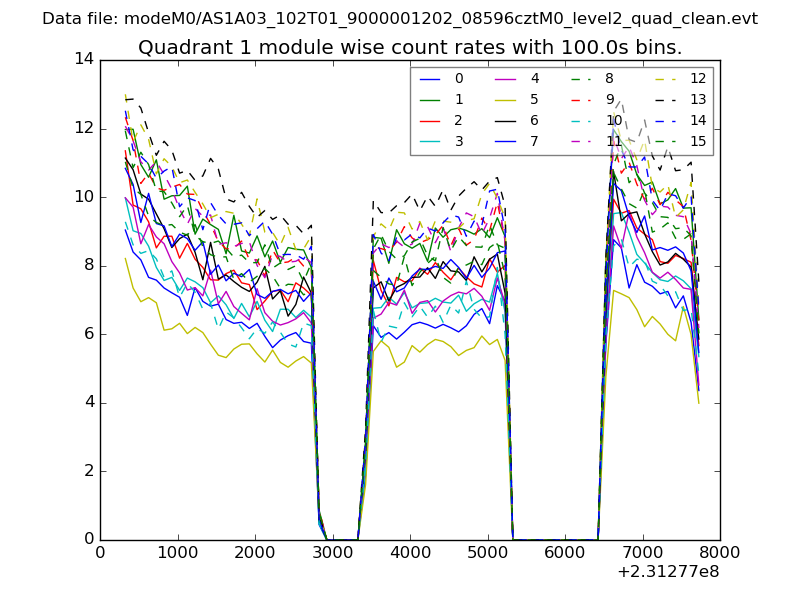
| Module-wise count rates for Quadrant A Data is divided into 100 sec bins |
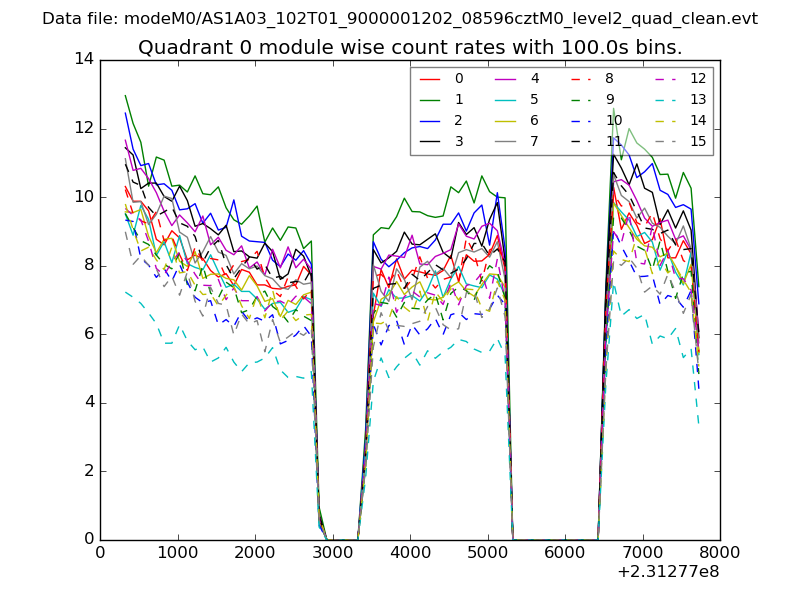 |
 |
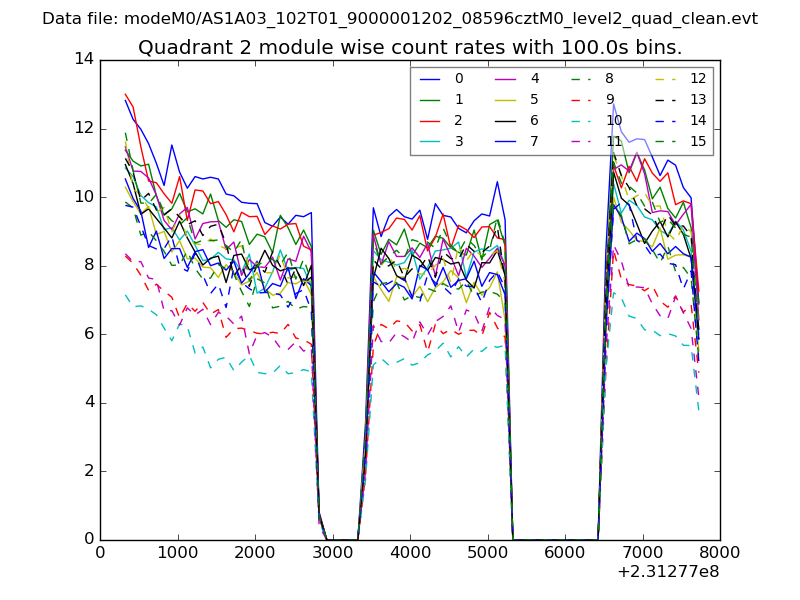
| Module-wise count rates for Quadrant B Data is divided into 100 sec bins |
 |
 |
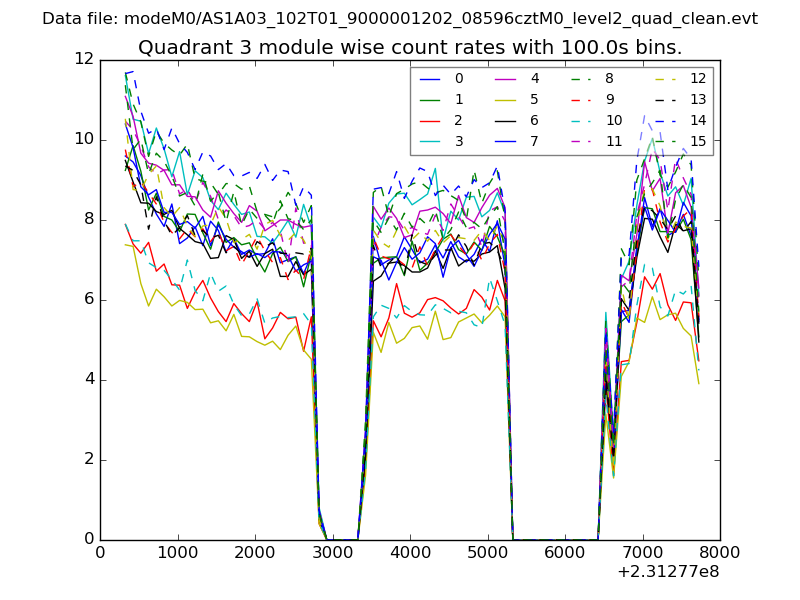
| Module-wise count rates for Quadrant C Data is divided into 100 sec bins |
 |
 |
| Module-wise count rates for Quadrant D Data is divided into 100 sec bins |
 |
 |
| Parameter | Plot |
|---|---|
| CZT HV Monitor | 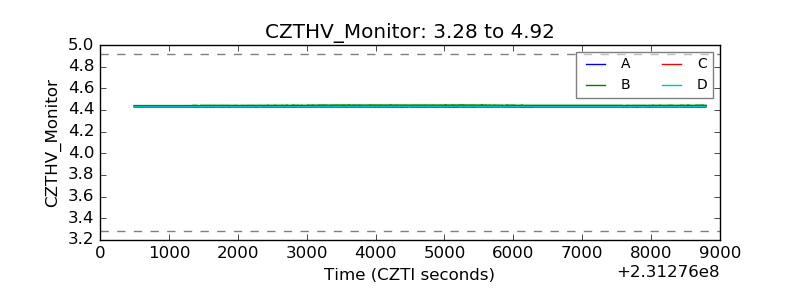 |
| D_VDD | 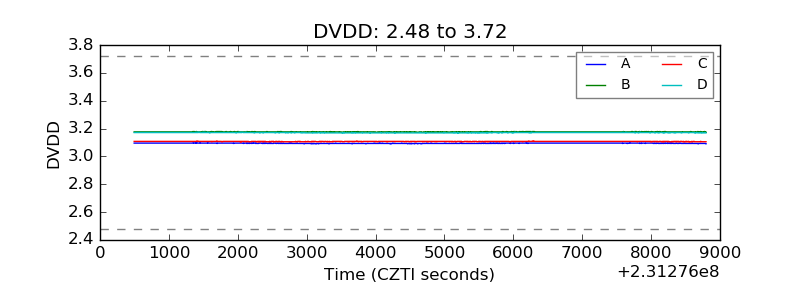 |
| Temperature 1 | 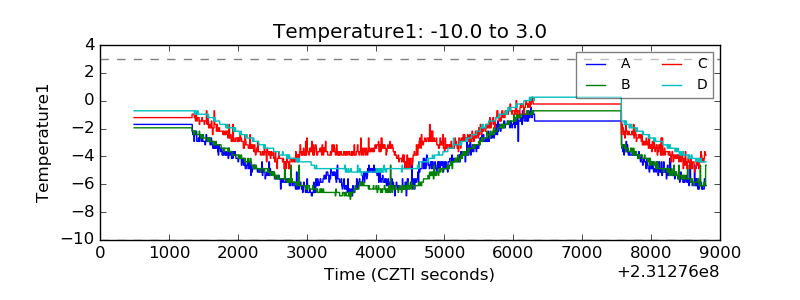 |
| Veto HV Monitor | 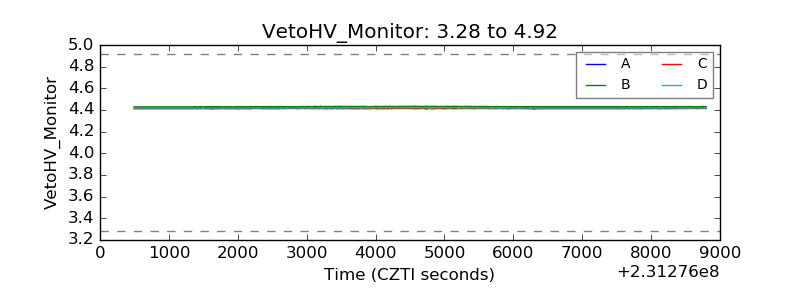 |
| Veto LLD | 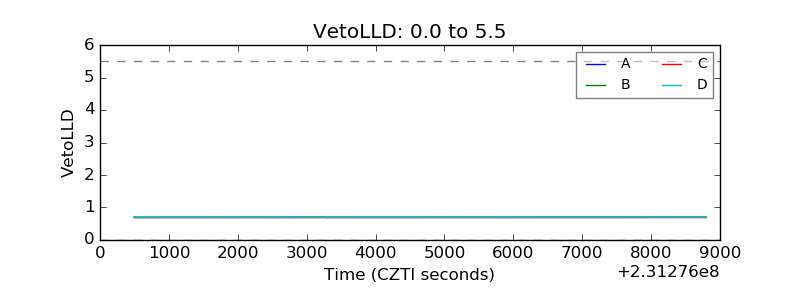 |
| Alpha Counter | 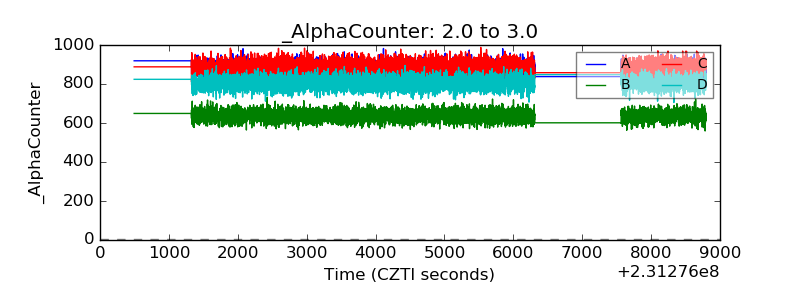 |
| _CPM_Rate | 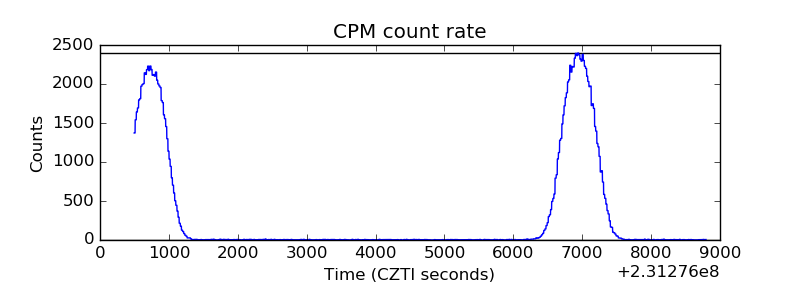 |
| CZT Counter | 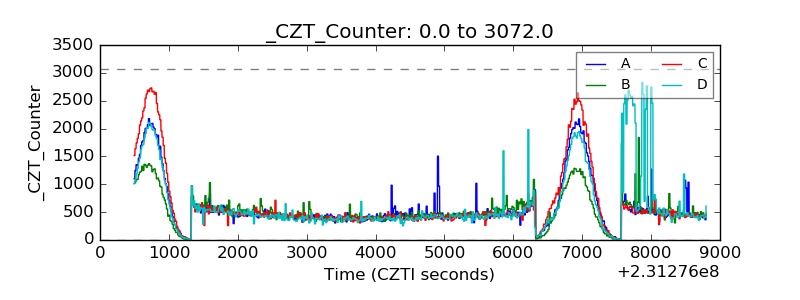 |
| +2.5 Volts monitor |  |
| +5 Volts monitor |  |
| _ROLL_ROT | 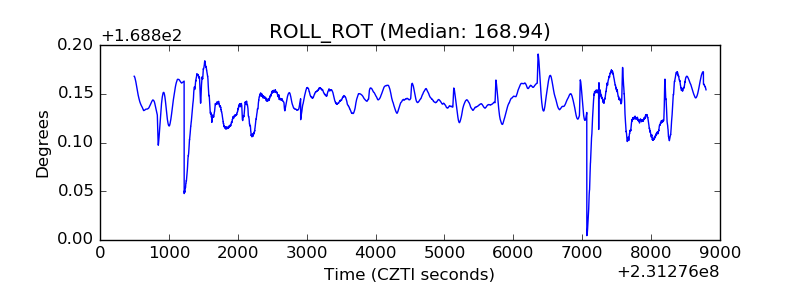 |
| _Roll_DEC | 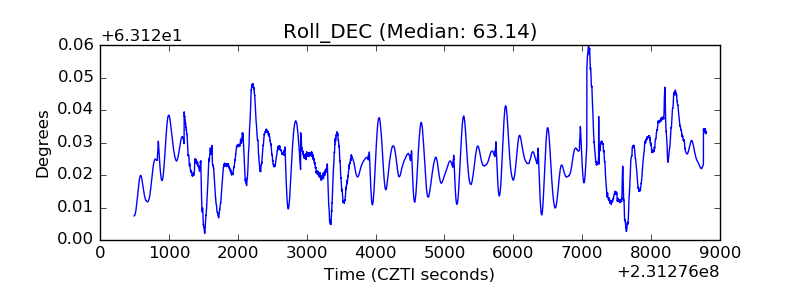 |
| _Roll_RA | 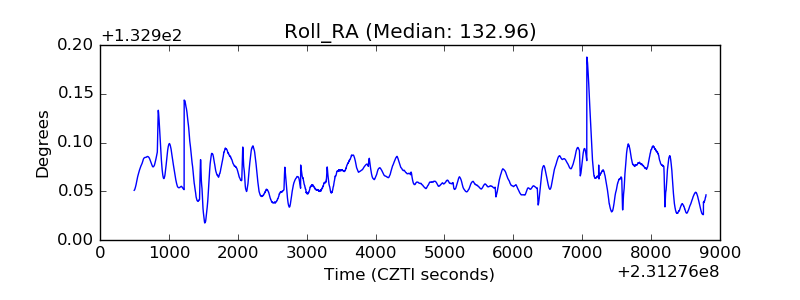 |
| Veto Counter | 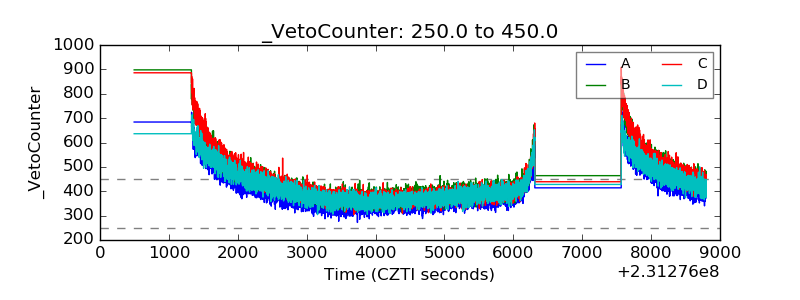 |