| Param | Original file | Final file |
|---|---|---|
| Filename | modeM0/AS1A03_102T01_9000001202_08597cztM0_level2.evt | modeM0/AS1A03_102T01_9000001202_08597cztM0_level2_quad_clean.evt |
| Size (bytes) | 405,270,720 | 103,844,160 |
| Size | 386.5 MB | 99.0 MB |
| Events in quadrant A | 2,946,412 | 679,203 |
| Events in quadrant B | 3,086,252 | 714,668 |
| Events in quadrant C | 2,698,154 | 708,637 |
| Events in quadrant D | 3,138,950 | 627,975 |
| Mode M9 | |||
|---|---|---|---|
| Quadrant | BADHDUFLAG | Total packets | Discarded packets |
| A | 0 | 21 | 0 |
| B | 0 | 21 | 0 |
| C | 0 | 21 | 1 |
| D | 0 | 22 | 0 |
| Mode SS | |||
|---|---|---|---|
| Quadrant | BADHDUFLAG | Total packets | Discarded packets |
| A | 0 | 126 | 0 |
| B | 0 | 126 | 4 |
| C | 0 | 126 | 4 |
| D | 0 | 126 | 8 |
| Mode M0 | |||
|---|---|---|---|
| Quadrant | BADHDUFLAG | Total packets | Discarded packets |
| A | 0 | 13344 | 492 |
| B | 0 | 13548 | 464 |
| C | 0 | 12562 | 340 |
| D | 0 | 15052 | 1405 |
| Quadrant | Total seconds | Saturated seconds | Saturation percentage |
|---|---|---|---|
| A | 5932 | 86 | 1.449764% |
| B | 5937 | 68 | 1.145360% |
| C | 5981 | 16 | 0.267514% |
| D | 5846 | 212 | 3.626411% |
Noise dominated data is calculated using 1-second bins in cleaned event files. If a bin has >2000 counts, and if more than 50% of those come from <1% of pixels, then it is considered to be noise-dominated and hence unusable.
| Quadrant | # 1 sec bins | Bins with >0 counts | Bins with >2000 counts | High rate bins dominated by noise | Noise dominated (total time) | Noise dominated (detector-on time) | Marked lightcurve |
|---|---|---|---|---|---|---|---|
| A | 7437 | 6077 | 43 | 43 | 0.58% | 0.71% | 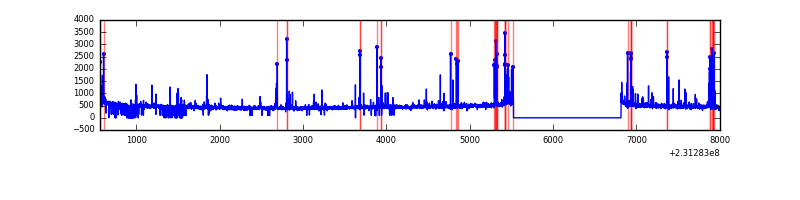 |
| B | 7437 | 6088 | 10 | 10 | 0.13% | 0.16% | 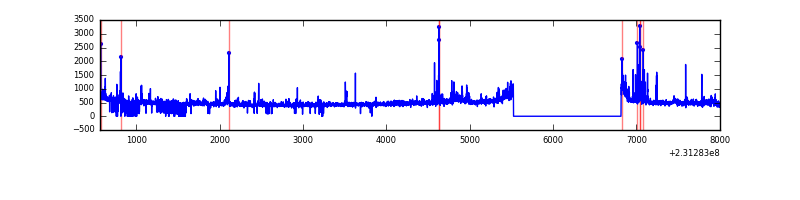 |
| C | 7437 | 6108 | 0 | 0 | 0.00% | 0.00% | 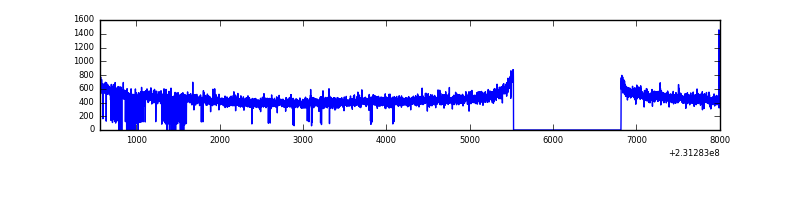 |
| D | 7437 | 5976 | 168 | 168 | 2.26% | 2.81% | 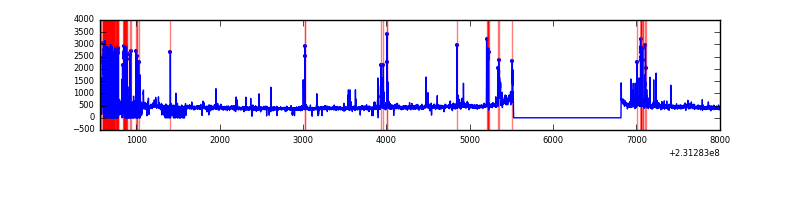 |
Top three noisy pixels from each quadrant. If the there are fewer than three noisy pixels in the level2.evt file, extra rows are filled as -1
| Pixel properties | Quadrant properties | ||||||
|---|---|---|---|---|---|---|---|
| Quadrant | DetID | PixID | Counts | Sigma | Mean | Median | Sigma |
| A | 5 | 16 | 144487 | 1033.13 | 687 | 673 | 139.2 |
| A | 13 | 248 | 107596 | 768.11 | 687 | 673 | 139.2 |
| A | 15 | 223 | 25408 | 177.69 | 687 | 673 | 139.2 |
| B | 0 | 214 | 109359 | 817.61 | 708 | 690 | 132.9 |
| B | 0 | 219 | 54578 | 405.44 | 708 | 690 | 132.9 |
| B | 0 | 213 | 53879 | 400.19 | 708 | 690 | 132.9 |
| C | 13 | 61 | 5323 | 29.09 | 690 | 692 | 159.2 |
| C | 12 | 4 | 3110 | 15.19 | 690 | 692 | 159.2 |
| C | 12 | 16 | 2409 | 10.78 | 690 | 692 | 159.2 |
| D | 10 | 253 | 451897 | 2875.22 | 647 | 627 | 157.0 |
| D | 7 | 71 | 70140 | 442.89 | 647 | 627 | 157.0 |
| D | 9 | 102 | 50773 | 319.5 | 647 | 627 | 157.0 |
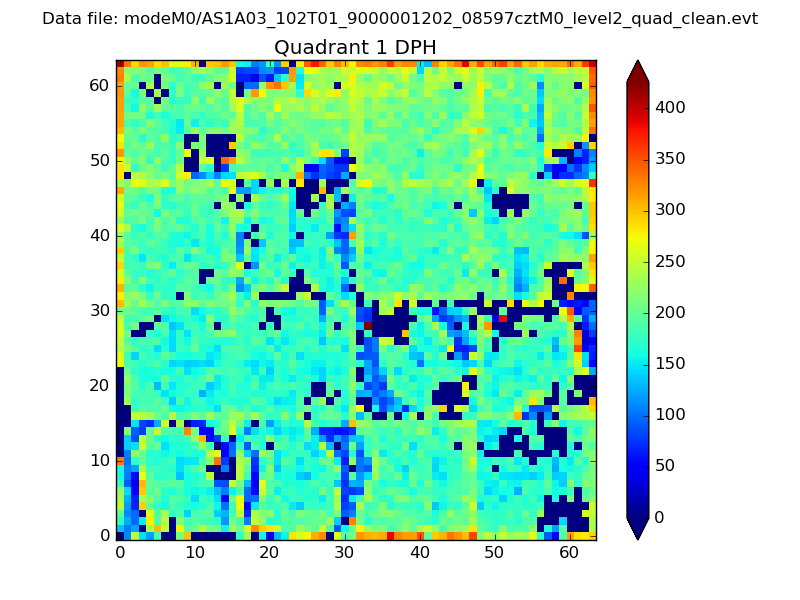
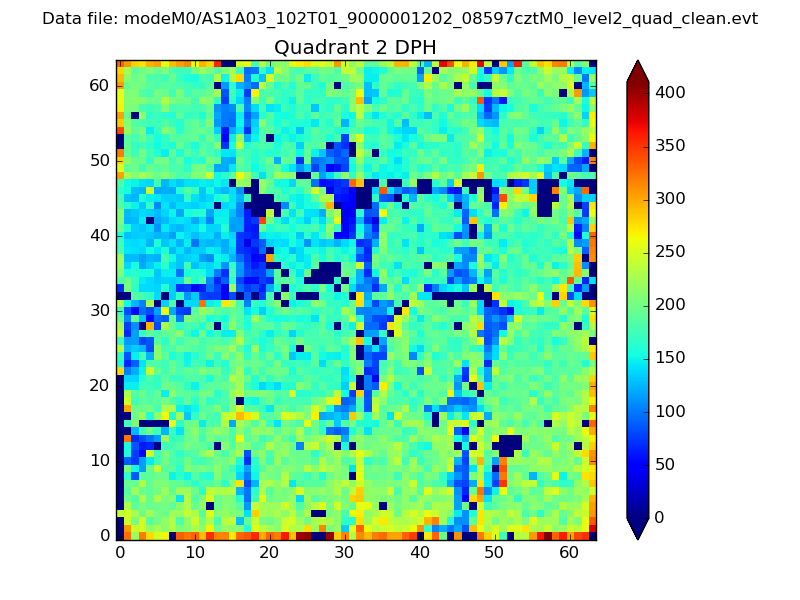
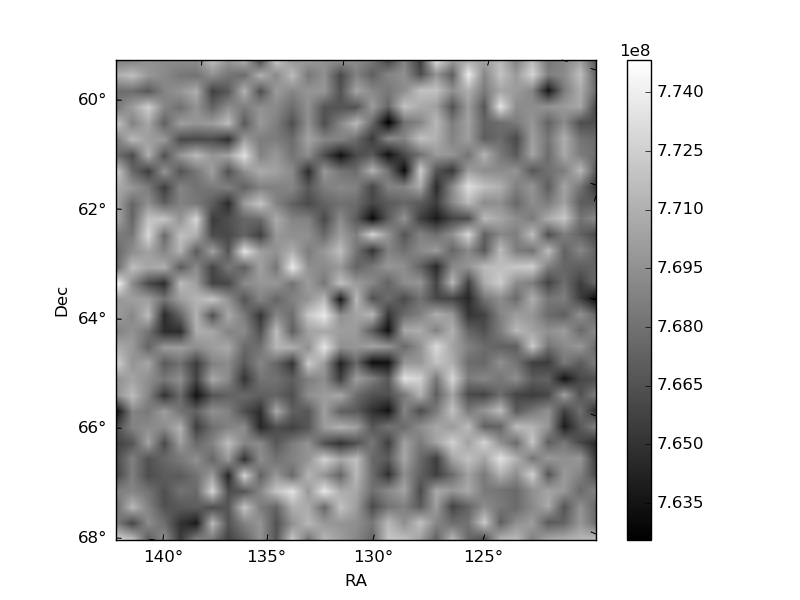
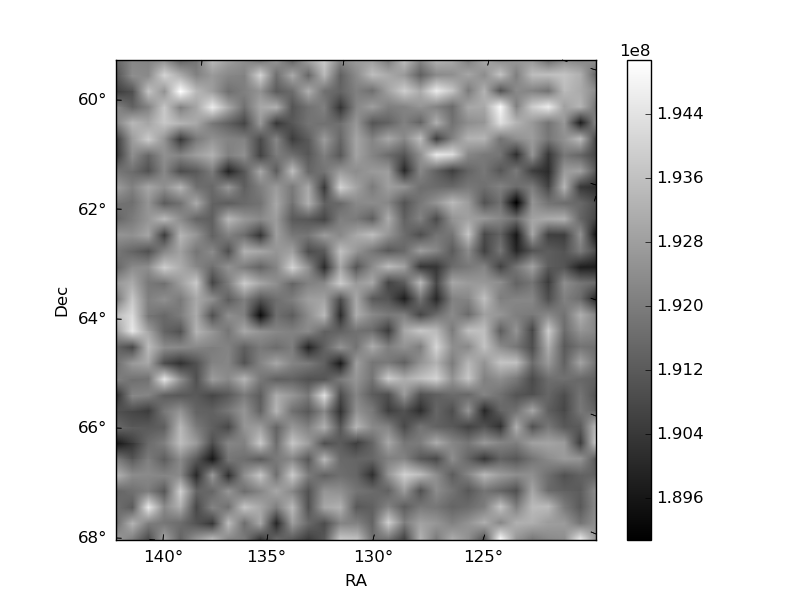
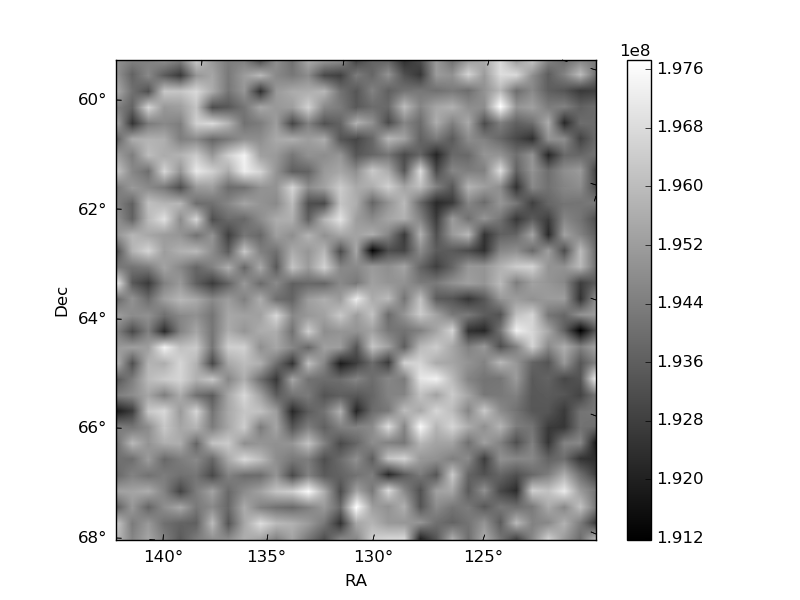
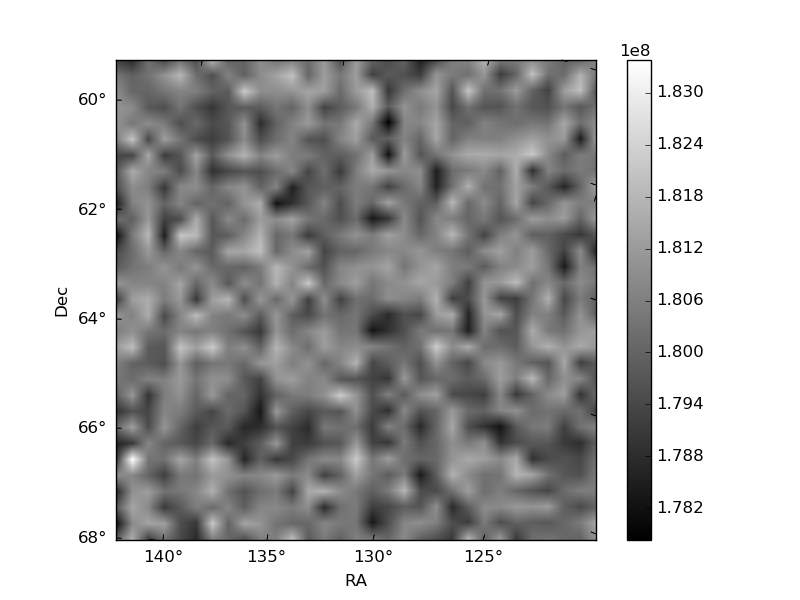
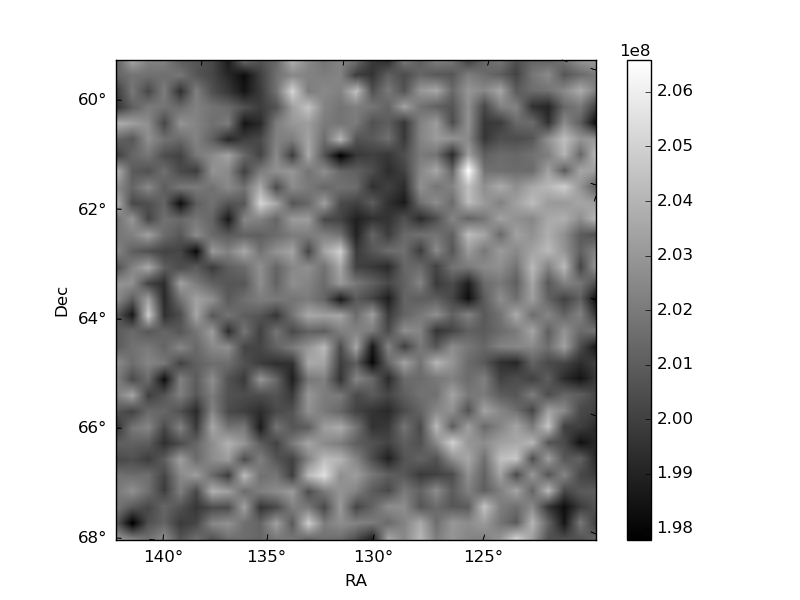
Histogram calculated using DETX and DETY for each event in the final _common_clean file
| Quadrant A |  |
 |
Quadrant B |
|---|---|---|---|
| Quadrant D | 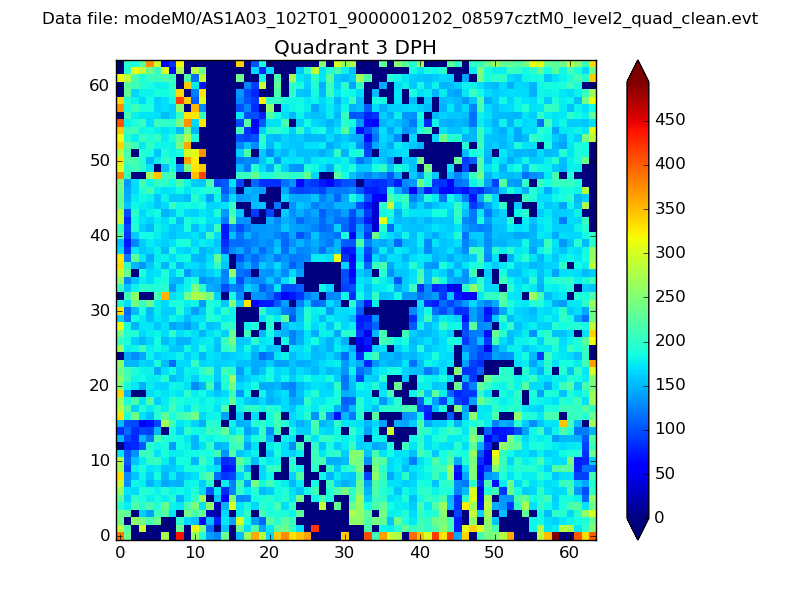 |
 |
Quadrant C |
| Plot type | Count rate plots | Images |
|---|---|---|
| Comparison with Poisson distribution Blue bars denote a histogram of data divided into 1 sec bins. Red curve is a Poisson curve with rate = median count rate of data. |
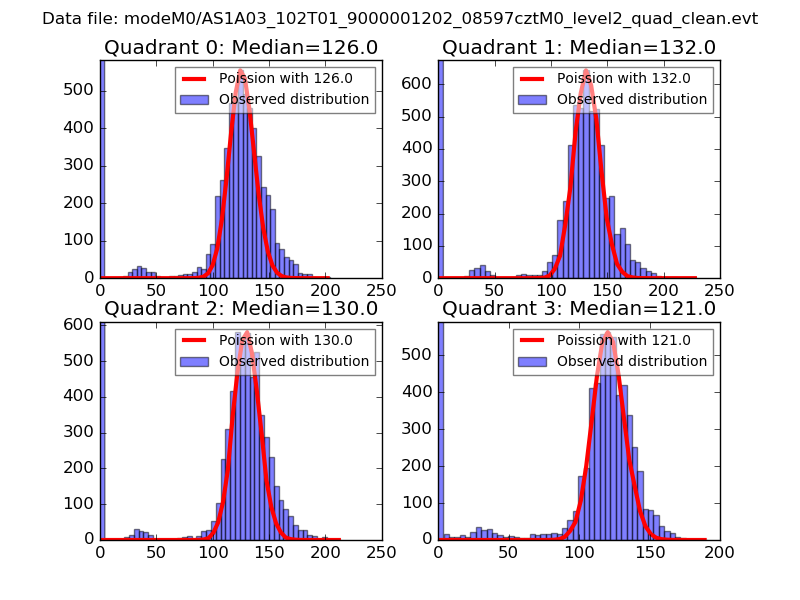 |
 |
| Quadrant-wise count rates Data is divided into 100 sec bins |
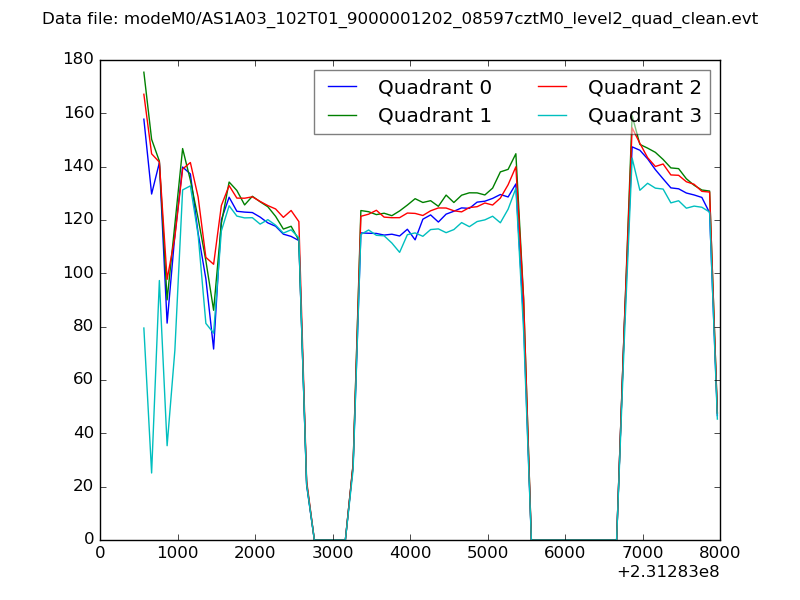 |
|
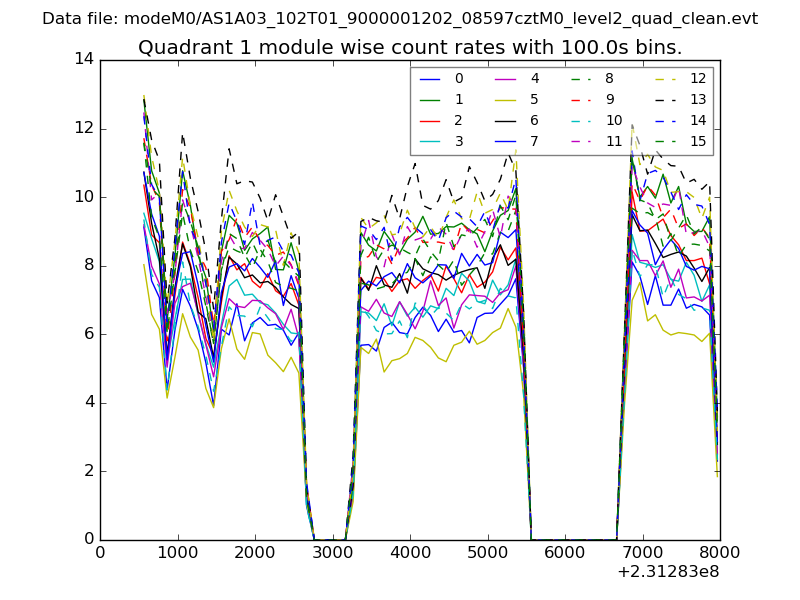
| Module-wise count rates for Quadrant A Data is divided into 100 sec bins |
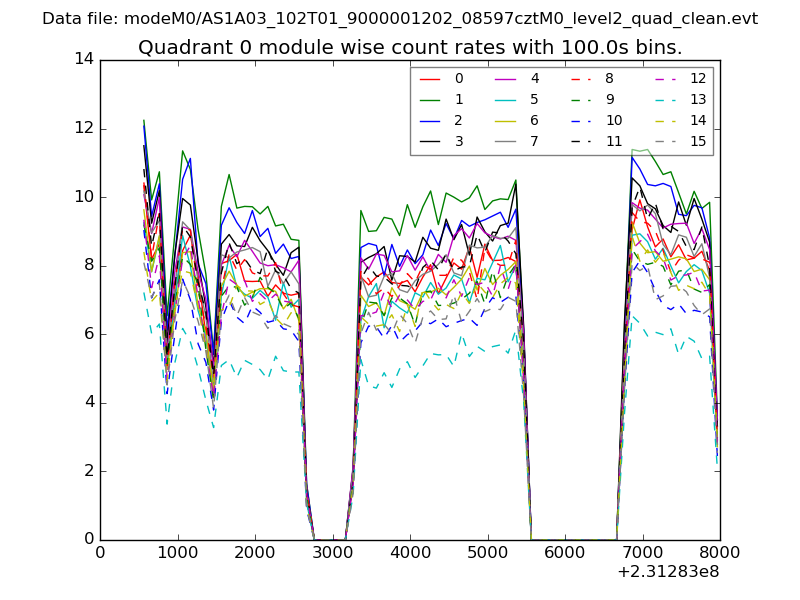 |
 |
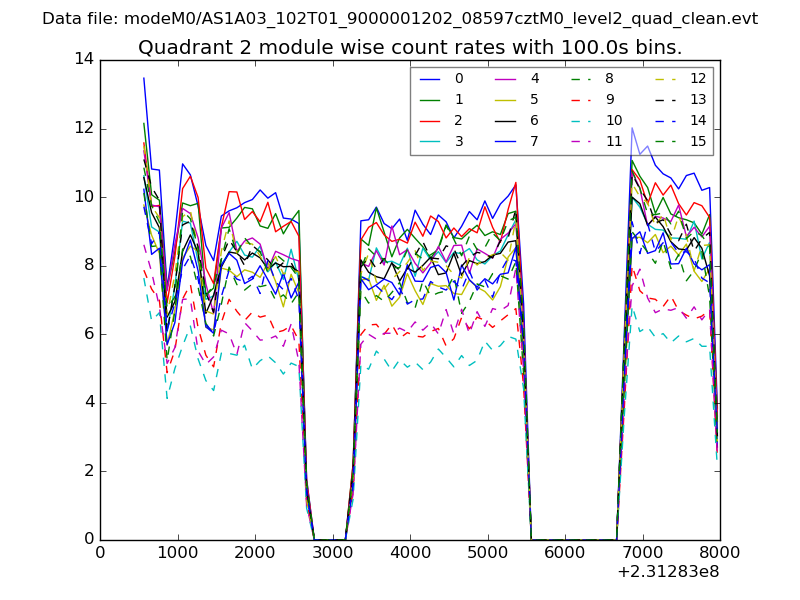
| Module-wise count rates for Quadrant B Data is divided into 100 sec bins |
 |
 |
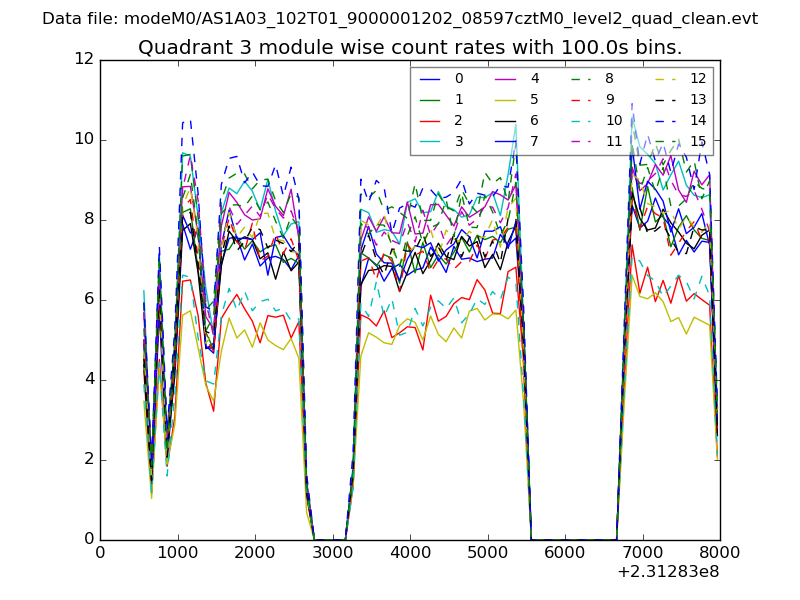
| Module-wise count rates for Quadrant C Data is divided into 100 sec bins |
 |
 |
| Module-wise count rates for Quadrant D Data is divided into 100 sec bins |
 |
 |
| Parameter | Plot |
|---|---|
| CZT HV Monitor | 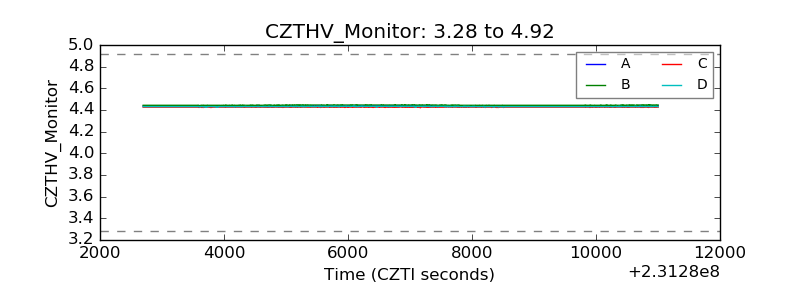 |
| D_VDD | 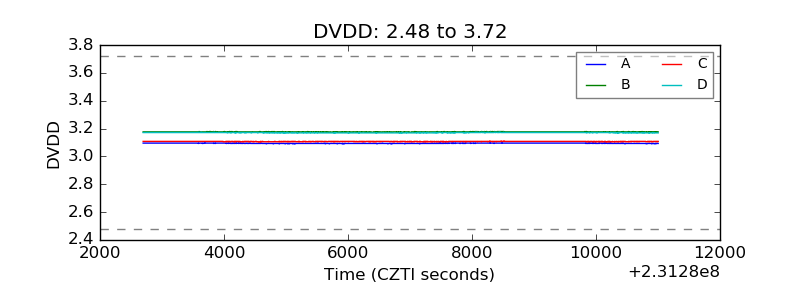 |
| Temperature 1 | 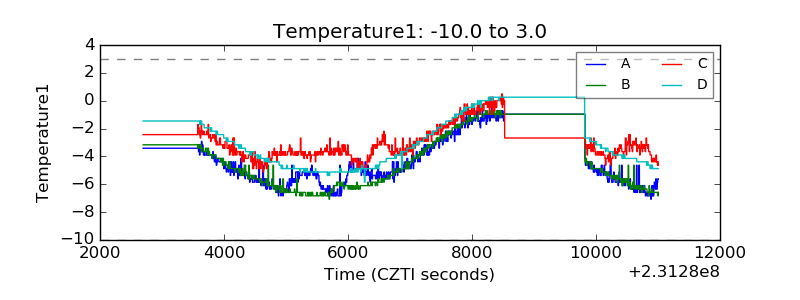 |
| Veto HV Monitor | 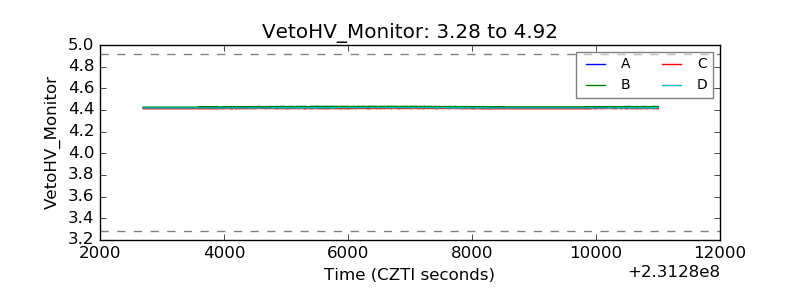 |
| Veto LLD | 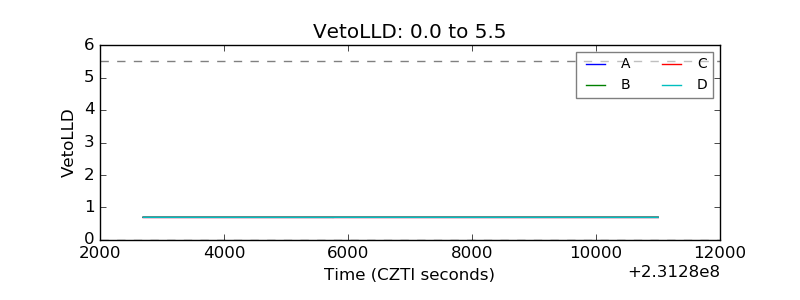 |
| Alpha Counter | 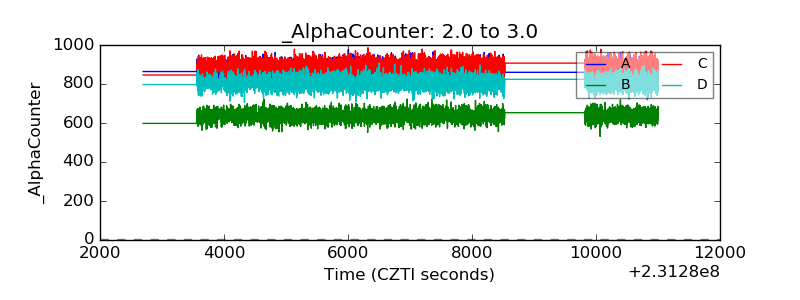 |
| _CPM_Rate | 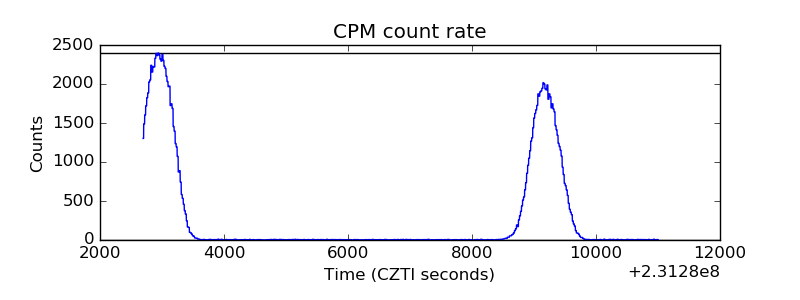 |
| CZT Counter | 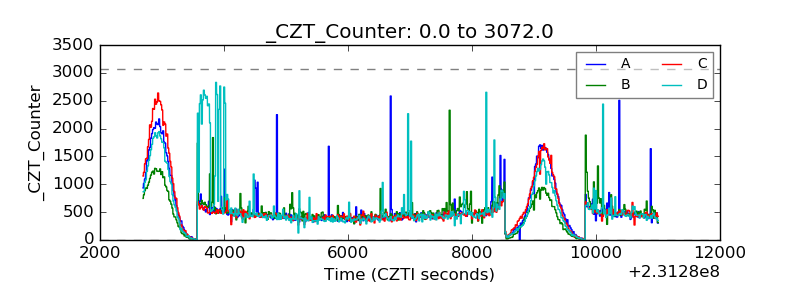 |
| +2.5 Volts monitor |  |
| +5 Volts monitor |  |
| _ROLL_ROT | 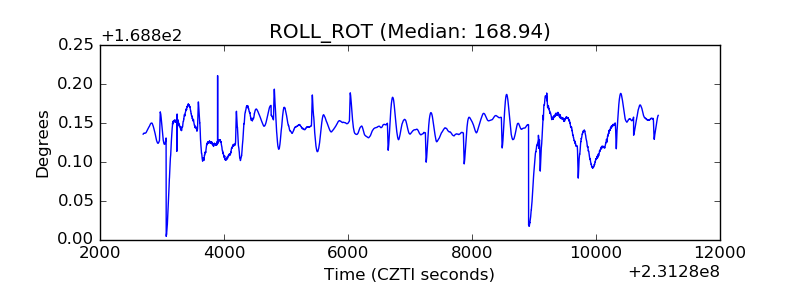 |
| _Roll_DEC | 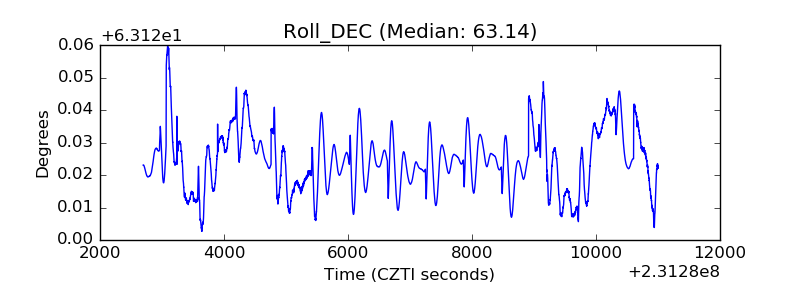 |
| _Roll_RA | 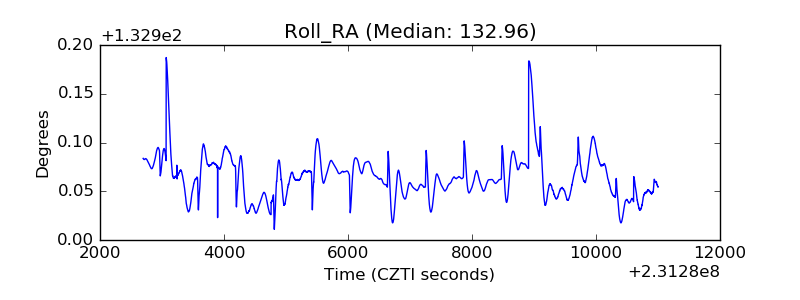 |
| Veto Counter | 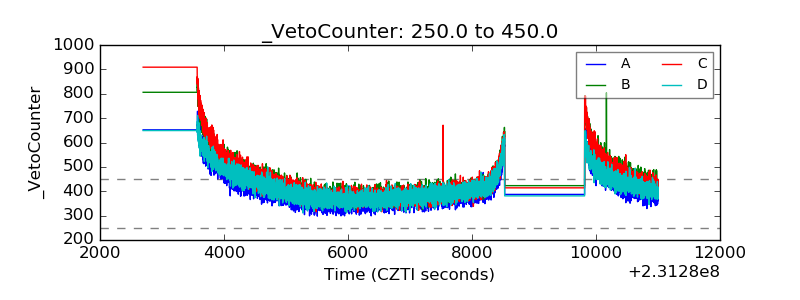 |