| Param | Original file | Final file |
|---|---|---|
| Filename | modeM0/AS1A03_102T01_9000001202_08599cztM0_level2.evt | modeM0/AS1A03_102T01_9000001202_08599cztM0_level2_quad_clean.evt |
| Size (bytes) | 1,079,127,360 | 262,995,840 |
| Size | 1.0 GB | 250.8 MB |
| Events in quadrant A | 8,214,690 | 1,696,111 |
| Events in quadrant B | 8,054,839 | 1,770,039 |
| Events in quadrant C | 7,141,363 | 1,736,257 |
| Events in quadrant D | 8,164,552 | 1,636,716 |
| Mode M9 | |||
|---|---|---|---|
| Quadrant | BADHDUFLAG | Total packets | Discarded packets |
| A | 0 | 37 | 0 |
| B | 0 | 37 | 0 |
| C | 0 | 37 | 0 |
| D | 0 | 37 | 0 |
| Mode SS | |||
|---|---|---|---|
| Quadrant | BADHDUFLAG | Total packets | Discarded packets |
| A | 0 | 332 | 0 |
| B | 0 | 332 | 0 |
| C | 0 | 332 | 0 |
| D | 0 | 332 | 0 |
| Mode M0 | |||
|---|---|---|---|
| Quadrant | BADHDUFLAG | Total packets | Discarded packets |
| A | 0 | 36040 | 7 |
| B | 0 | 34926 | 4 |
| C | 0 | 33210 | 4 |
| D | 0 | 36395 | 4 |
| Quadrant | Total seconds | Saturated seconds | Saturation percentage |
|---|---|---|---|
| A | 16342 | 298 | 1.823522% |
| B | 16343 | 150 | 0.917824% |
| C | 16343 | 45 | 0.275347% |
| D | 16343 | 146 | 0.893349% |
Noise dominated data is calculated using 1-second bins in cleaned event files. If a bin has >2000 counts, and if more than 50% of those come from <1% of pixels, then it is considered to be noise-dominated and hence unusable.
| Quadrant | # 1 sec bins | Bins with >0 counts | Bins with >2000 counts | High rate bins dominated by noise | Noise dominated (total time) | Noise dominated (detector-on time) | Marked lightcurve |
|---|---|---|---|---|---|---|---|
| A | 20043 | 16347 | 179 | 179 | 0.89% | 1.10% | 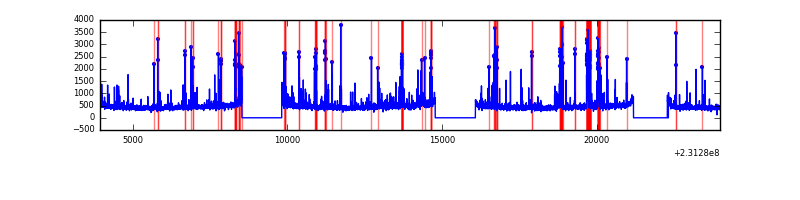 |
| B | 20043 | 16347 | 17 | 17 | 0.08% | 0.10% | 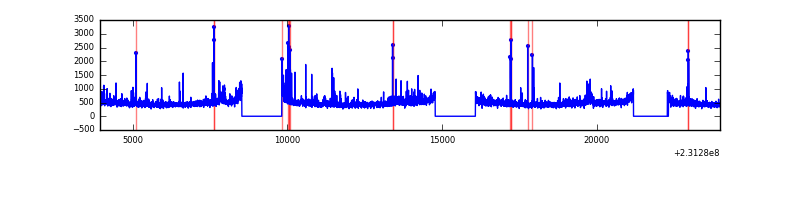 |
| C | 20043 | 16347 | 0 | 0 | 0.00% | 0.00% | 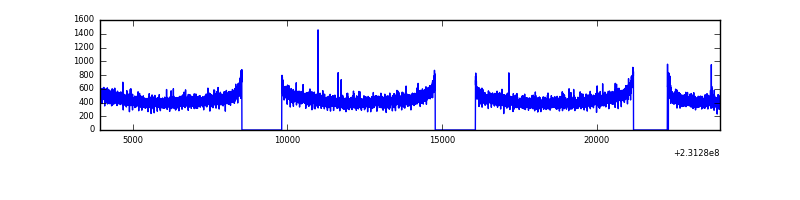 |
| D | 20043 | 16346 | 78 | 78 | 0.39% | 0.48% | 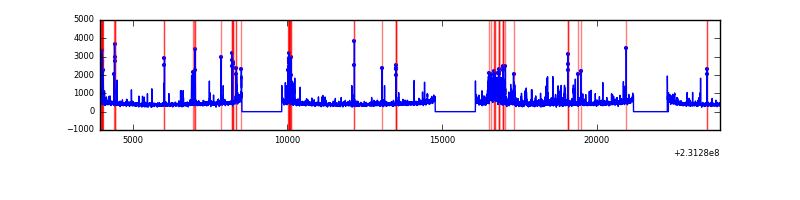 |
Top three noisy pixels from each quadrant. If the there are fewer than three noisy pixels in the level2.evt file, extra rows are filled as -1
| Pixel properties | Quadrant properties | ||||||
|---|---|---|---|---|---|---|---|
| Quadrant | DetID | PixID | Counts | Sigma | Mean | Median | Sigma |
| A | 5 | 16 | 434589 | 1172.03 | 1848 | 1809 | 369.3 |
| A | 13 | 248 | 416602 | 1123.32 | 1848 | 1809 | 369.3 |
| A | 15 | 223 | 173459 | 464.85 | 1848 | 1809 | 369.3 |
| B | 0 | 214 | 308433 | 867.22 | 1896 | 1846 | 353.5 |
| B | 0 | 219 | 79457 | 219.53 | 1896 | 1846 | 353.5 |
| B | 0 | 213 | 65154 | 179.07 | 1896 | 1846 | 353.5 |
| C | 13 | 61 | 14025 | 29.24 | 1824 | 1829 | 417.1 |
| C | 12 | 16 | 9118 | 17.47 | 1824 | 1829 | 417.1 |
| C | 12 | 4 | 7498 | 13.59 | 1824 | 1829 | 417.1 |
| D | 1 | 52 | 848203 | 1949.47 | 1800 | 1745 | 434.2 |
| D | 10 | 253 | 145518 | 331.12 | 1800 | 1745 | 434.2 |
| D | 7 | 71 | 133488 | 303.42 | 1800 | 1745 | 434.2 |
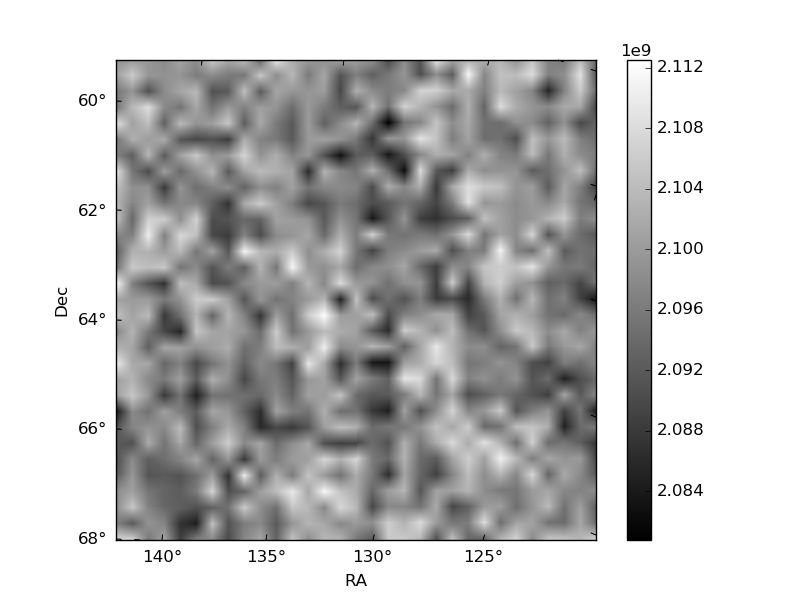
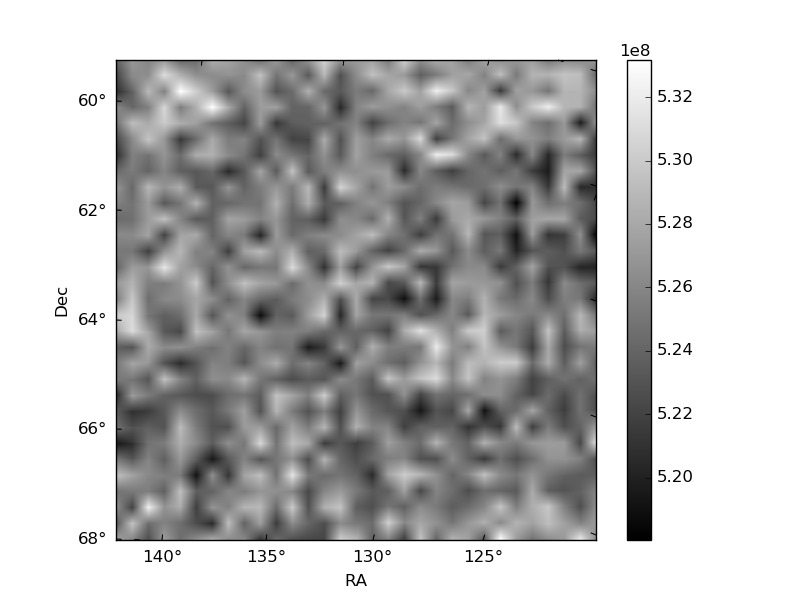
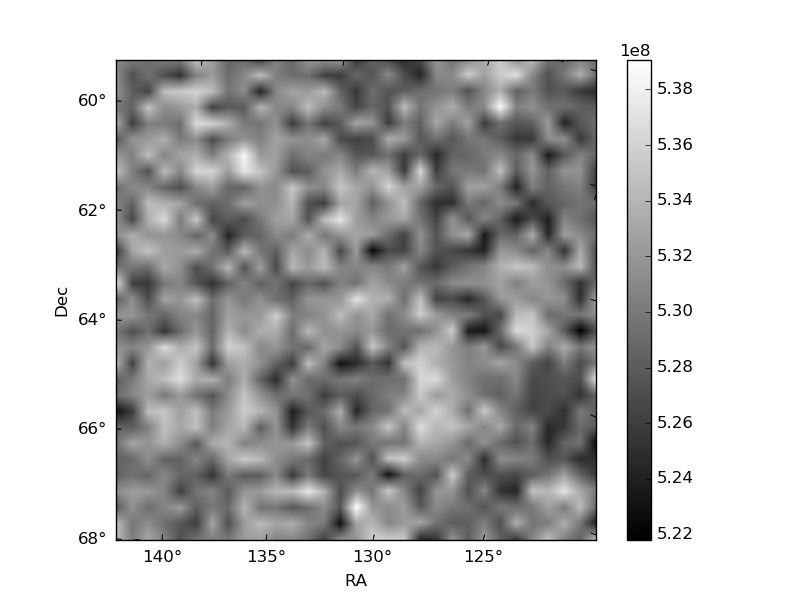
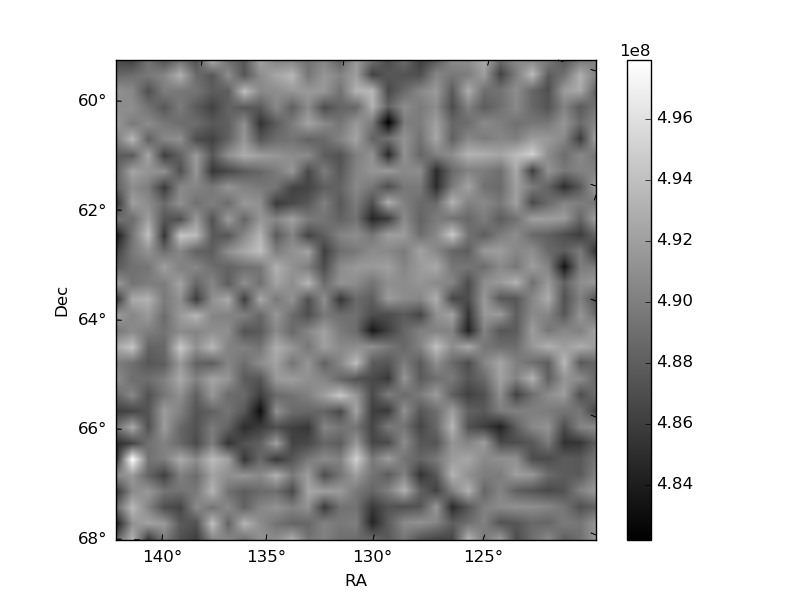
Histogram calculated using DETX and DETY for each event in the final _common_clean file
| Quadrant A | 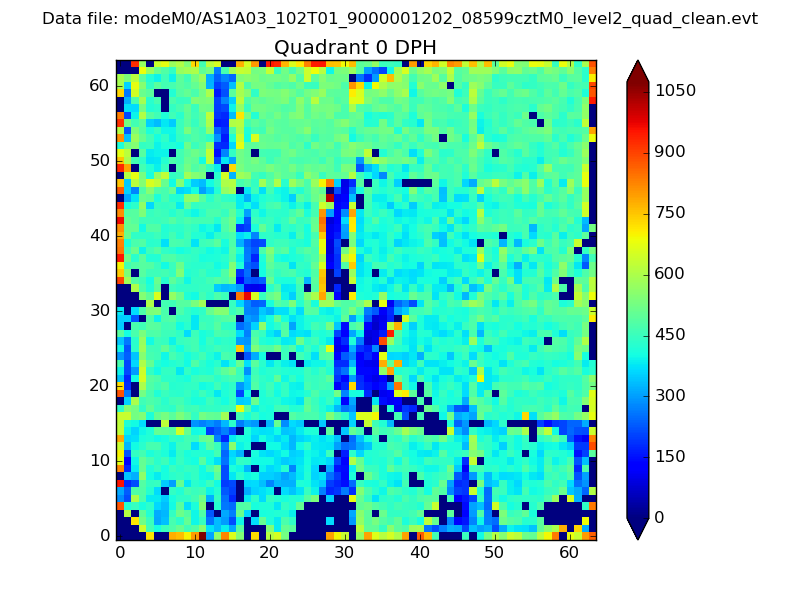 |
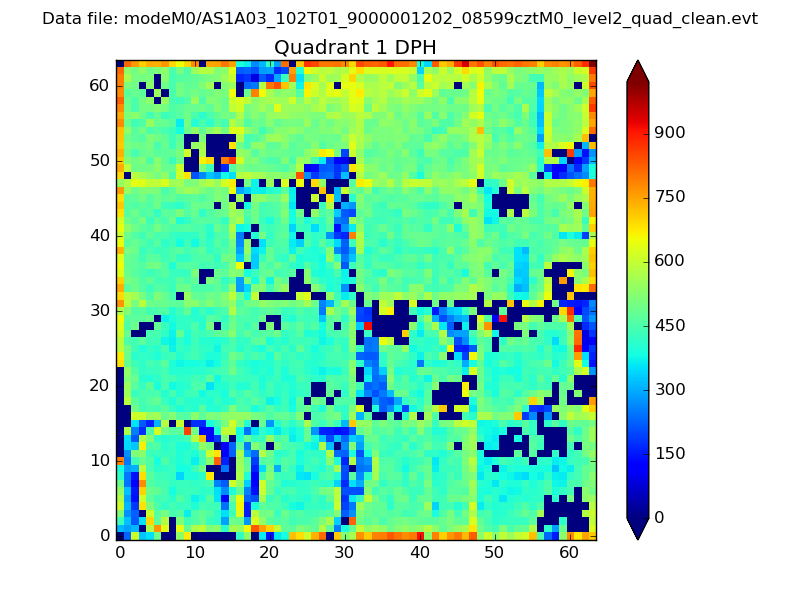 |
Quadrant B |
|---|---|---|---|
| Quadrant D |  |
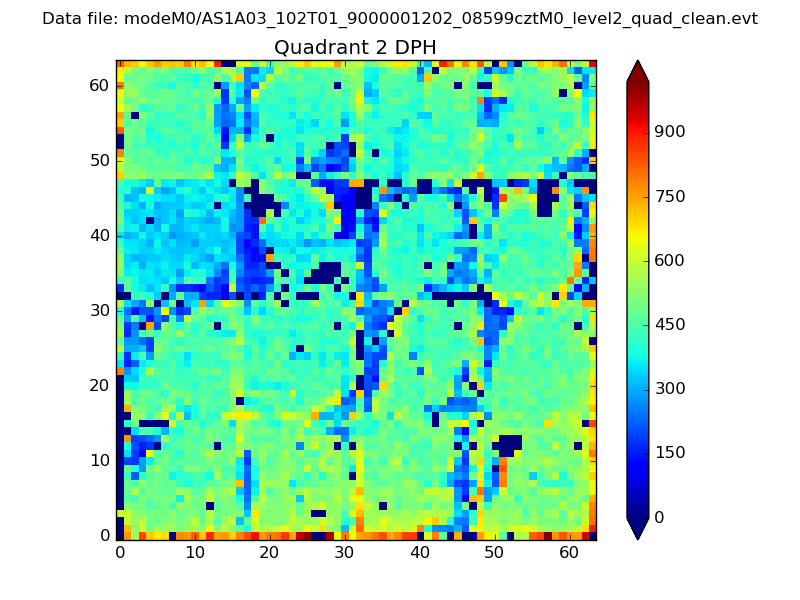 |
Quadrant C |
| Plot type | Count rate plots | Images |
|---|---|---|
| Comparison with Poisson distribution Blue bars denote a histogram of data divided into 1 sec bins. Red curve is a Poisson curve with rate = median count rate of data. |
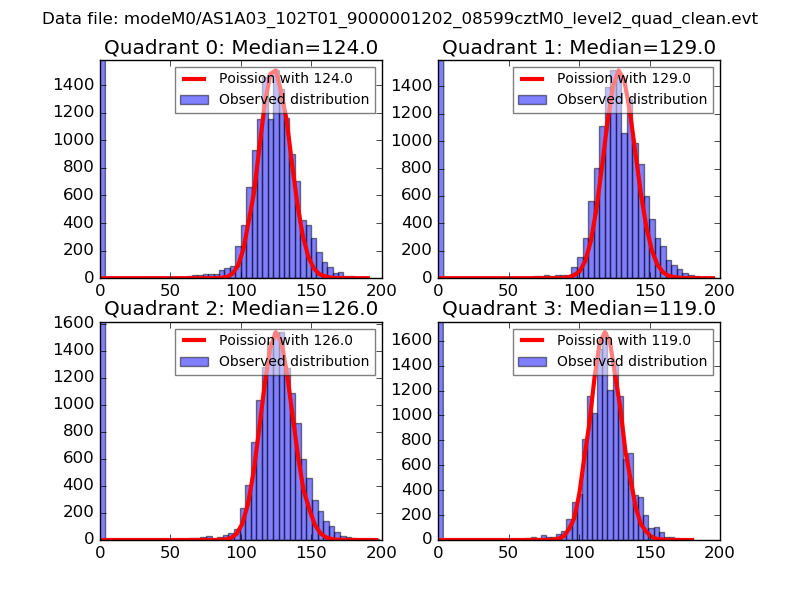 |
 |
| Quadrant-wise count rates Data is divided into 100 sec bins |
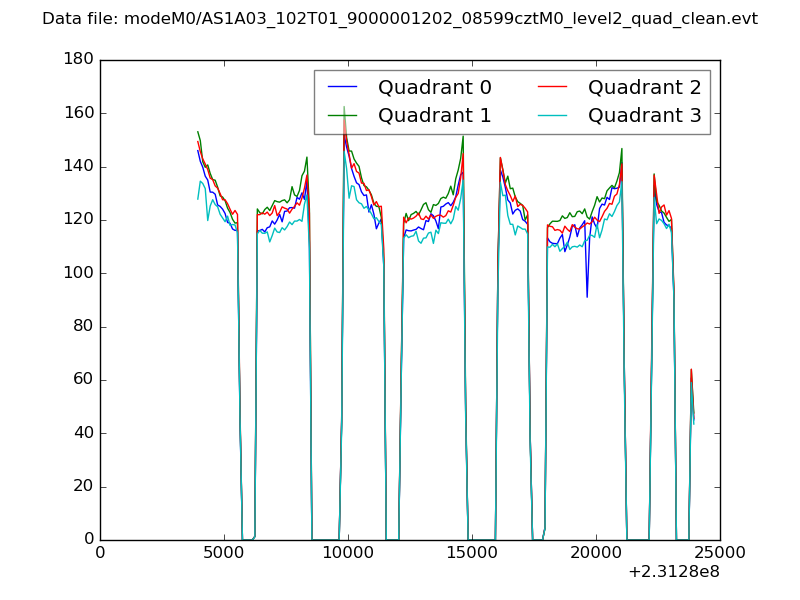 |
|
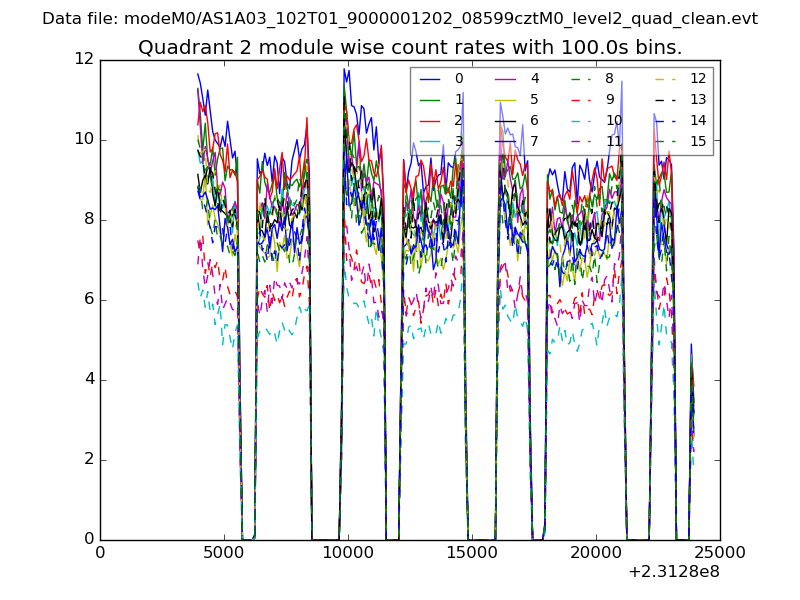
| Module-wise count rates for Quadrant A Data is divided into 100 sec bins |
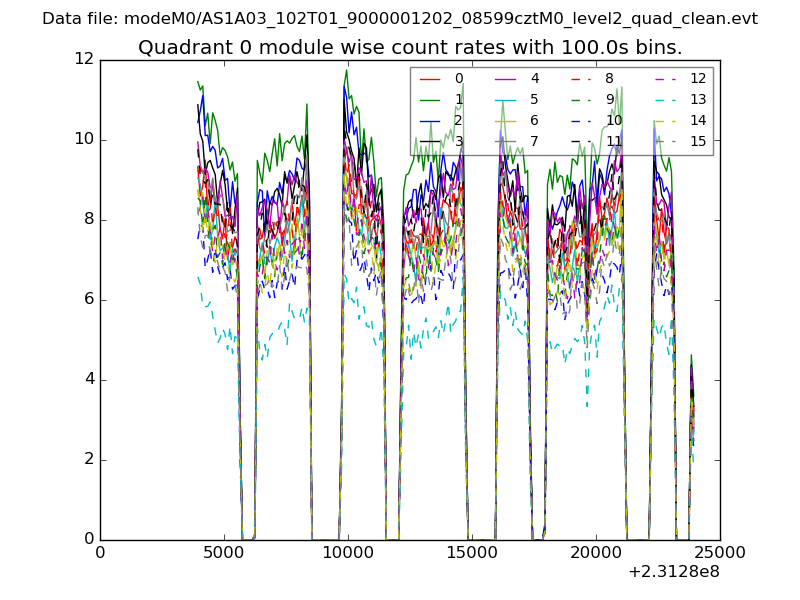 |
 |
| Module-wise count rates for Quadrant B Data is divided into 100 sec bins |
 |
 |
| Module-wise count rates for Quadrant C Data is divided into 100 sec bins |
 |
 |
| Module-wise count rates for Quadrant D Data is divided into 100 sec bins |
 |
 |
| Parameter | Plot |
|---|---|
| CZT HV Monitor | 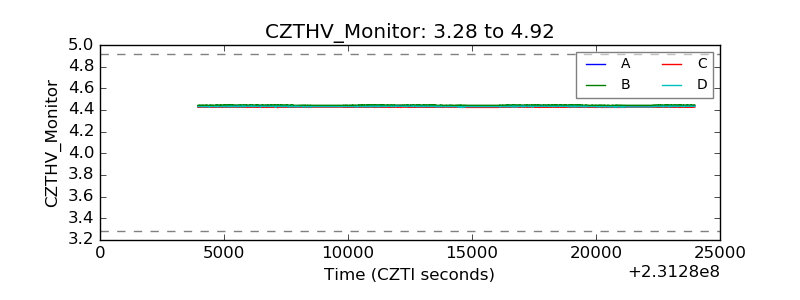 |
| D_VDD | 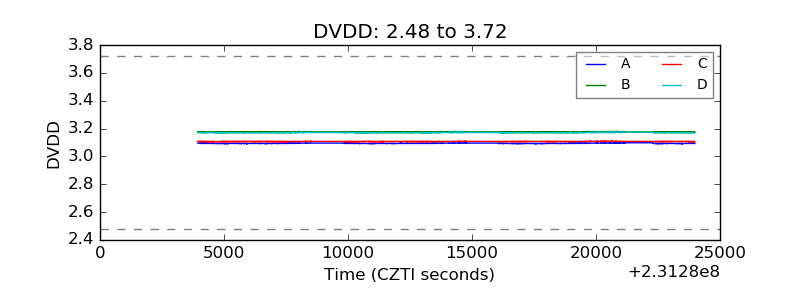 |
| Temperature 1 | 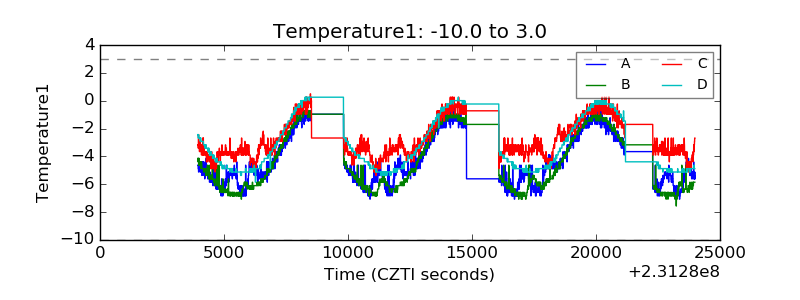 |
| Veto HV Monitor | 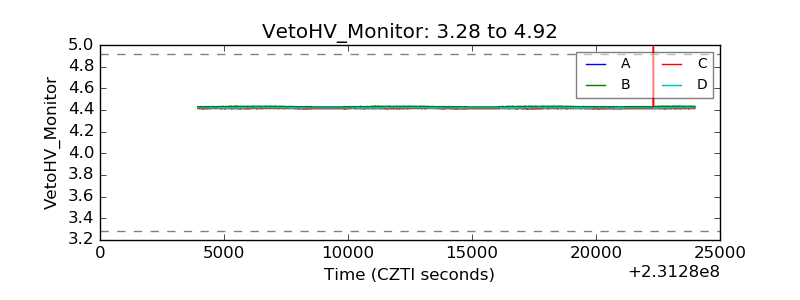 |
| Veto LLD | 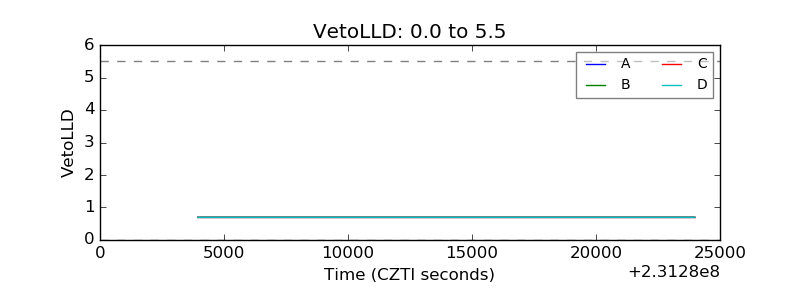 |
| Alpha Counter | 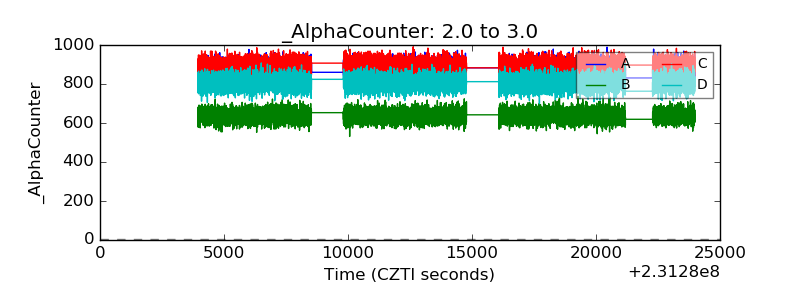 |
| _CPM_Rate | 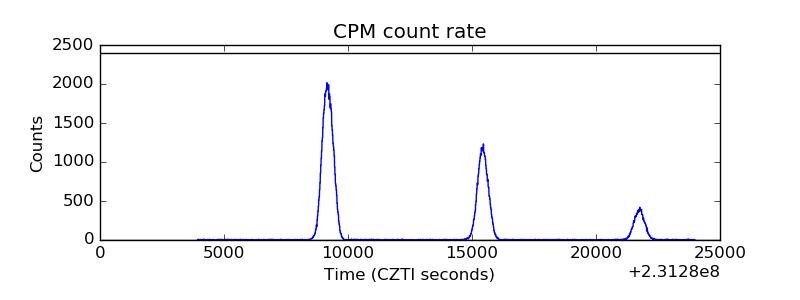 |
| CZT Counter | 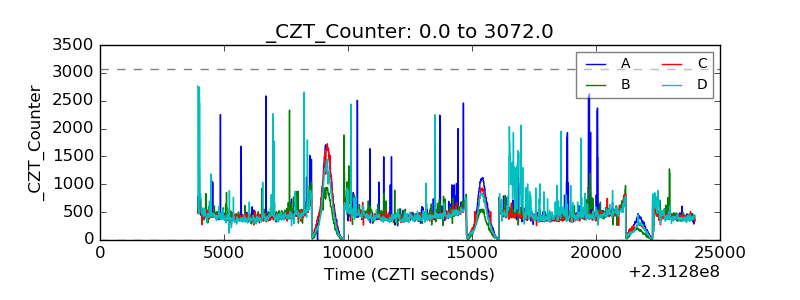 |
| +2.5 Volts monitor | 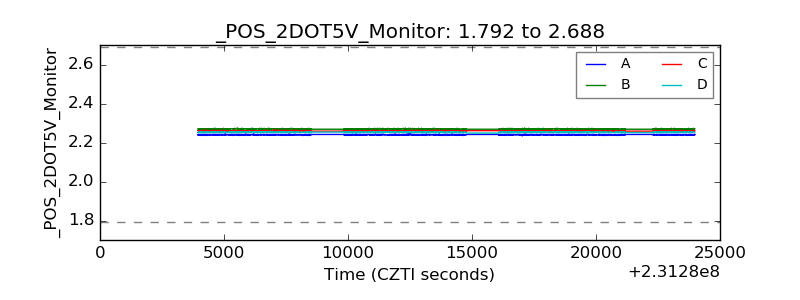 |
| +5 Volts monitor | 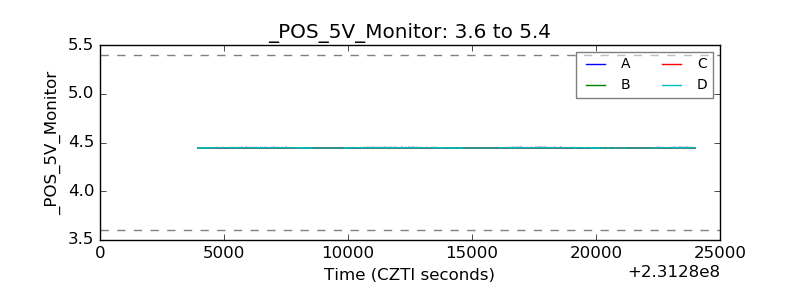 |
| _ROLL_ROT | 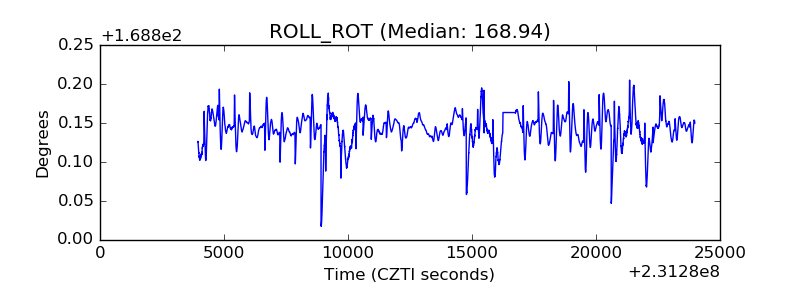 |
| _Roll_DEC | 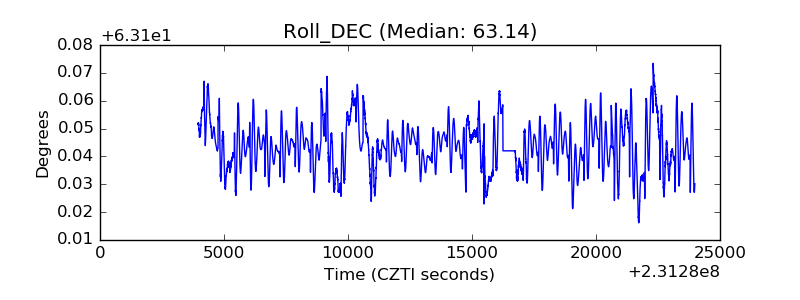 |
| _Roll_RA | 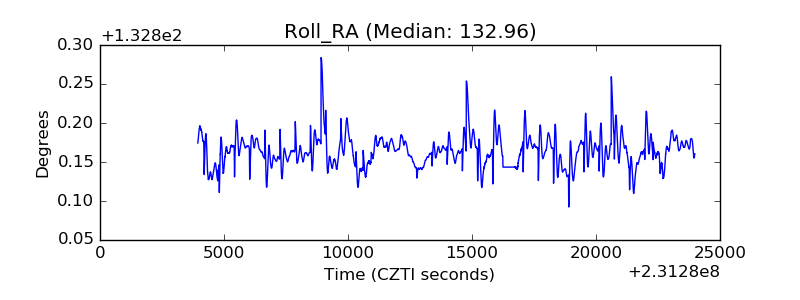 |
| Veto Counter | 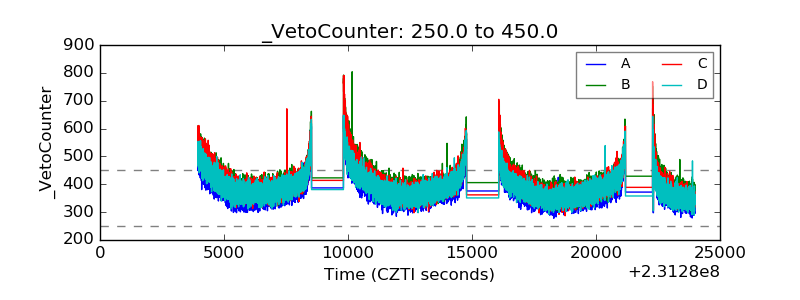 |