| Param | Original file | Final file |
|---|---|---|
| Filename | modeM0/AS1A03_102T01_9000001202_08600cztM0_level2.evt | modeM0/AS1A03_102T01_9000001202_08600cztM0_level2_quad_clean.evt |
| Size (bytes) | 433,088,640 | 90,244,800 |
| Size | 413.0 MB | 86.1 MB |
| Events in quadrant A | 2,945,576 | 581,388 |
| Events in quadrant B | 2,979,495 | 605,781 |
| Events in quadrant C | 2,700,695 | 589,625 |
| Events in quadrant D | 4,061,602 | 516,458 |
| Mode M9 | |||
|---|---|---|---|
| Quadrant | BADHDUFLAG | Total packets | Discarded packets |
| A | 0 | 8 | 0 |
| B | 0 | 8 | 0 |
| C | 0 | 8 | 0 |
| D | 0 | 8 | 0 |
| Mode SS | |||
|---|---|---|---|
| Quadrant | BADHDUFLAG | Total packets | Discarded packets |
| A | 0 | 128 | 0 |
| B | 0 | 128 | 0 |
| C | 0 | 128 | 0 |
| D | 0 | 128 | 0 |
| Mode M0 | |||
|---|---|---|---|
| Quadrant | BADHDUFLAG | Total packets | Discarded packets |
| A | 0 | 13427 | 2 |
| B | 0 | 13101 | 1 |
| C | 0 | 12748 | 1 |
| D | 0 | 16650 | 1 |
| Quadrant | Total seconds | Saturated seconds | Saturation percentage |
|---|---|---|---|
| A | 6295 | 118 | 1.874504% |
| B | 6295 | 73 | 1.159651% |
| C | 6295 | 37 | 0.587768% |
| D | 6295 | 573 | 9.102462% |
Noise dominated data is calculated using 1-second bins in cleaned event files. If a bin has >2000 counts, and if more than 50% of those come from <1% of pixels, then it is considered to be noise-dominated and hence unusable.
| Quadrant | # 1 sec bins | Bins with >0 counts | Bins with >2000 counts | High rate bins dominated by noise | Noise dominated (total time) | Noise dominated (detector-on time) | Marked lightcurve |
|---|---|---|---|---|---|---|---|
| A | 7085 | 6295 | 35 | 35 | 0.49% | 0.56% | 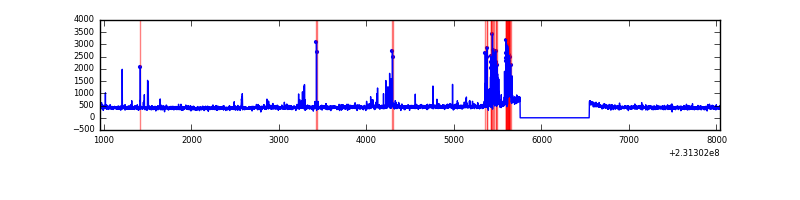 |
| B | 7085 | 6295 | 7 | 7 | 0.10% | 0.11% | 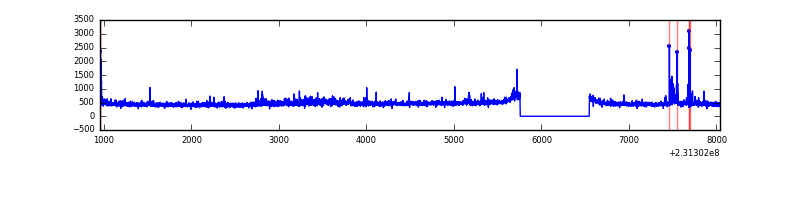 |
| C | 7085 | 6296 | 0 | 0 | 0.00% | 0.00% | 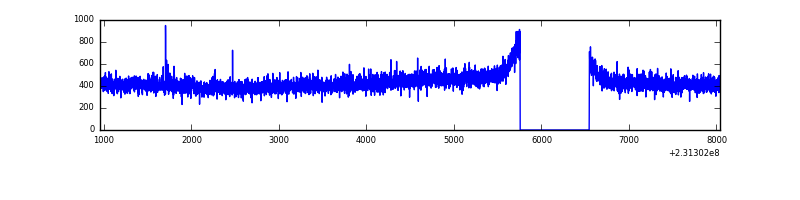 |
| D | 7085 | 6296 | 525 | 525 | 7.41% | 8.34% | 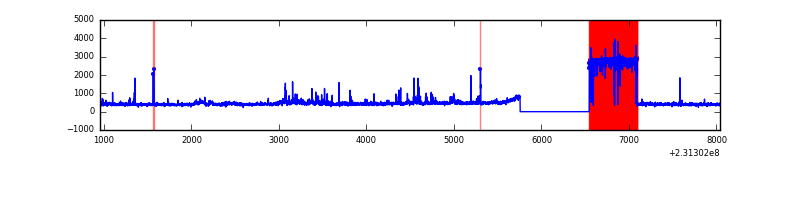 |
Top three noisy pixels from each quadrant. If the there are fewer than three noisy pixels in the level2.evt file, extra rows are filled as -1
| Pixel properties | Quadrant properties | ||||||
|---|---|---|---|---|---|---|---|
| Quadrant | DetID | PixID | Counts | Sigma | Mean | Median | Sigma |
| A | 13 | 248 | 170469 | 1188.91 | 699 | 682 | 142.8 |
| A | 5 | 16 | 51960 | 359.07 | 699 | 682 | 142.8 |
| A | 0 | 128 | 15453 | 103.43 | 699 | 682 | 142.8 |
| B | 0 | 214 | 96238 | 709.08 | 712 | 695 | 134.7 |
| B | 10 | 16 | 50929 | 372.82 | 712 | 695 | 134.7 |
| B | 0 | 219 | 17895 | 127.65 | 712 | 695 | 134.7 |
| C | 14 | 67 | 12150 | 72.55 | 686 | 686 | 158.0 |
| C | 13 | 61 | 5204 | 28.59 | 686 | 686 | 158.0 |
| C | 14 | 64 | 4862 | 26.43 | 686 | 686 | 158.0 |
| D | 13 | 105 | 1381391 | 8814.09 | 638 | 616 | 156.7 |
| D | 1 | 52 | 138140 | 877.88 | 638 | 616 | 156.7 |
| D | 10 | 253 | 57190 | 361.14 | 638 | 616 | 156.7 |
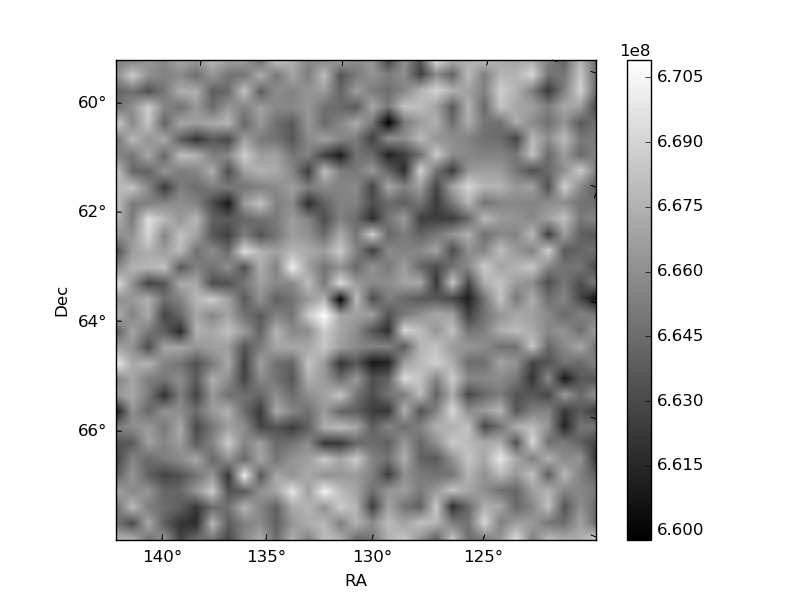
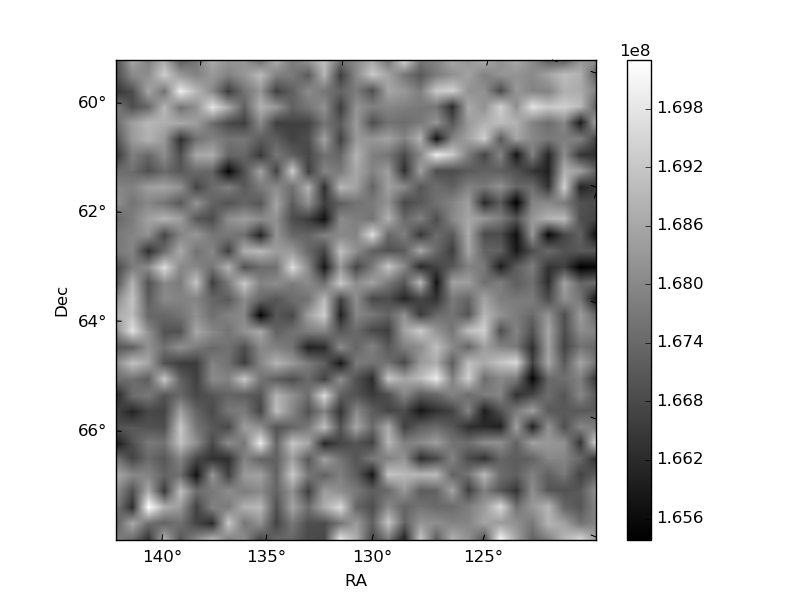
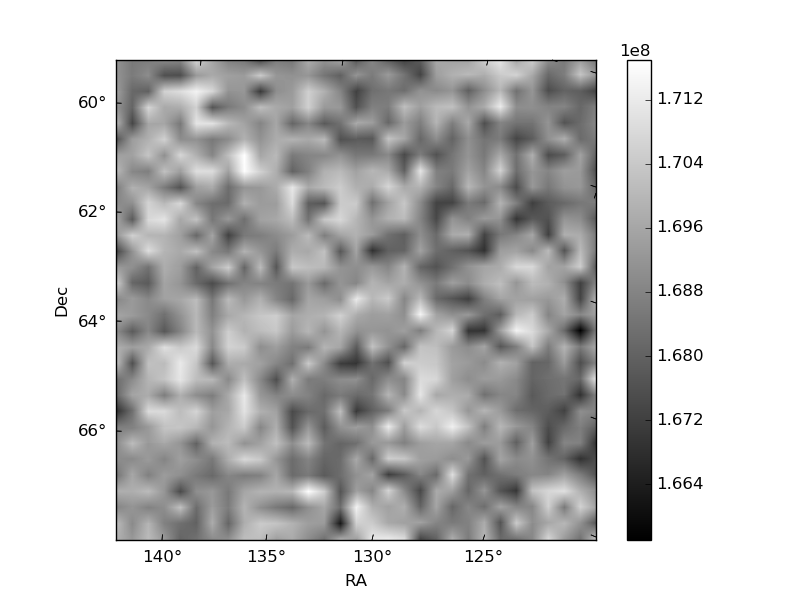
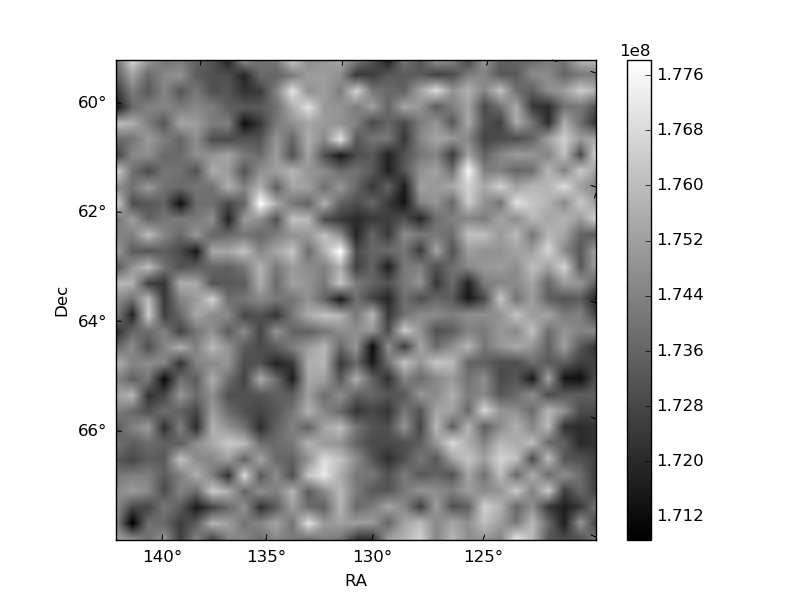
Histogram calculated using DETX and DETY for each event in the final _common_clean file
| Quadrant A | 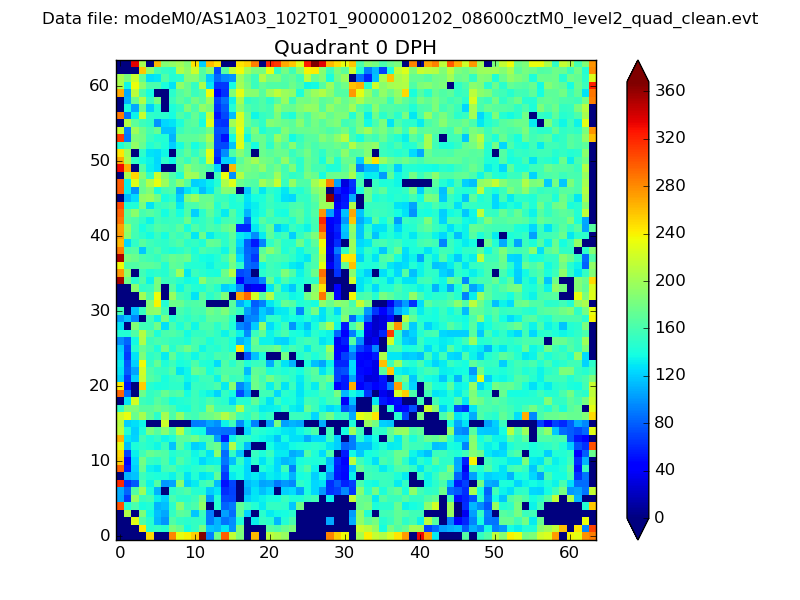 |
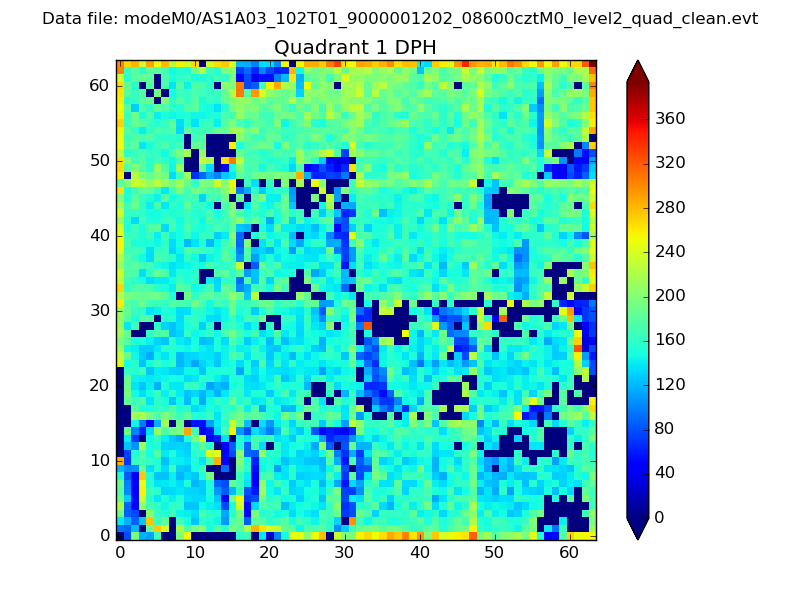 |
Quadrant B |
|---|---|---|---|
| Quadrant D | 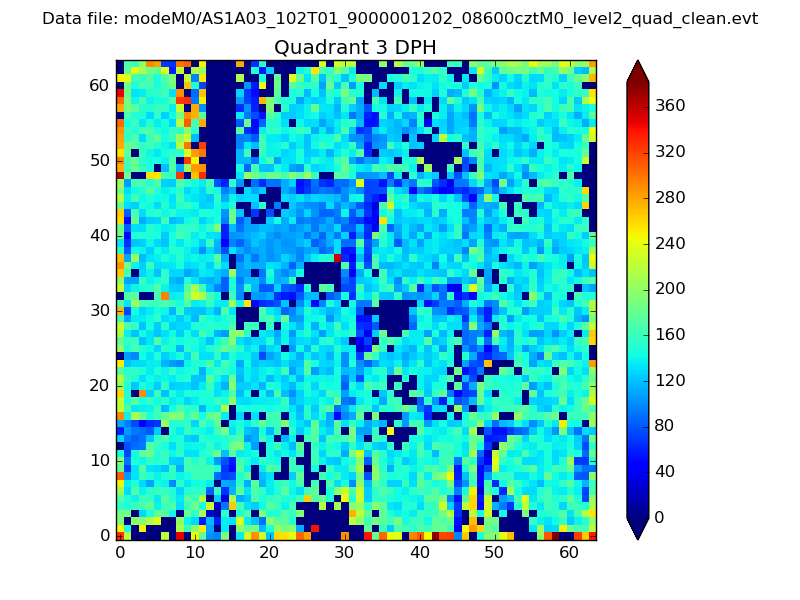 |
 |
Quadrant C |
| Plot type | Count rate plots | Images |
|---|---|---|
| Comparison with Poisson distribution Blue bars denote a histogram of data divided into 1 sec bins. Red curve is a Poisson curve with rate = median count rate of data. |
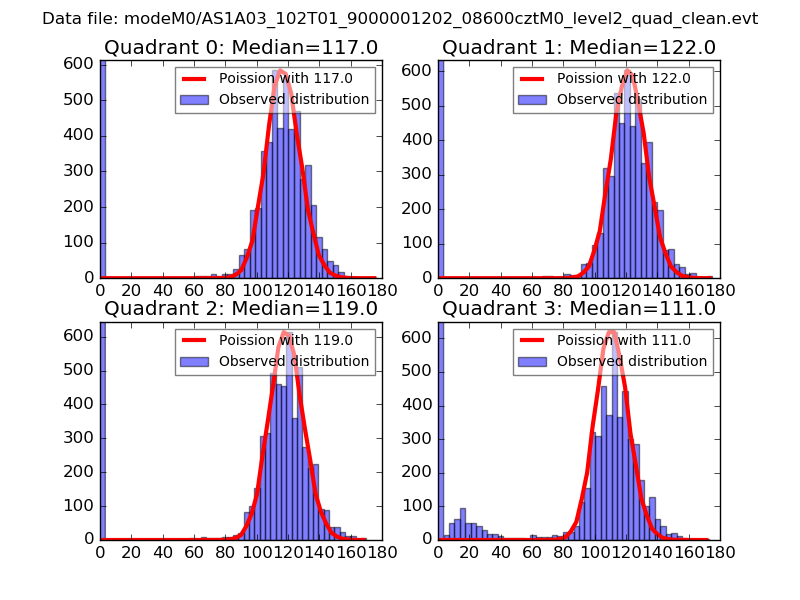 |
 |
| Quadrant-wise count rates Data is divided into 100 sec bins |
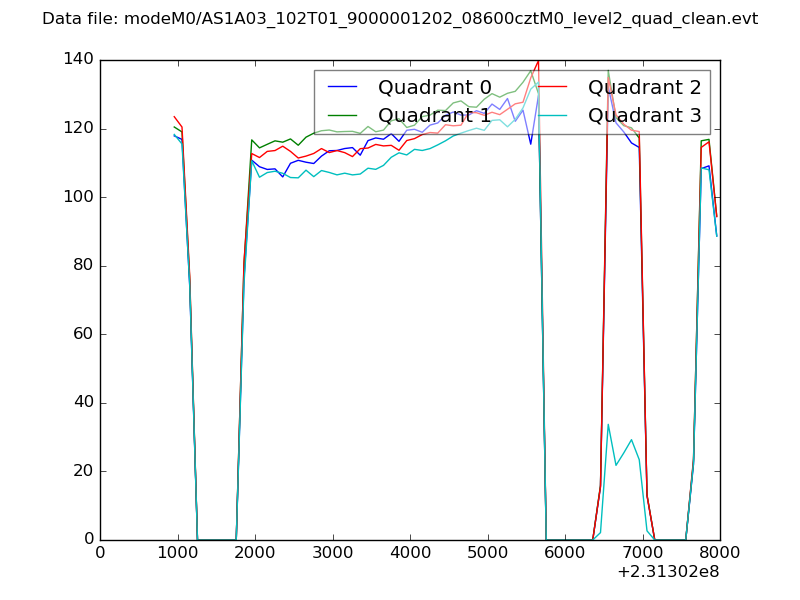 |
|
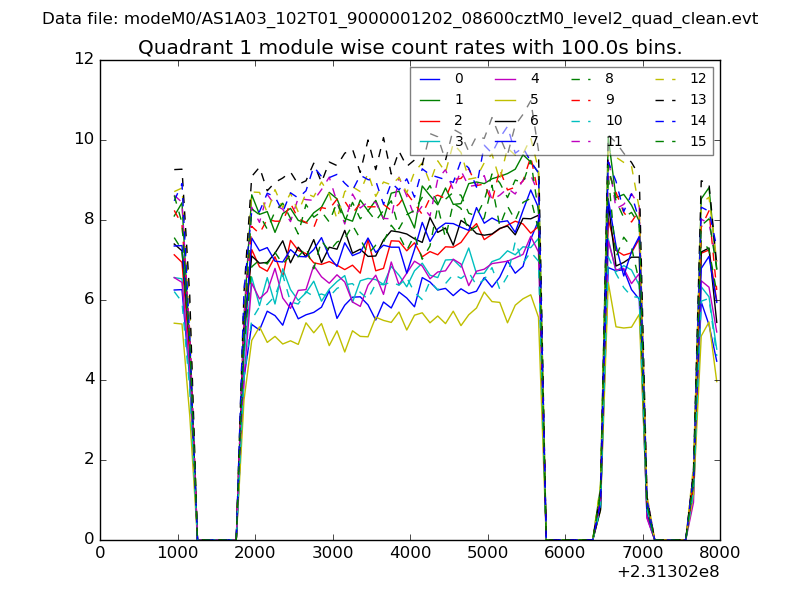
| Module-wise count rates for Quadrant A Data is divided into 100 sec bins |
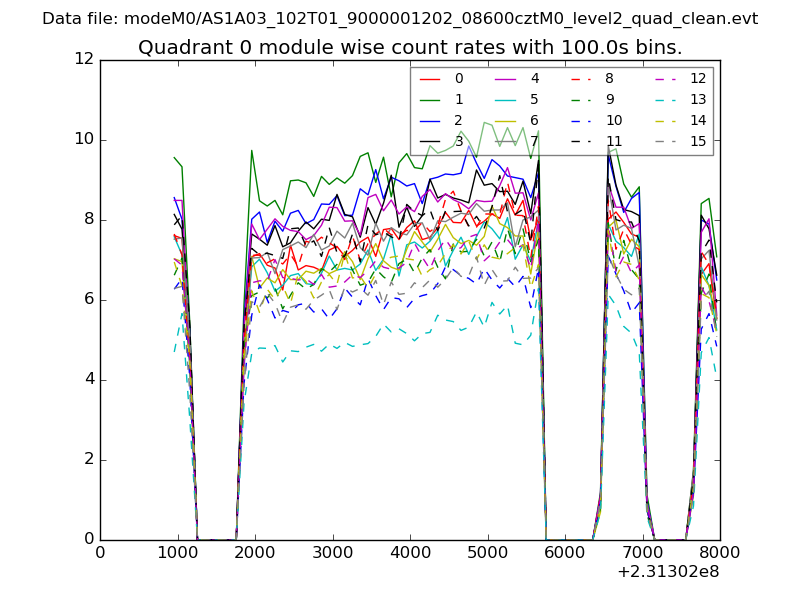 |
 |
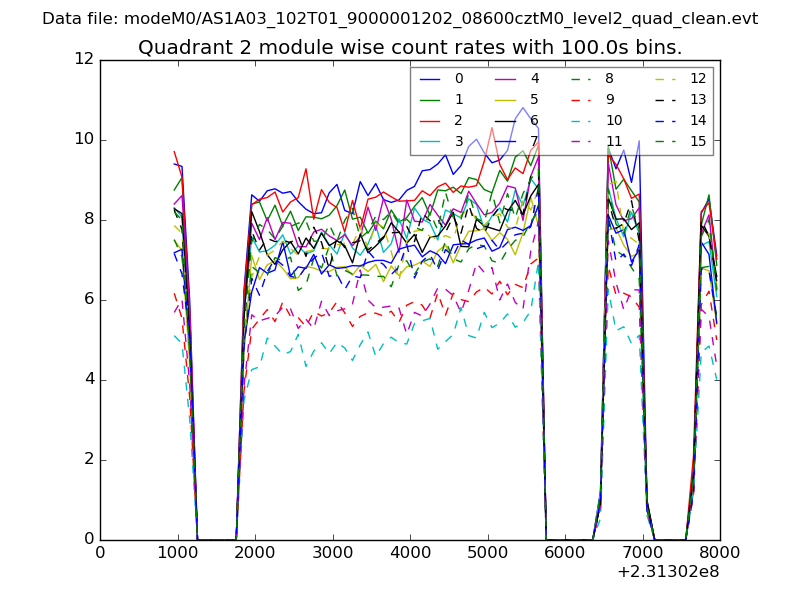
| Module-wise count rates for Quadrant B Data is divided into 100 sec bins |
 |
 |
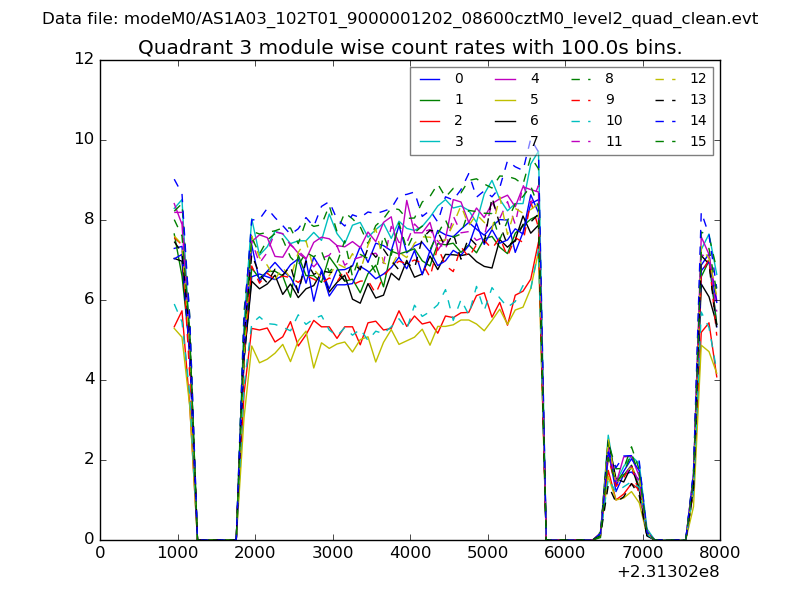
| Module-wise count rates for Quadrant C Data is divided into 100 sec bins |
 |
 |
| Module-wise count rates for Quadrant D Data is divided into 100 sec bins |
 |
 |
| Parameter | Plot |
|---|---|
| CZT HV Monitor | 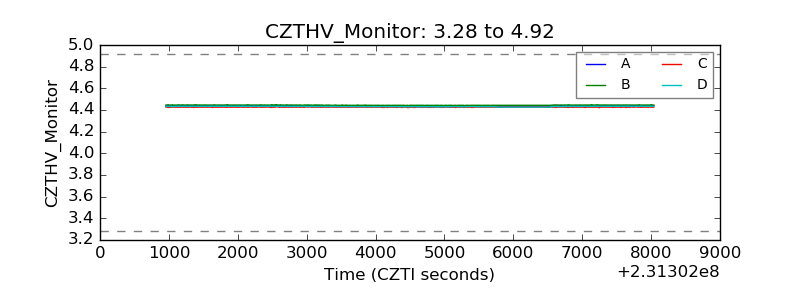 |
| D_VDD | 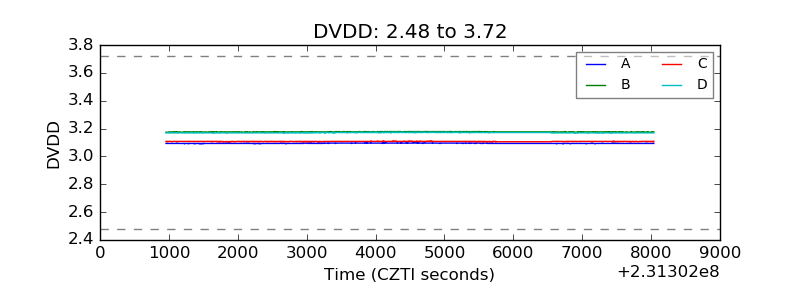 |
| Temperature 1 | 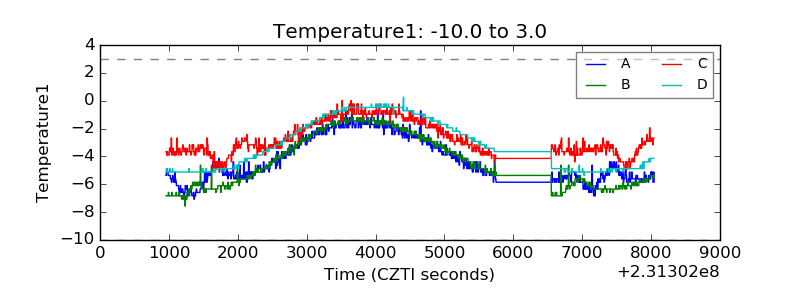 |
| Veto HV Monitor | 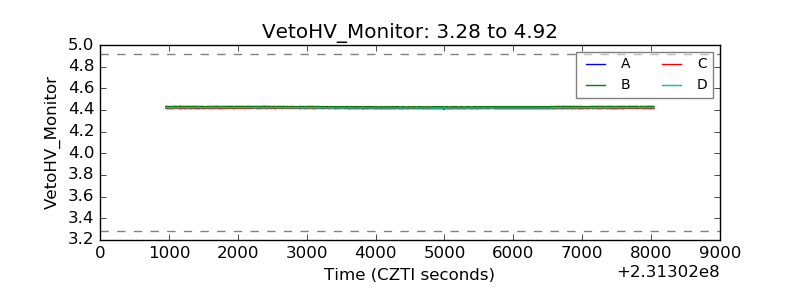 |
| Veto LLD | 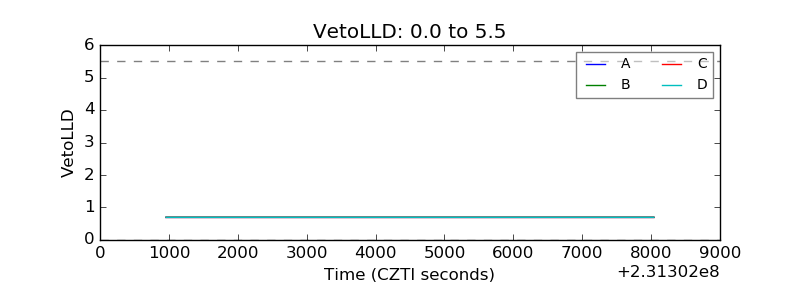 |
| Alpha Counter | 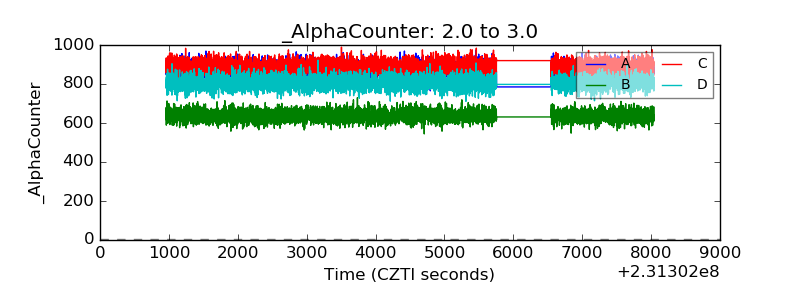 |
| _CPM_Rate | 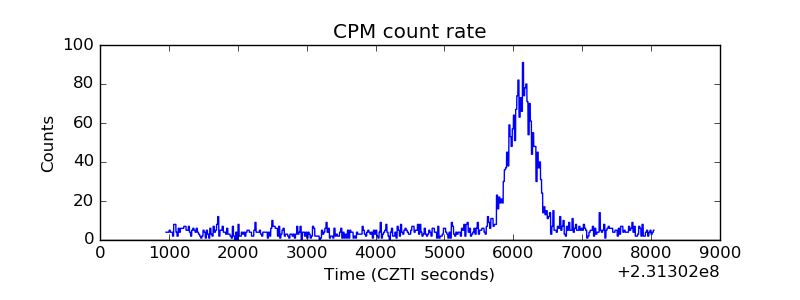 |
| CZT Counter |  |
| +2.5 Volts monitor |  |
| +5 Volts monitor | 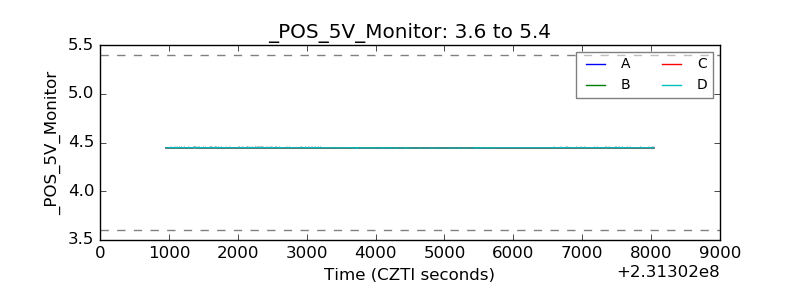 |
| _ROLL_ROT | 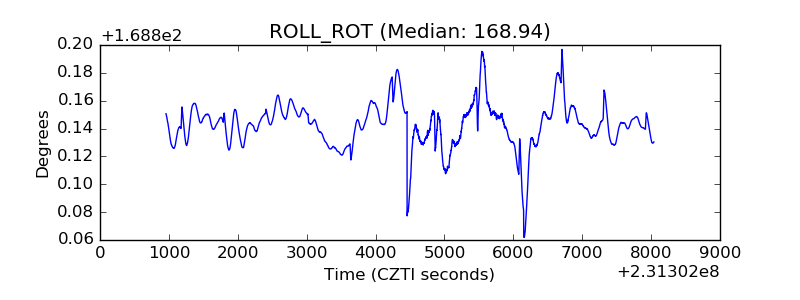 |
| _Roll_DEC | 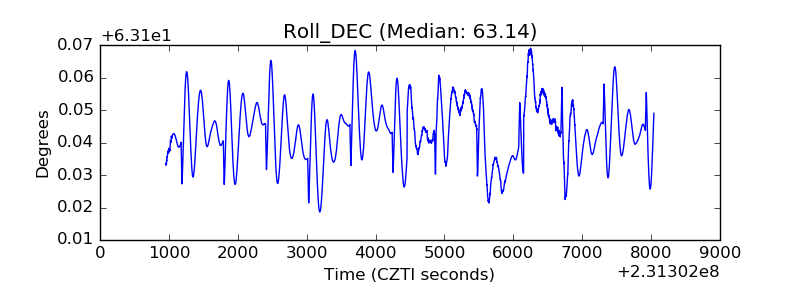 |
| _Roll_RA | 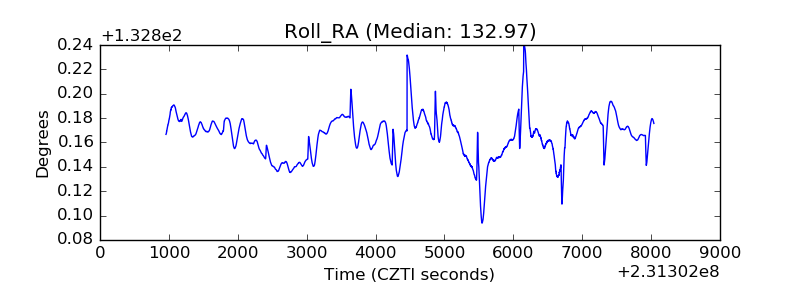 |
| Veto Counter | 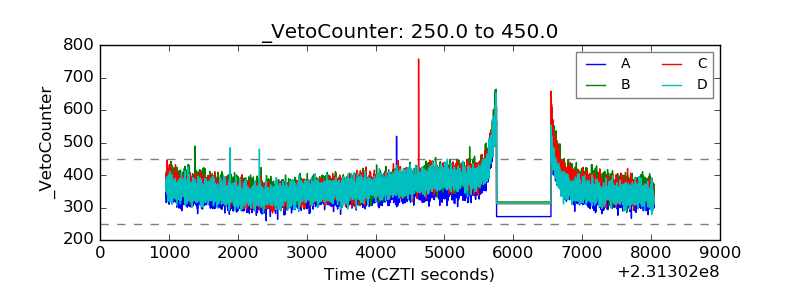 |