| Param | Original file | Final file |
|---|---|---|
| Filename | modeM0/AS1A03_102T01_9000001202_08601cztM0_level2.evt | modeM0/AS1A03_102T01_9000001202_08601cztM0_level2_quad_clean.evt |
| Size (bytes) | 457,024,320 | 100,658,880 |
| Size | 435.9 MB | 96.0 MB |
| Events in quadrant A | 3,374,644 | 639,019 |
| Events in quadrant B | 3,587,614 | 661,661 |
| Events in quadrant C | 2,990,238 | 649,167 |
| Events in quadrant D | 3,419,424 | 617,950 |
| Mode M9 | |||
|---|---|---|---|
| Quadrant | BADHDUFLAG | Total packets | Discarded packets |
| A | 0 | 3 | 0 |
| B | 0 | 3 | 0 |
| C | 0 | 3 | 0 |
| D | 0 | 3 | 0 |
| Mode SS | |||
|---|---|---|---|
| Quadrant | BADHDUFLAG | Total packets | Discarded packets |
| A | 0 | 142 | 0 |
| B | 0 | 142 | 0 |
| C | 0 | 142 | 0 |
| D | 0 | 142 | 0 |
| Mode M0 | |||
|---|---|---|---|
| Quadrant | BADHDUFLAG | Total packets | Discarded packets |
| A | 0 | 15138 | 2 |
| B | 0 | 15369 | 1 |
| C | 0 | 14071 | 1 |
| D | 0 | 15288 | 3 |
| Quadrant | Total seconds | Saturated seconds | Saturation percentage |
|---|---|---|---|
| A | 6895 | 217 | 3.147208% |
| B | 6895 | 256 | 3.712835% |
| C | 6895 | 115 | 1.667875% |
| D | 6894 | 198 | 2.872063% |
Noise dominated data is calculated using 1-second bins in cleaned event files. If a bin has >2000 counts, and if more than 50% of those come from <1% of pixels, then it is considered to be noise-dominated and hence unusable.
| Quadrant | # 1 sec bins | Bins with >0 counts | Bins with >2000 counts | High rate bins dominated by noise | Noise dominated (total time) | Noise dominated (detector-on time) | Marked lightcurve |
|---|---|---|---|---|---|---|---|
| A | 7155 | 6896 | 36 | 36 | 0.50% | 0.52% | 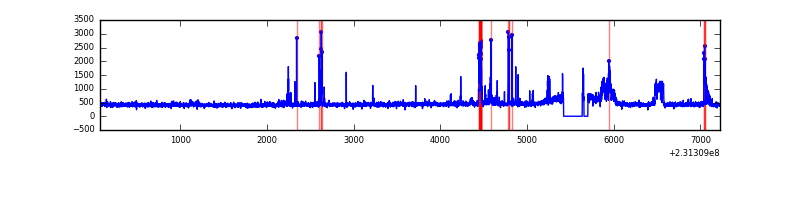 |
| B | 7155 | 6896 | 47 | 47 | 0.66% | 0.68% | 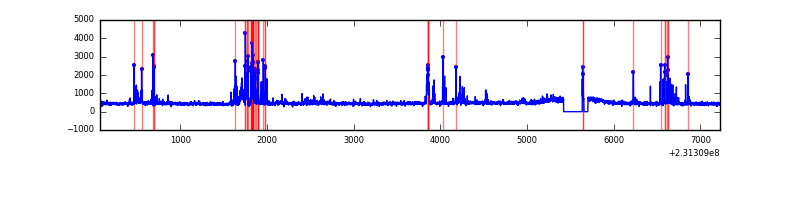 |
| C | 7155 | 6897 | 0 | 0 | 0.00% | 0.00% | 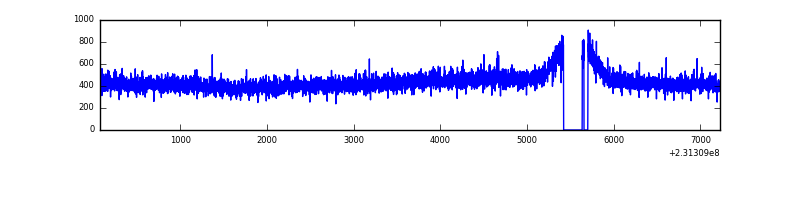 |
| D | 7155 | 6897 | 69 | 69 | 0.96% | 1.00% | 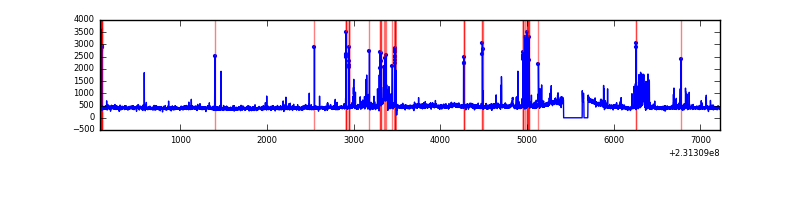 |
Top three noisy pixels from each quadrant. If the there are fewer than three noisy pixels in the level2.evt file, extra rows are filled as -1
| Pixel properties | Quadrant properties | ||||||
|---|---|---|---|---|---|---|---|
| Quadrant | DetID | PixID | Counts | Sigma | Mean | Median | Sigma |
| A | 13 | 248 | 270984 | 1704.22 | 769 | 751 | 158.6 |
| A | 15 | 174 | 59498 | 370.49 | 769 | 751 | 158.6 |
| A | 5 | 16 | 46269 | 287.06 | 769 | 751 | 158.6 |
| B | 10 | 16 | 339421 | 2273.8 | 782 | 764 | 148.9 |
| B | 0 | 214 | 74754 | 496.78 | 782 | 764 | 148.9 |
| B | 0 | 187 | 40967 | 269.93 | 782 | 764 | 148.9 |
| C | 12 | 16 | 9937 | 52.19 | 758 | 757 | 175.9 |
| C | 14 | 67 | 6923 | 35.06 | 758 | 757 | 175.9 |
| C | 13 | 61 | 5738 | 28.32 | 758 | 757 | 175.9 |
| D | 12 | 233 | 166222 | 900.84 | 748 | 723 | 183.7 |
| D | 5 | 172 | 91675 | 495.07 | 748 | 723 | 183.7 |
| D | 13 | 105 | 90497 | 488.65 | 748 | 723 | 183.7 |
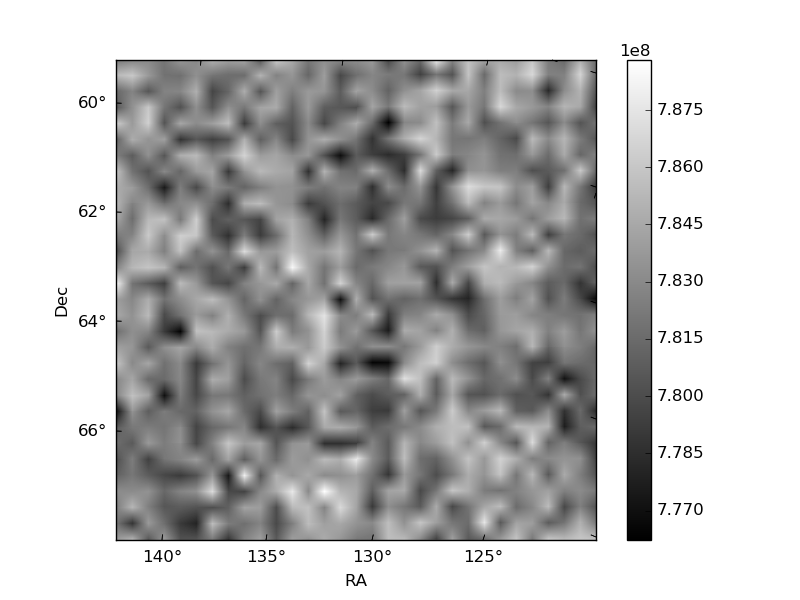
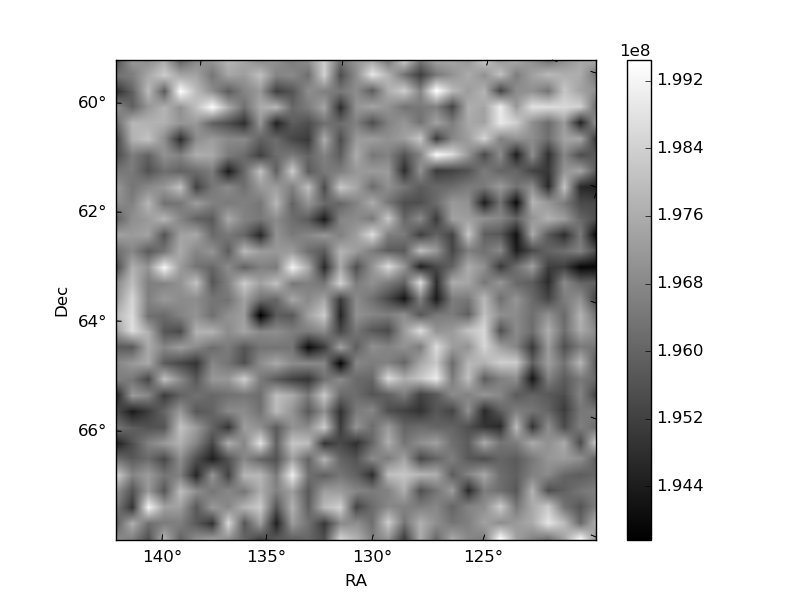
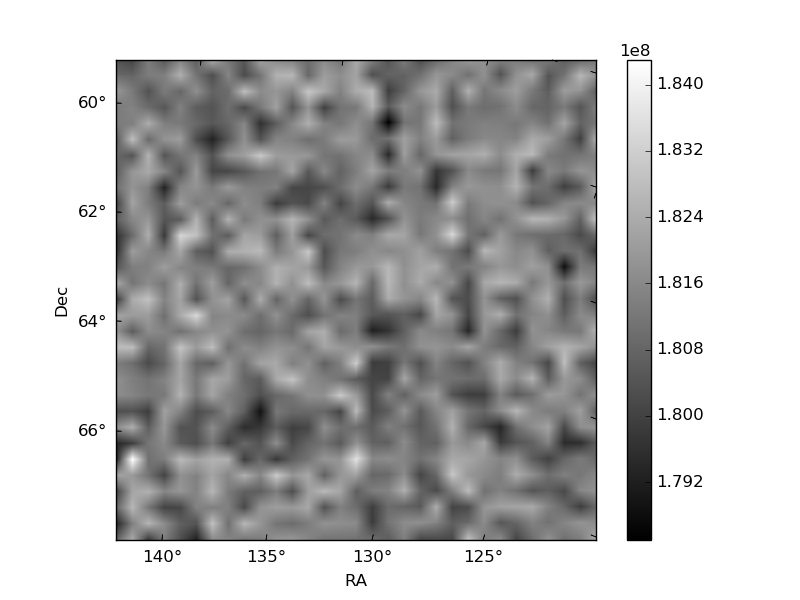
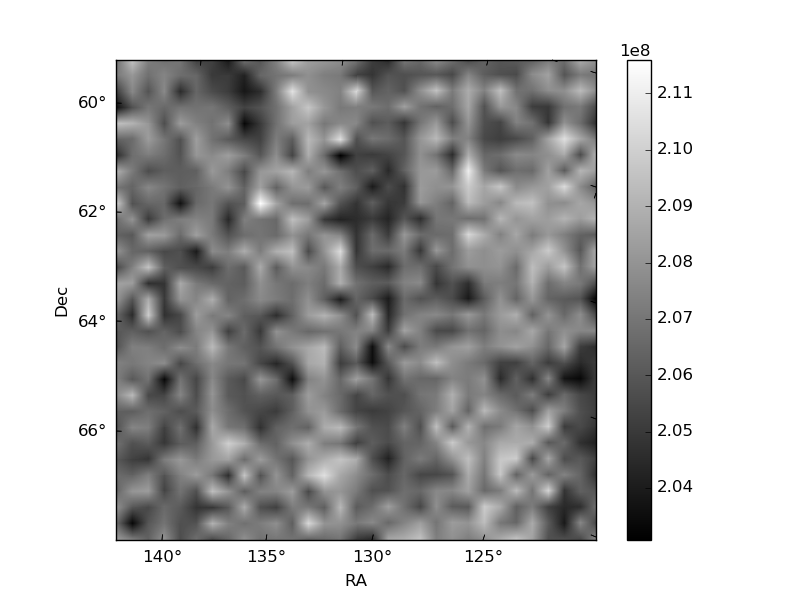
Histogram calculated using DETX and DETY for each event in the final _common_clean file
| Quadrant A | 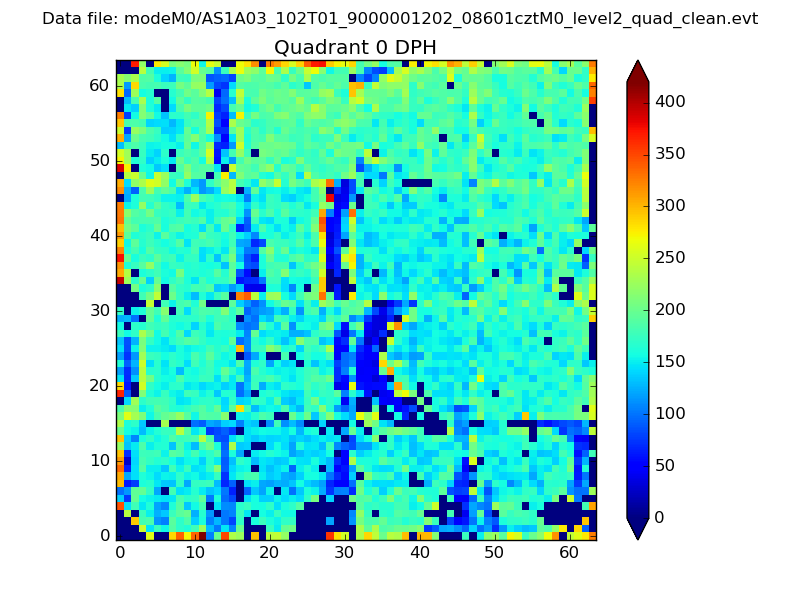 |
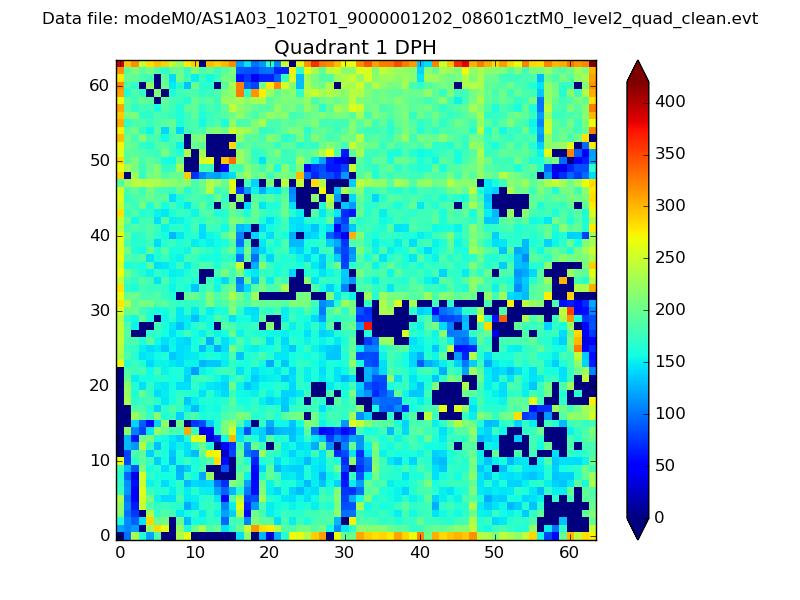 |
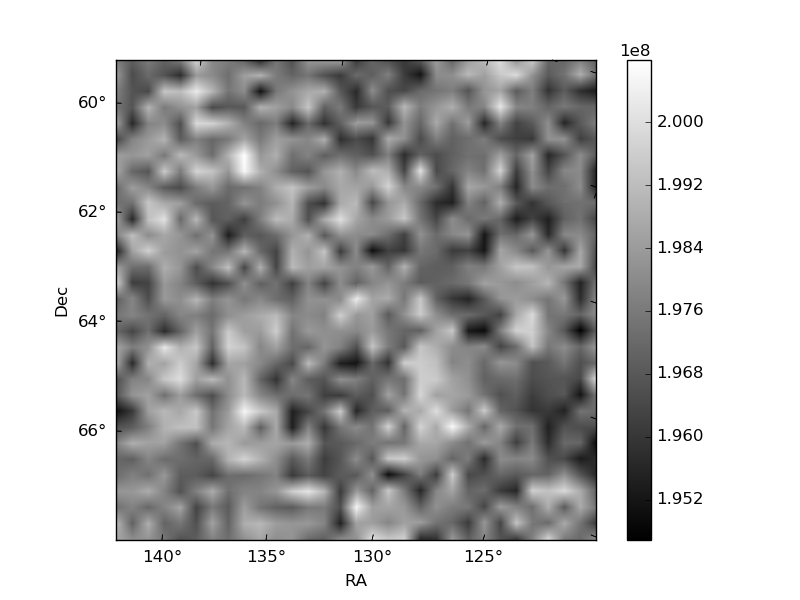
Quadrant B |
|---|---|---|---|
| Quadrant D | 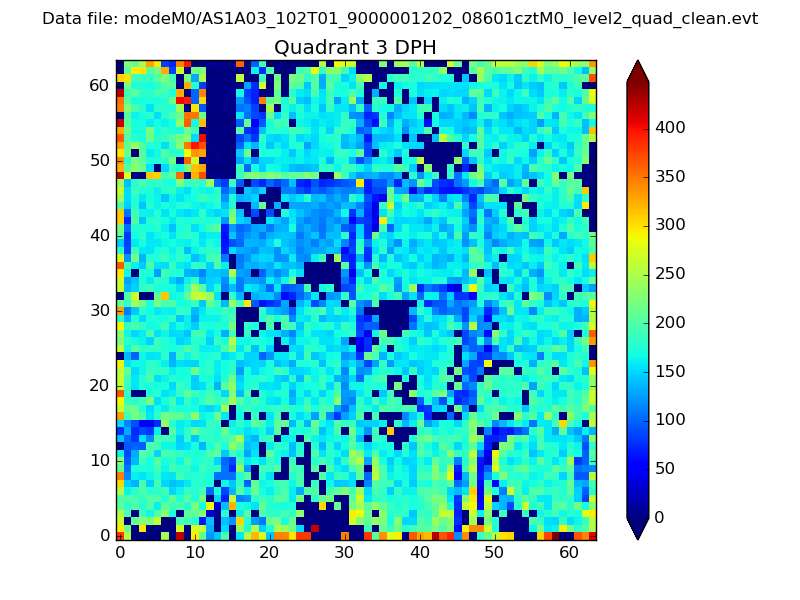 |
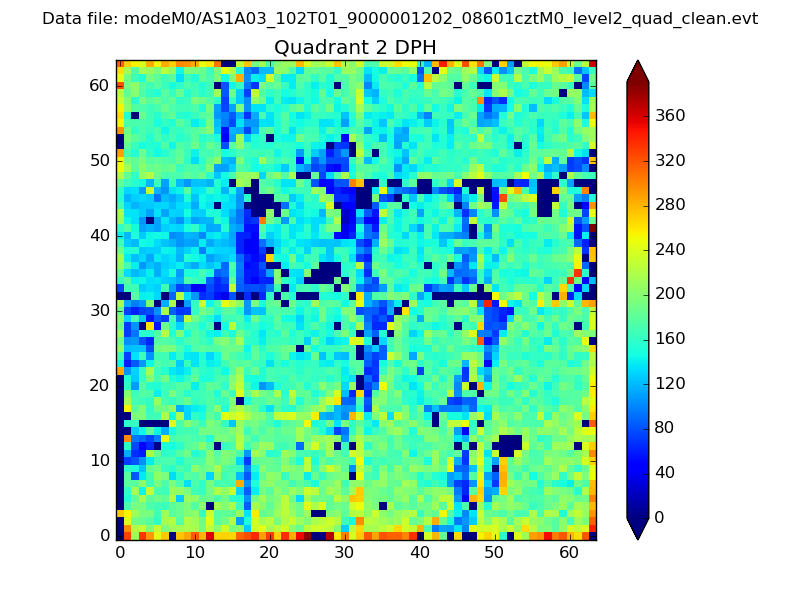 |
Quadrant C |
| Plot type | Count rate plots | Images |
|---|---|---|
| Comparison with Poisson distribution Blue bars denote a histogram of data divided into 1 sec bins. Red curve is a Poisson curve with rate = median count rate of data. |
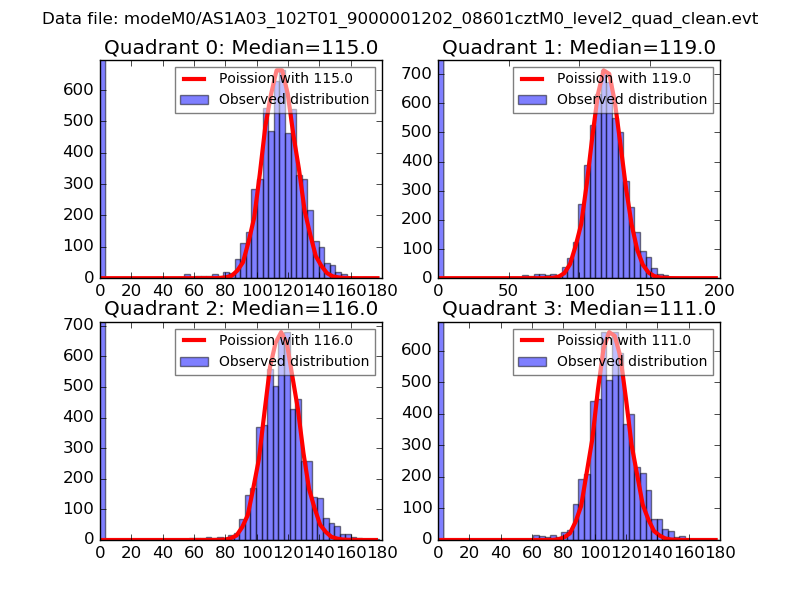 |
 |
| Quadrant-wise count rates Data is divided into 100 sec bins |
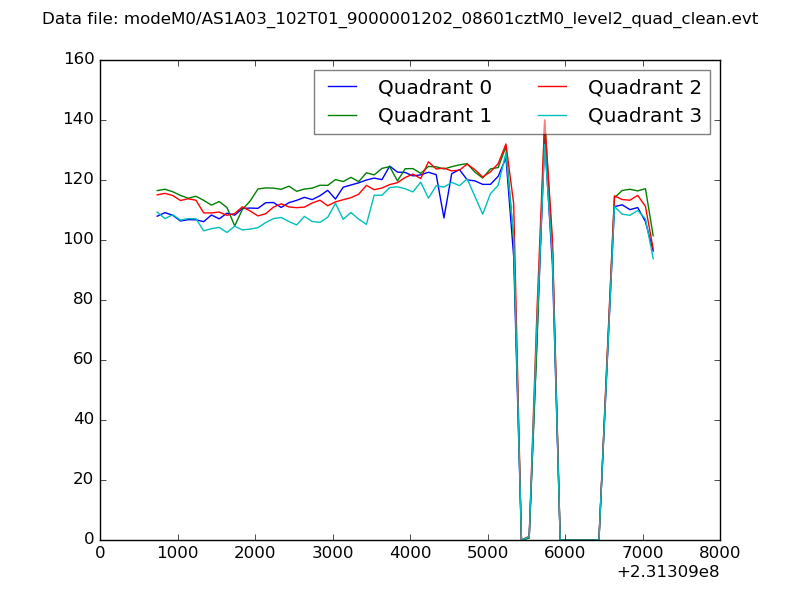 |
|
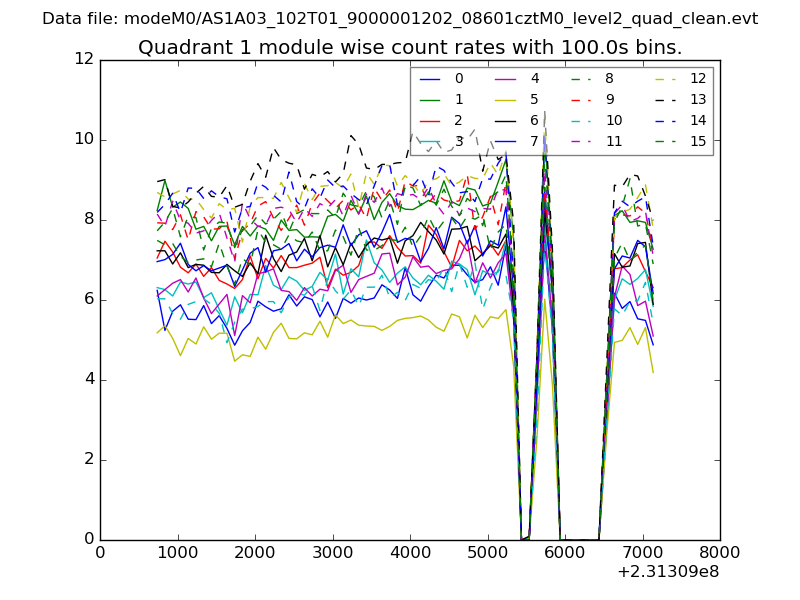
| Module-wise count rates for Quadrant A Data is divided into 100 sec bins |
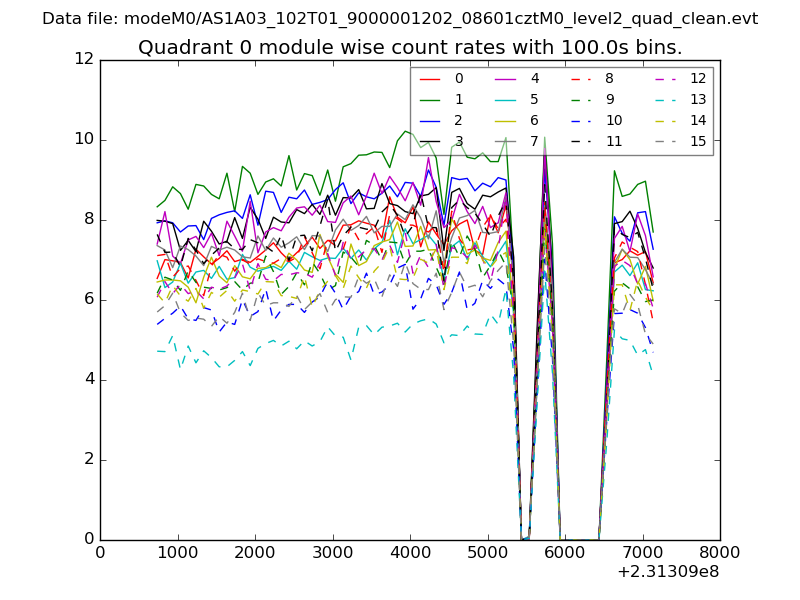 |
 |
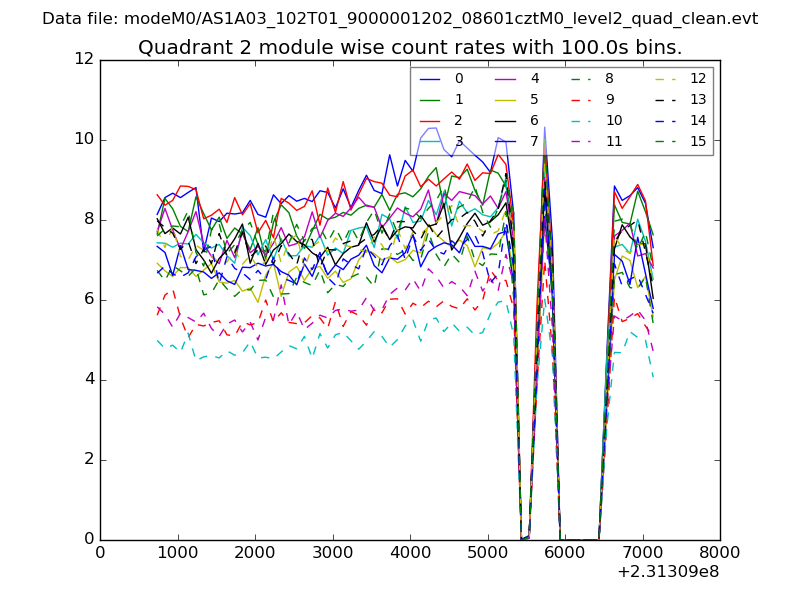
| Module-wise count rates for Quadrant B Data is divided into 100 sec bins |
 |
 |
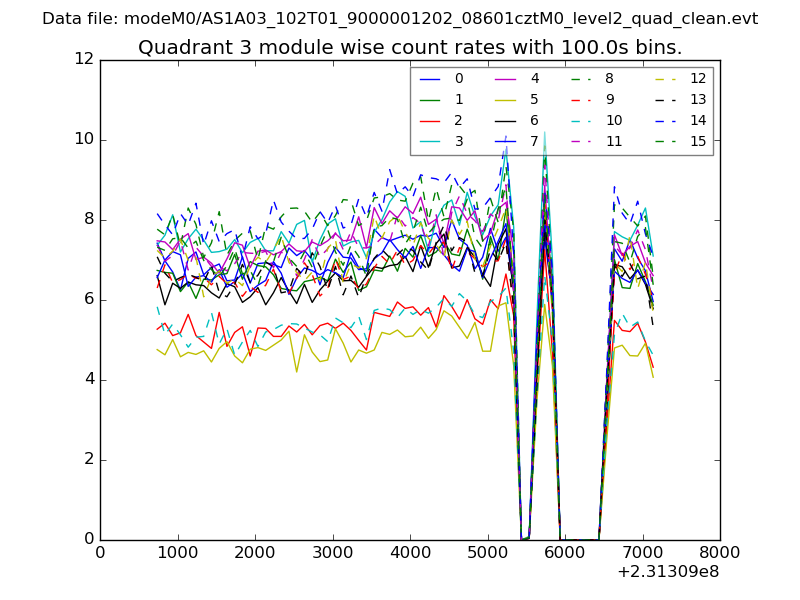
| Module-wise count rates for Quadrant C Data is divided into 100 sec bins |
 |
 |
| Module-wise count rates for Quadrant D Data is divided into 100 sec bins |
 |
 |
| Parameter | Plot |
|---|---|
| CZT HV Monitor | 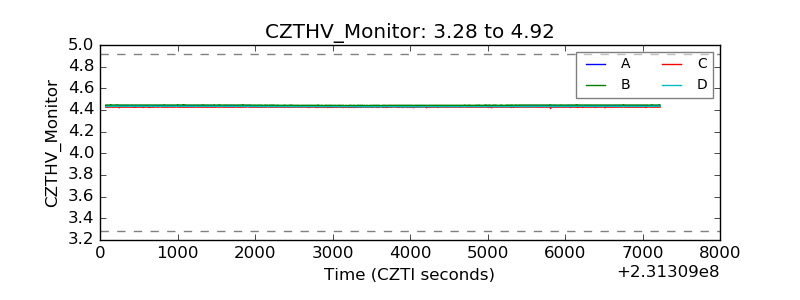 |
| D_VDD | 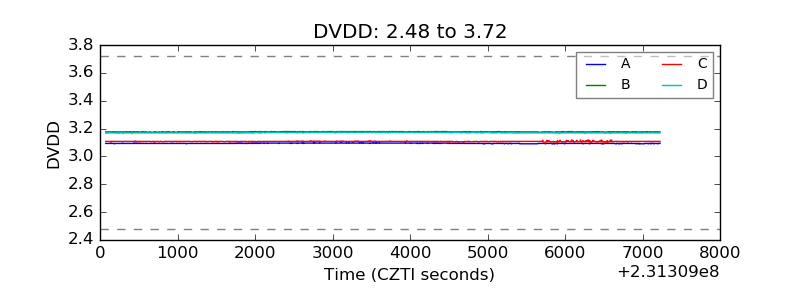 |
| Temperature 1 | 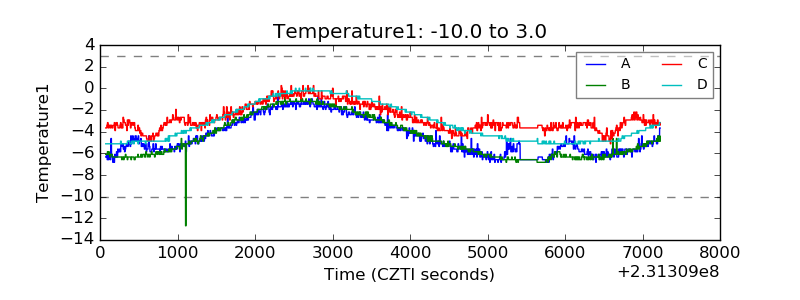 |
| Veto HV Monitor | 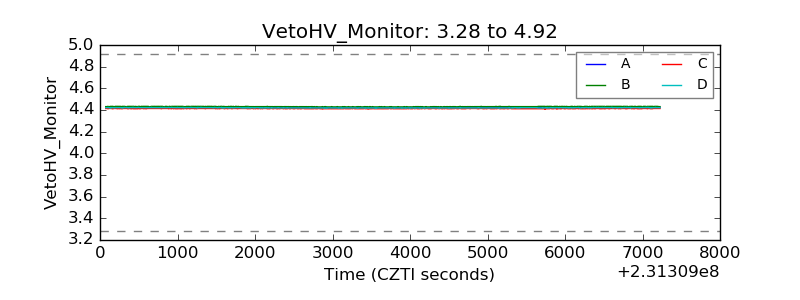 |
| Veto LLD | 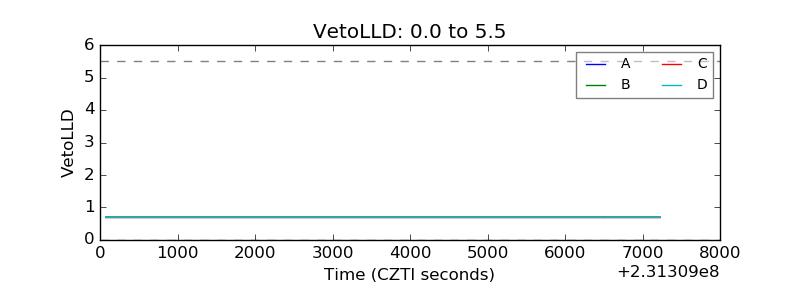 |
| Alpha Counter | 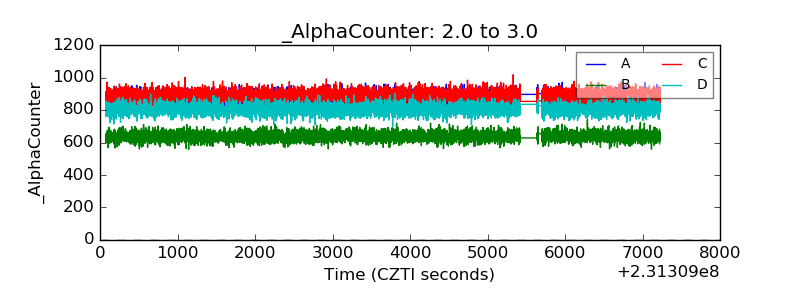 |
| _CPM_Rate | 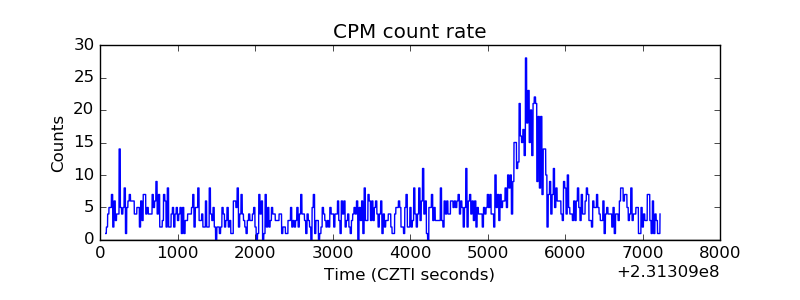 |
| CZT Counter | 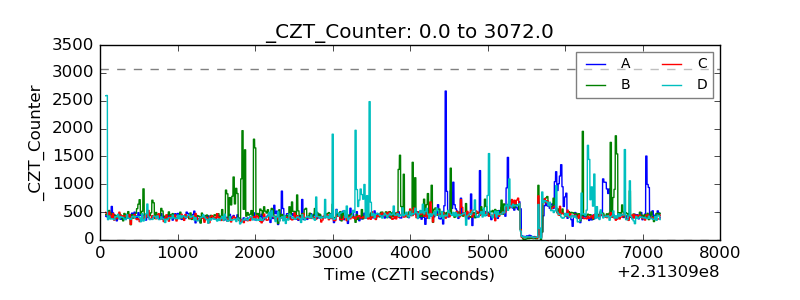 |
| +2.5 Volts monitor |  |
| +5 Volts monitor | 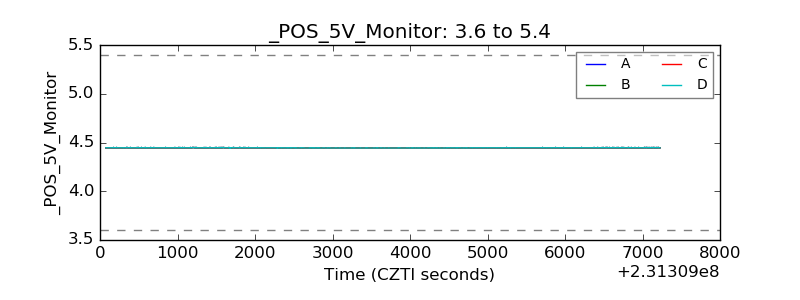 |
| _ROLL_ROT | 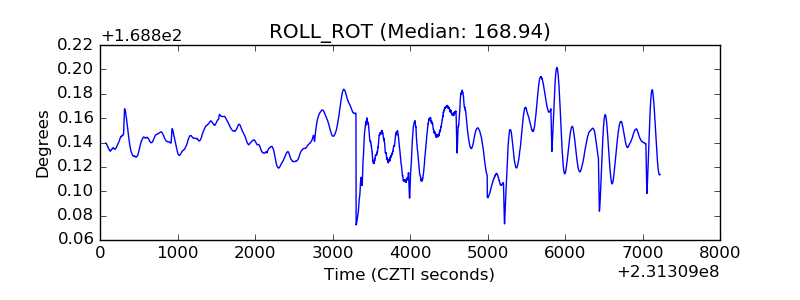 |
| _Roll_DEC | 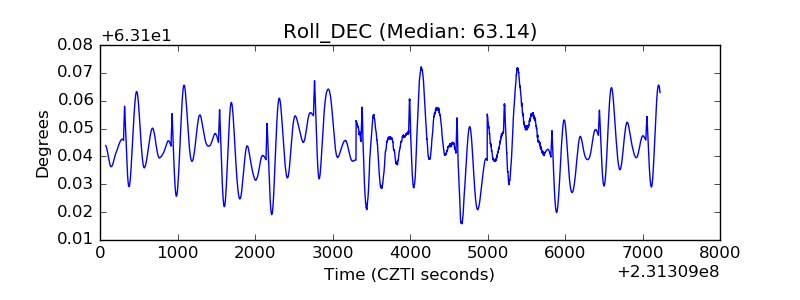 |
| _Roll_RA | 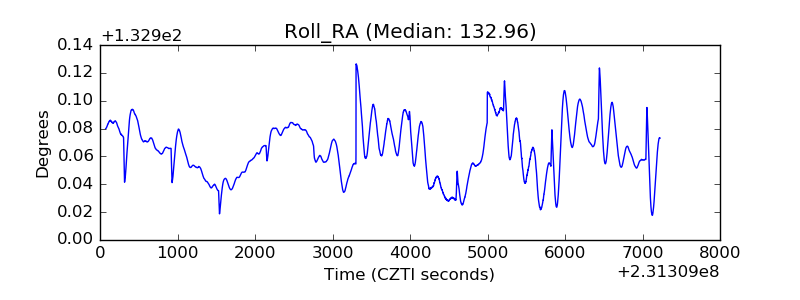 |
| Veto Counter | 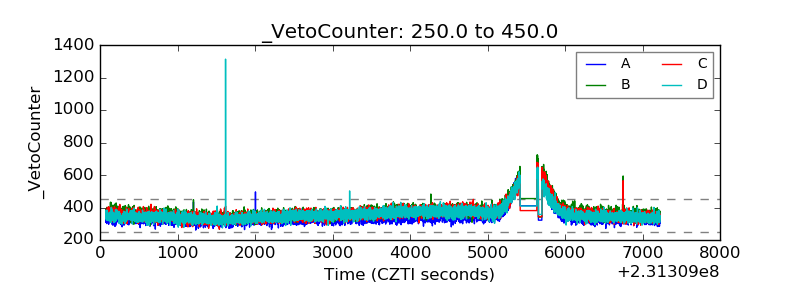 |