| Param | Original file | Final file |
|---|---|---|
| Filename | modeM0/AS1A03_102T01_9000001202_08602cztM0_level2.evt | modeM0/AS1A03_102T01_9000001202_08602cztM0_level2_quad_clean.evt |
| Size (bytes) | 488,880,000 | 112,193,280 |
| Size | 466.2 MB | 107.0 MB |
| Events in quadrant A | 3,534,579 | 719,917 |
| Events in quadrant B | 3,669,791 | 745,367 |
| Events in quadrant C | 3,233,369 | 723,678 |
| Events in quadrant D | 3,860,354 | 689,507 |
| Mode SS | |||
|---|---|---|---|
| Quadrant | BADHDUFLAG | Total packets | Discarded packets |
| A | 0 | 150 | 0 |
| B | 0 | 150 | 0 |
| C | 0 | 150 | 0 |
| D | 0 | 150 | 0 |
| Mode M0 | |||
|---|---|---|---|
| Quadrant | BADHDUFLAG | Total packets | Discarded packets |
| A | 0 | 15970 | 3 |
| B | 0 | 15987 | 4 |
| C | 0 | 15264 | 9 |
| D | 0 | 16840 | 4 |
| Quadrant | Total seconds | Saturated seconds | Saturation percentage |
|---|---|---|---|
| A | 7463 | 241 | 3.229264% |
| B | 7462 | 219 | 2.934870% |
| C | 7460 | 104 | 1.394102% |
| D | 7462 | 208 | 2.787456% |
Noise dominated data is calculated using 1-second bins in cleaned event files. If a bin has >2000 counts, and if more than 50% of those come from <1% of pixels, then it is considered to be noise-dominated and hence unusable.
| Quadrant | # 1 sec bins | Bins with >0 counts | Bins with >2000 counts | High rate bins dominated by noise | Noise dominated (total time) | Noise dominated (detector-on time) | Marked lightcurve |
|---|---|---|---|---|---|---|---|
| A | 7513 | 7464 | 15 | 15 | 0.20% | 0.20% | 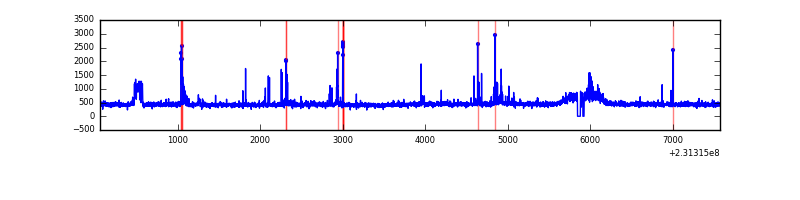 |
| B | 7513 | 7464 | 15 | 15 | 0.20% | 0.20% | 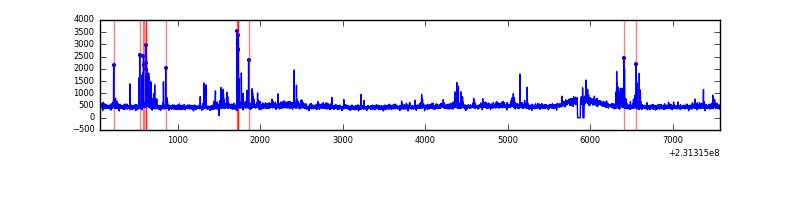 |
| C | 7513 | 7465 | 0 | 0 | 0.00% | 0.00% | 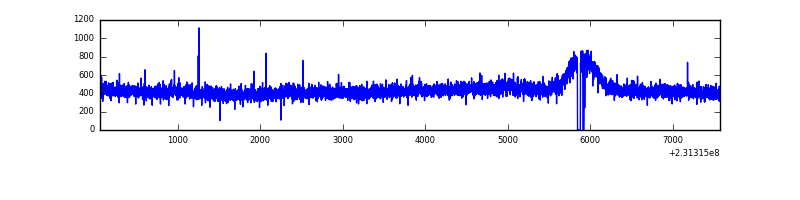 |
| D | 7513 | 7465 | 59 | 59 | 0.79% | 0.79% | 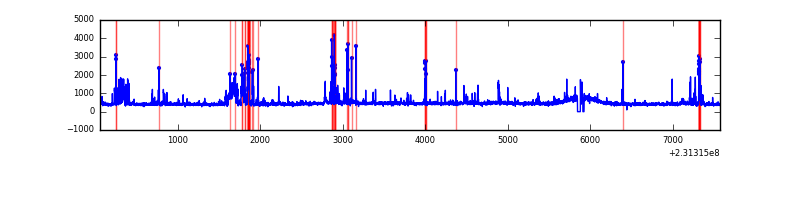 |
Top three noisy pixels from each quadrant. If the there are fewer than three noisy pixels in the level2.evt file, extra rows are filled as -1
| Pixel properties | Quadrant properties | ||||||
|---|---|---|---|---|---|---|---|
| Quadrant | DetID | PixID | Counts | Sigma | Mean | Median | Sigma |
| A | 13 | 248 | 135788 | 781.24 | 843 | 822 | 172.8 |
| A | 15 | 174 | 64010 | 365.76 | 843 | 822 | 172.8 |
| A | 15 | 223 | 36246 | 205.05 | 843 | 822 | 172.8 |
| B | 10 | 16 | 146453 | 889.39 | 856 | 833 | 163.7 |
| B | 0 | 214 | 117928 | 715.17 | 856 | 833 | 163.7 |
| B | 4 | 80 | 36198 | 216.0 | 856 | 833 | 163.7 |
| C | 12 | 16 | 7448 | 34.56 | 824 | 826 | 191.6 |
| C | 13 | 61 | 6488 | 29.55 | 824 | 826 | 191.6 |
| C | 8 | 222 | 4452 | 18.93 | 824 | 826 | 191.6 |
| D | 12 | 233 | 296261 | 1468.66 | 818 | 790 | 201.2 |
| D | 5 | 172 | 208254 | 1031.22 | 818 | 790 | 201.2 |
| D | 13 | 105 | 93672 | 461.68 | 818 | 790 | 201.2 |
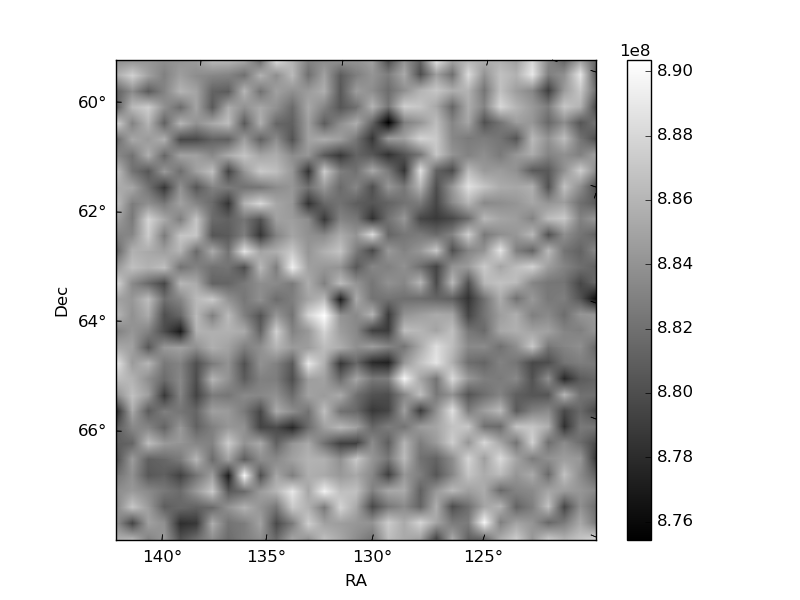
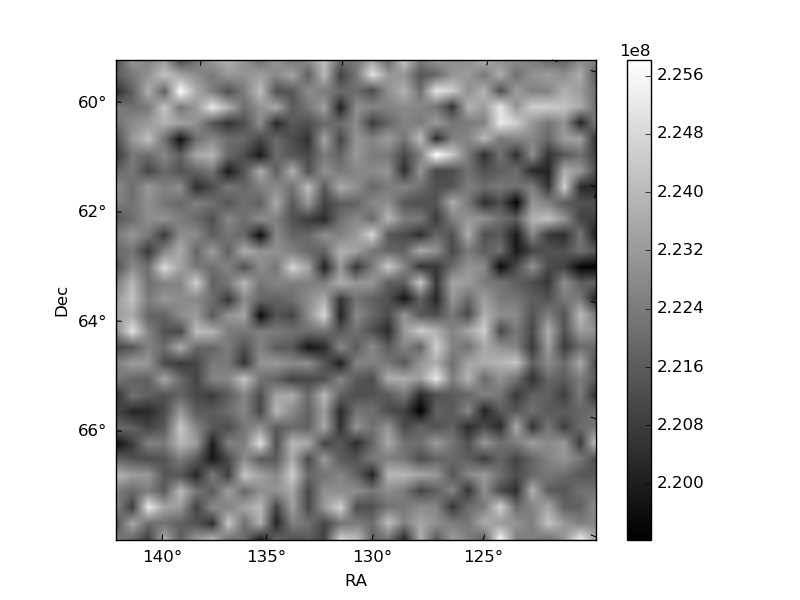
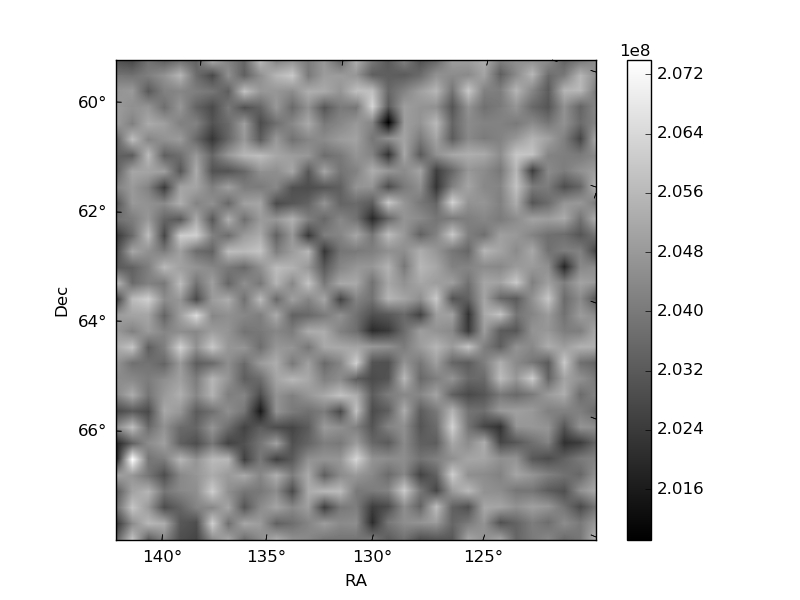
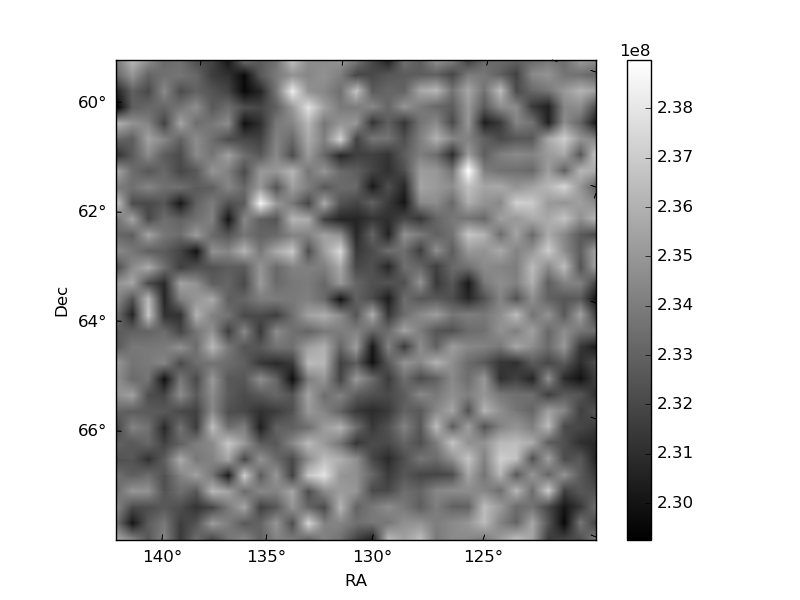
Histogram calculated using DETX and DETY for each event in the final _common_clean file
| Quadrant A | 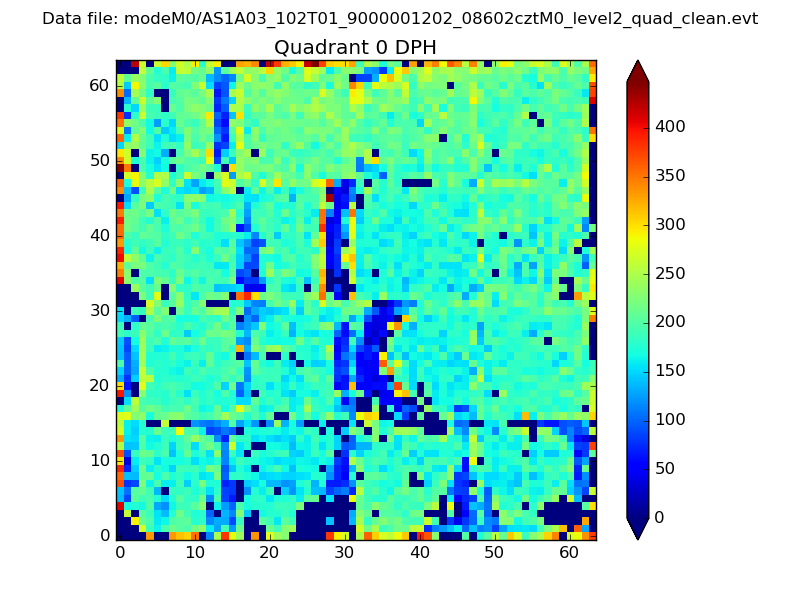 |
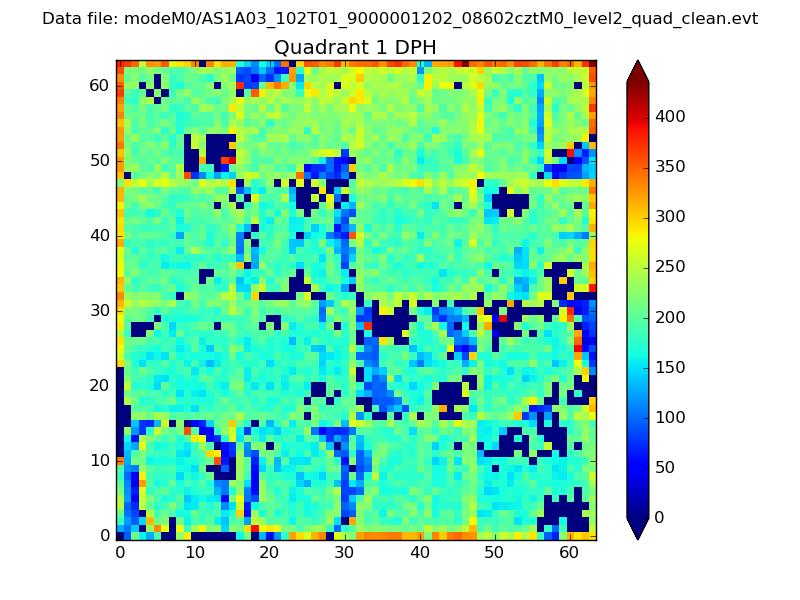 |
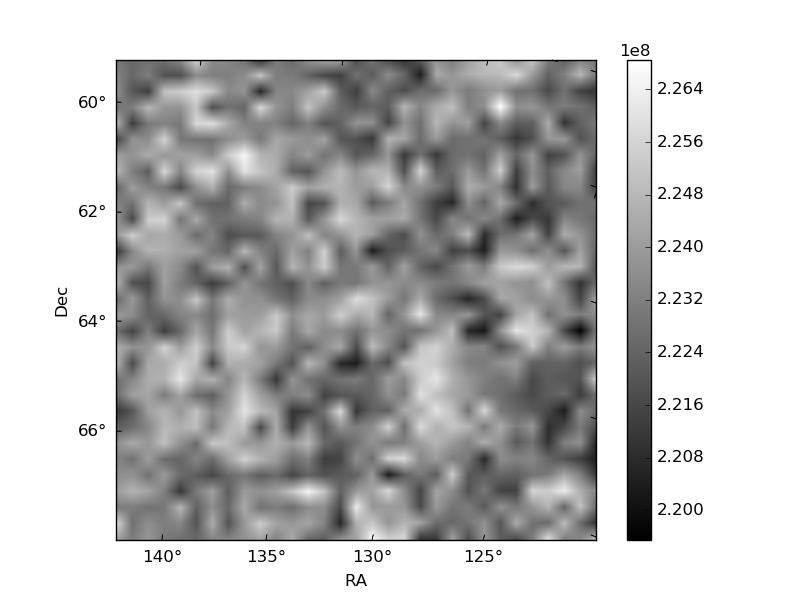
Quadrant B |
|---|---|---|---|
| Quadrant D | 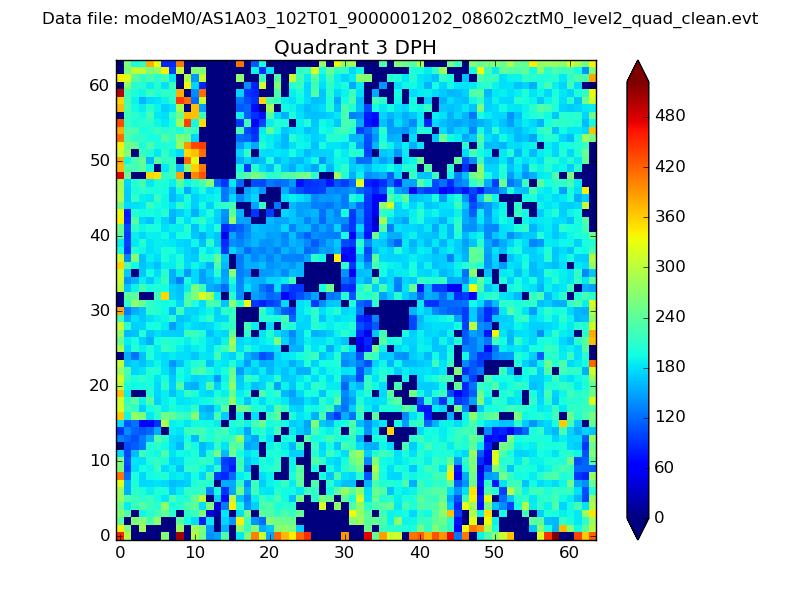 |
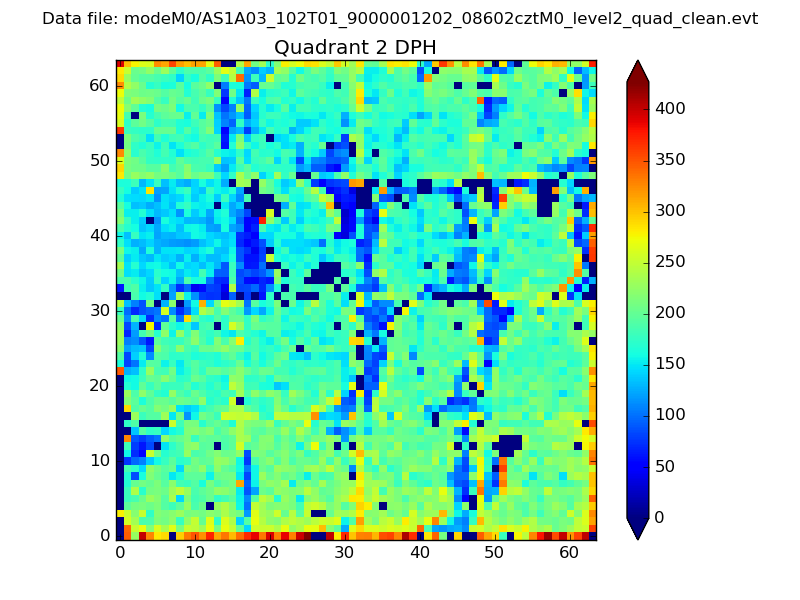 |
Quadrant C |
| Plot type | Count rate plots | Images |
|---|---|---|
| Comparison with Poisson distribution Blue bars denote a histogram of data divided into 1 sec bins. Red curve is a Poisson curve with rate = median count rate of data. |
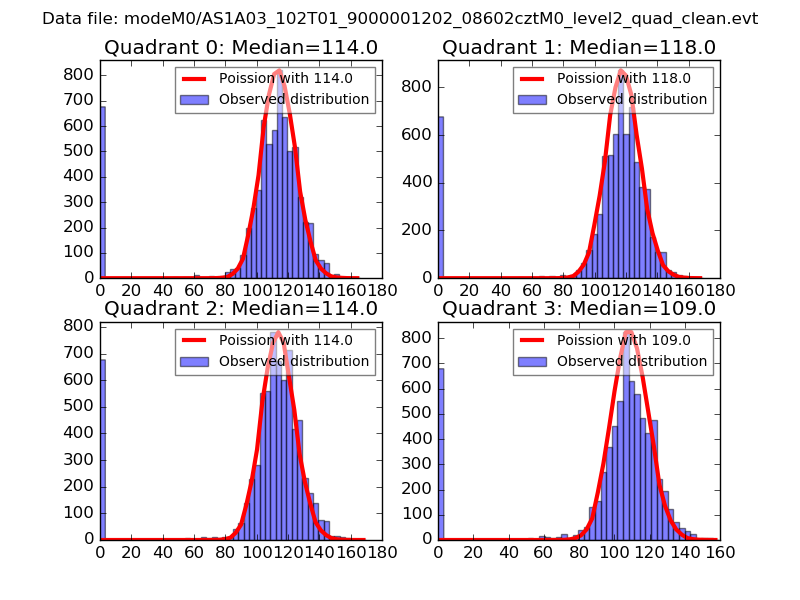 |
 |
| Quadrant-wise count rates Data is divided into 100 sec bins |
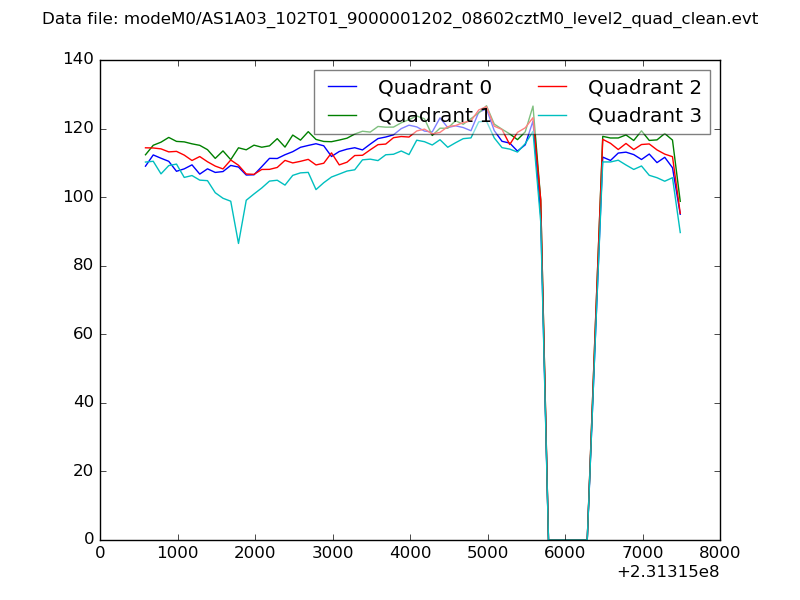 |
|
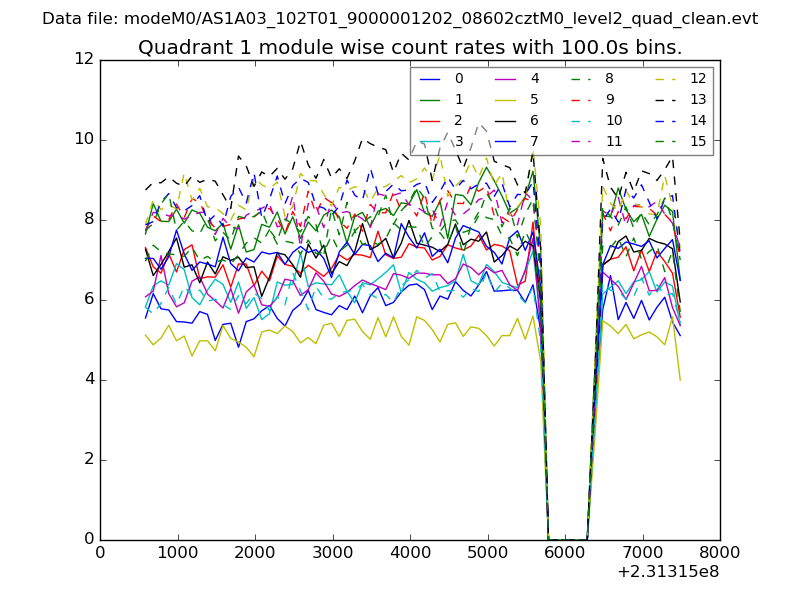
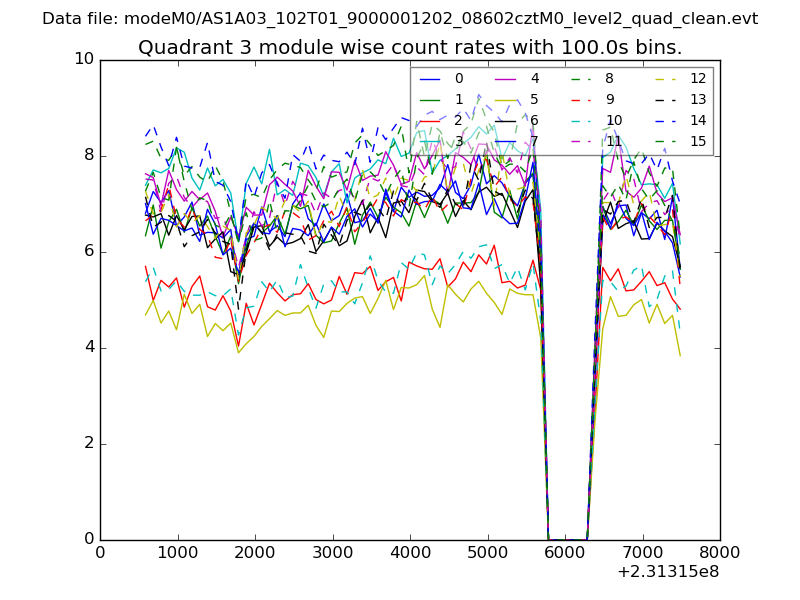
| Module-wise count rates for Quadrant A Data is divided into 100 sec bins |
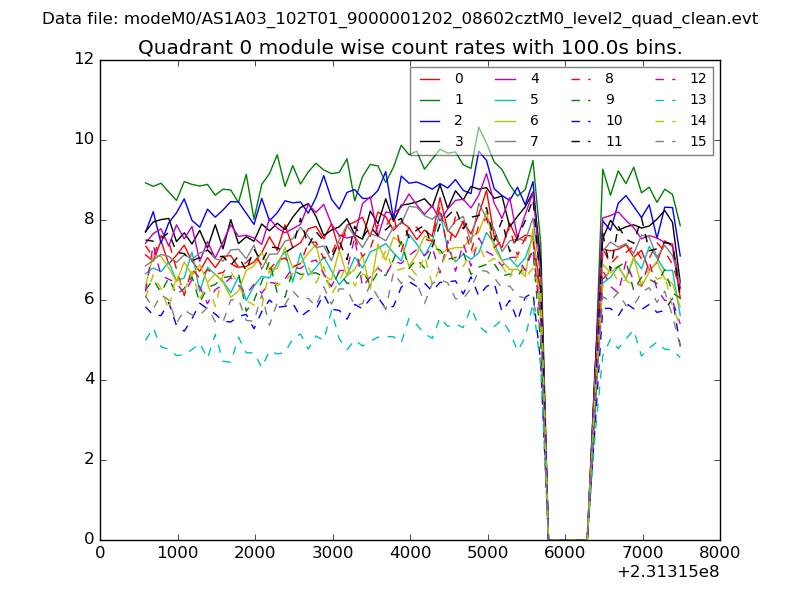 |
 |
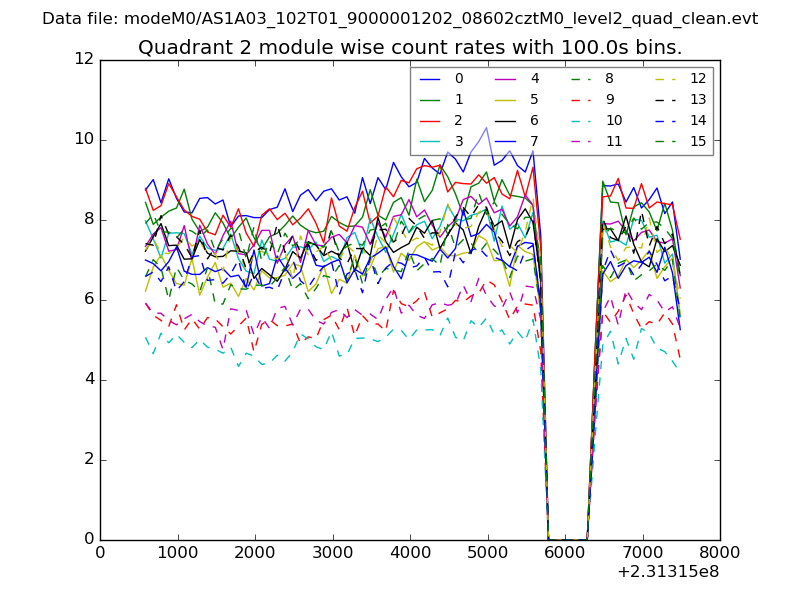
| Module-wise count rates for Quadrant B Data is divided into 100 sec bins |
 |
 |
| Module-wise count rates for Quadrant C Data is divided into 100 sec bins |
 |
 |
| Module-wise count rates for Quadrant D Data is divided into 100 sec bins |
 |
 |
| Parameter | Plot |
|---|---|
| CZT HV Monitor | 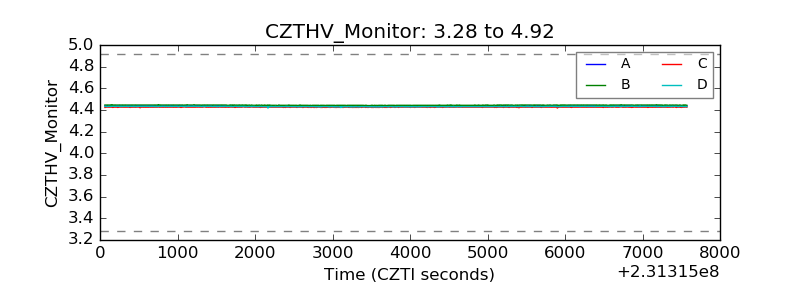 |
| D_VDD | 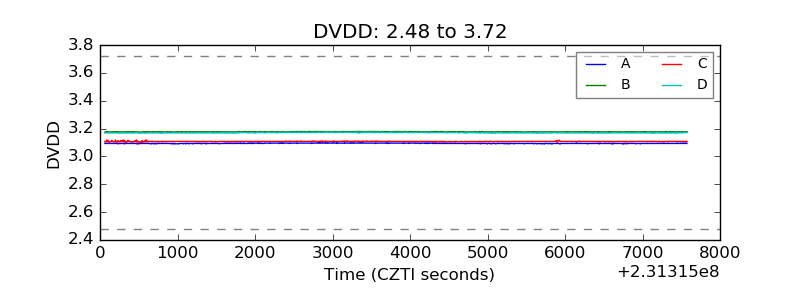 |
| Temperature 1 | 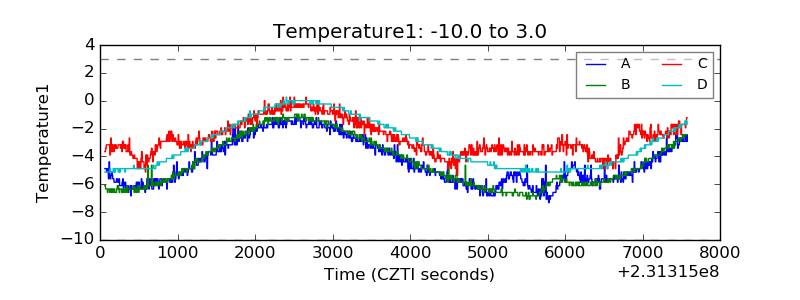 |
| Veto HV Monitor | 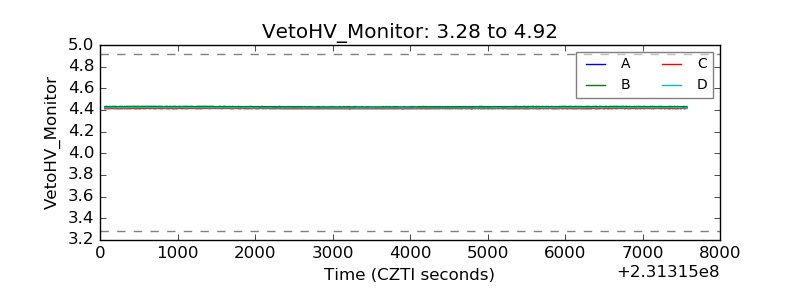 |
| Veto LLD | 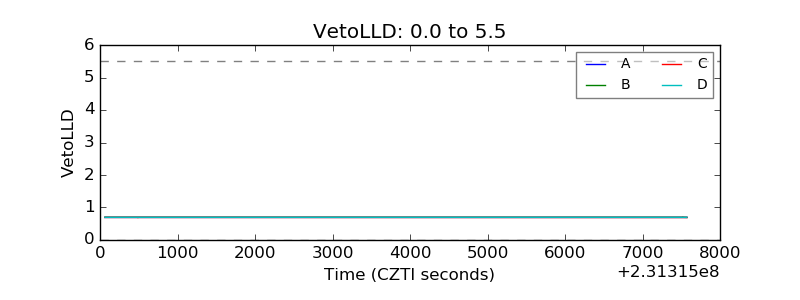 |
| Alpha Counter | 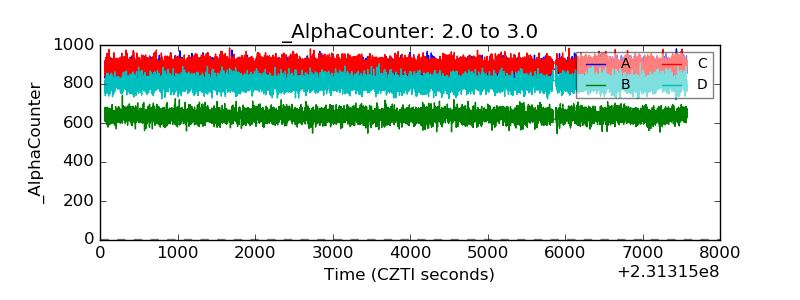 |
| _CPM_Rate | 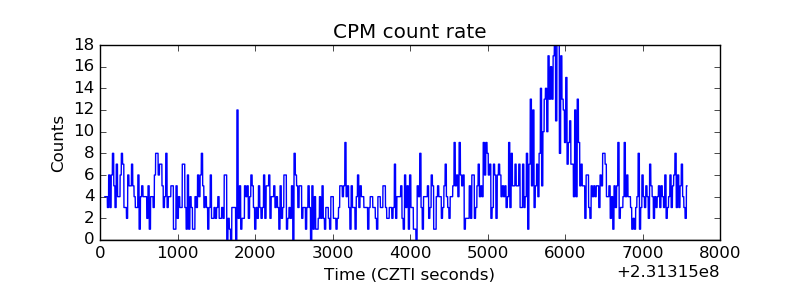 |
| CZT Counter | 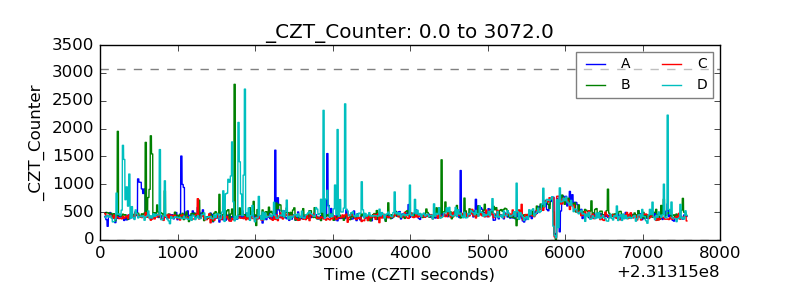 |
| +2.5 Volts monitor | 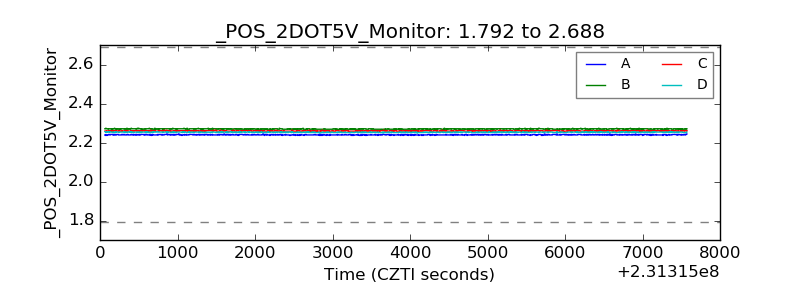 |
| +5 Volts monitor | 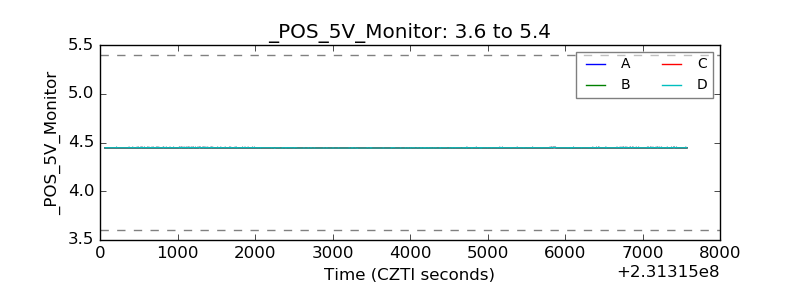 |
| _ROLL_ROT | 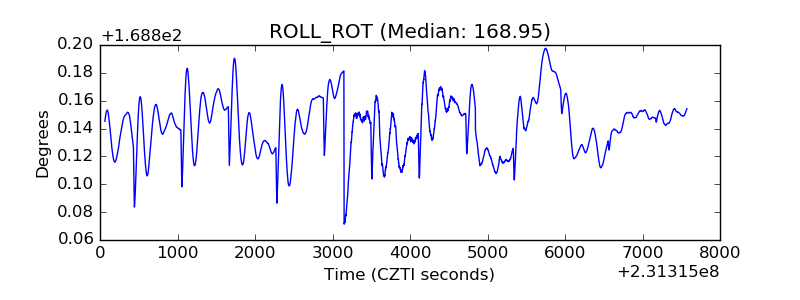 |
| _Roll_DEC | 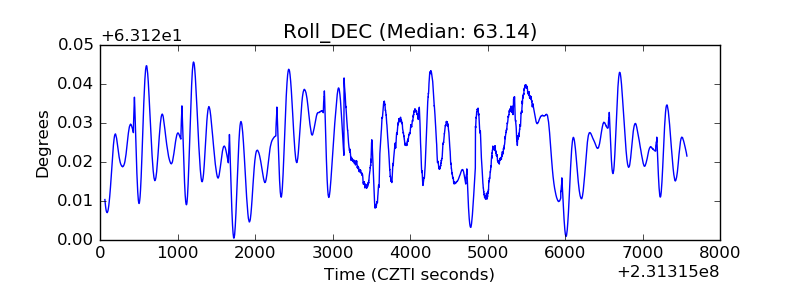 |
| _Roll_RA | 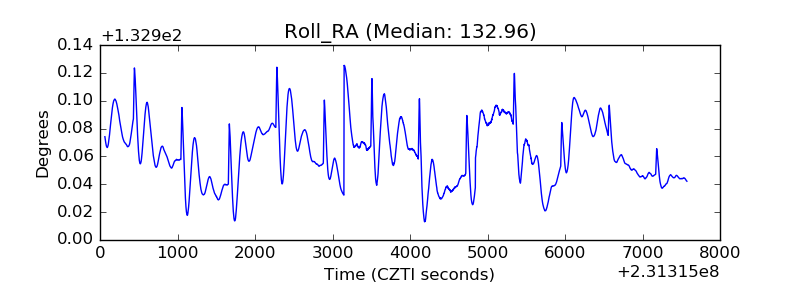 |
| Veto Counter | 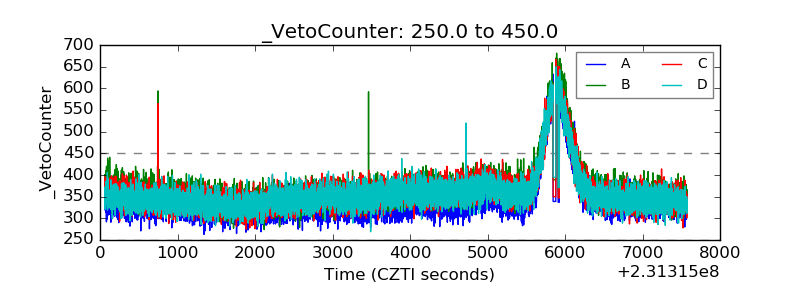 |