| Param | Original file | Final file |
|---|---|---|
| Filename | modeM0/AS1A03_102T01_9000001202_08607cztM0_level2.evt | modeM0/AS1A03_102T01_9000001202_08607cztM0_level2_quad_clean.evt |
| Size (bytes) | 443,759,040 | 99,299,520 |
| Size | 423.2 MB | 94.7 MB |
| Events in quadrant A | 2,761,352 | 652,198 |
| Events in quadrant B | 3,180,309 | 664,901 |
| Events in quadrant C | 2,680,392 | 652,431 |
| Events in quadrant D | 4,401,242 | 610,323 |
| Mode M9 | |||
|---|---|---|---|
| Quadrant | BADHDUFLAG | Total packets | Discarded packets |
| A | 0 | 10 | 0 |
| B | 0 | 10 | 0 |
| C | 0 | 10 | 0 |
| D | 0 | 10 | 0 |
| Mode SS | |||
|---|---|---|---|
| Quadrant | BADHDUFLAG | Total packets | Discarded packets |
| A | 0 | 124 | 0 |
| B | 0 | 124 | 0 |
| C | 0 | 124 | 0 |
| D | 0 | 124 | 0 |
| Mode M0 | |||
|---|---|---|---|
| Quadrant | BADHDUFLAG | Total packets | Discarded packets |
| A | 0 | 12595 | 1 |
| B | 0 | 13623 | 1 |
| C | 0 | 12418 | 1 |
| D | 0 | 17570 | 1 |
| Quadrant | Total seconds | Saturated seconds | Saturation percentage |
|---|---|---|---|
| A | 6122 | 40 | 0.653381% |
| B | 6122 | 80 | 1.306762% |
| C | 6122 | 34 | 0.555374% |
| D | 6122 | 397 | 6.484809% |
Noise dominated data is calculated using 1-second bins in cleaned event files. If a bin has >2000 counts, and if more than 50% of those come from <1% of pixels, then it is considered to be noise-dominated and hence unusable.
| Quadrant | # 1 sec bins | Bins with >0 counts | Bins with >2000 counts | High rate bins dominated by noise | Noise dominated (total time) | Noise dominated (detector-on time) | Marked lightcurve |
|---|---|---|---|---|---|---|---|
| A | 7127 | 6122 | 6 | 6 | 0.08% | 0.10% | 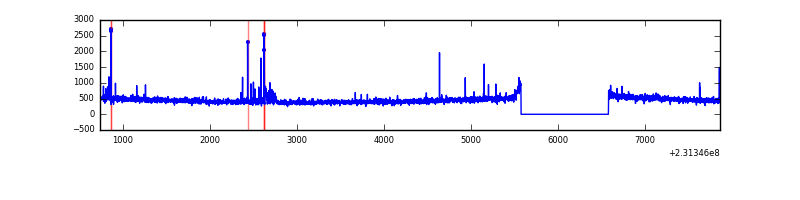 |
| B | 7127 | 6122 | 27 | 27 | 0.38% | 0.44% | 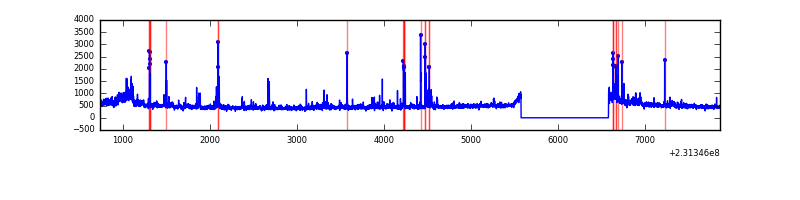 |
| C | 7127 | 6122 | 0 | 0 | 0.00% | 0.00% | 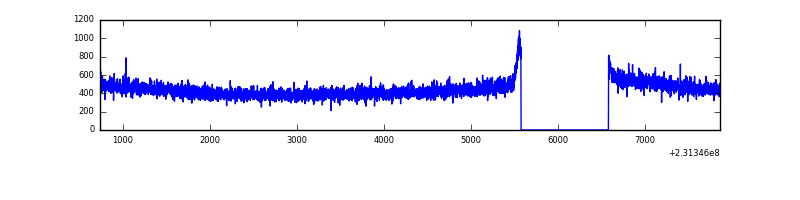 |
| D | 7127 | 6122 | 427 | 427 | 5.99% | 6.97% | 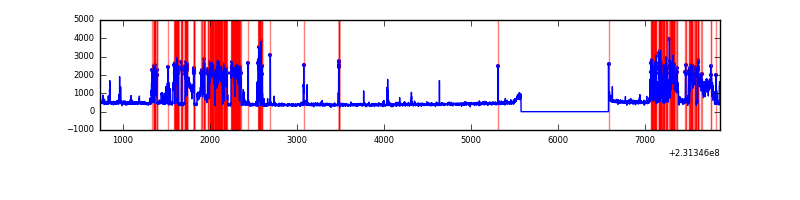 |
Top three noisy pixels from each quadrant. If the there are fewer than three noisy pixels in the level2.evt file, extra rows are filled as -1
| Pixel properties | Quadrant properties | ||||||
|---|---|---|---|---|---|---|---|
| Quadrant | DetID | PixID | Counts | Sigma | Mean | Median | Sigma |
| A | 8 | 5 | 41567 | 287.77 | 693 | 676 | 142.1 |
| A | 5 | 16 | 32933 | 227.01 | 693 | 676 | 142.1 |
| A | 13 | 248 | 13671 | 91.45 | 693 | 676 | 142.1 |
| B | 0 | 219 | 115922 | 860.22 | 701 | 685 | 134.0 |
| B | 10 | 16 | 92363 | 684.35 | 701 | 685 | 134.0 |
| B | 0 | 214 | 68887 | 509.11 | 701 | 685 | 134.0 |
| C | 14 | 64 | 6141 | 34.53 | 683 | 685 | 158.0 |
| C | 13 | 61 | 5065 | 27.72 | 683 | 685 | 158.0 |
| C | 8 | 208 | 3753 | 19.42 | 683 | 685 | 158.0 |
| D | 9 | 102 | 1385479 | 8450.67 | 671 | 651 | 163.9 |
| D | 12 | 233 | 258812 | 1575.38 | 671 | 651 | 163.9 |
| D | 10 | 253 | 90157 | 546.19 | 671 | 651 | 163.9 |
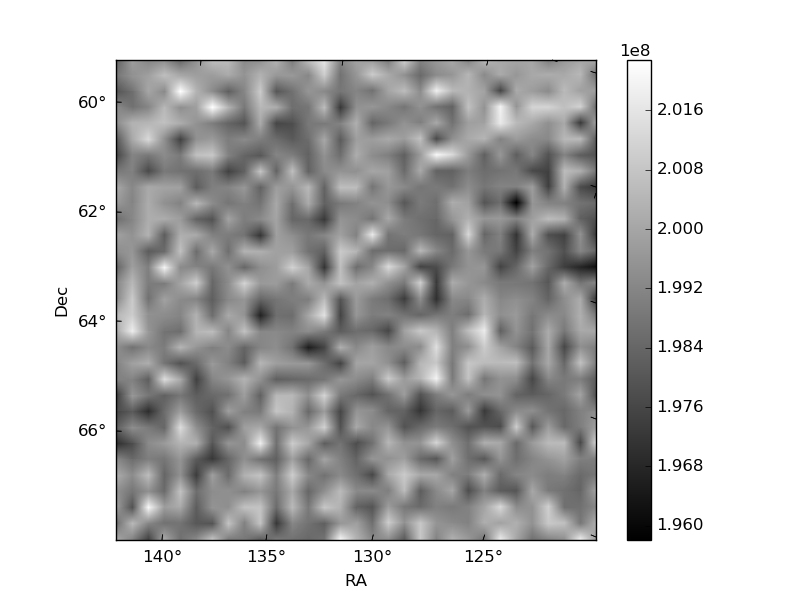
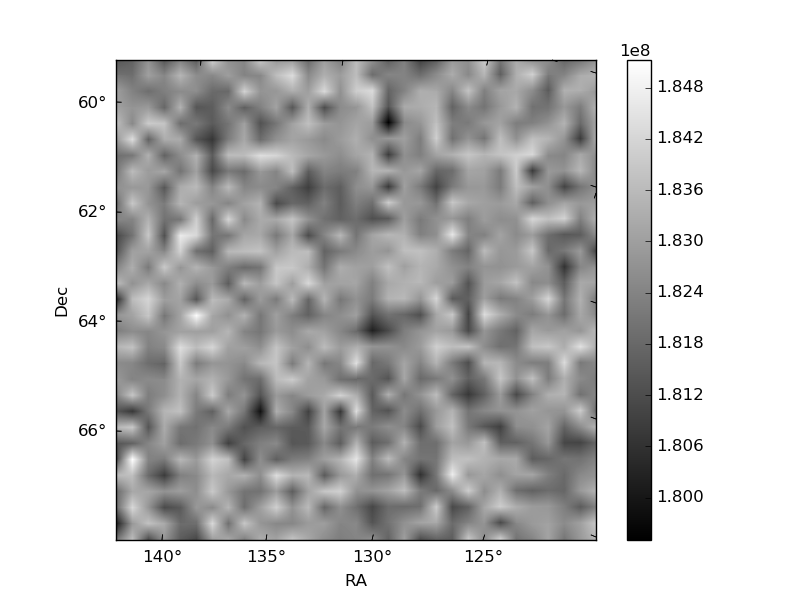
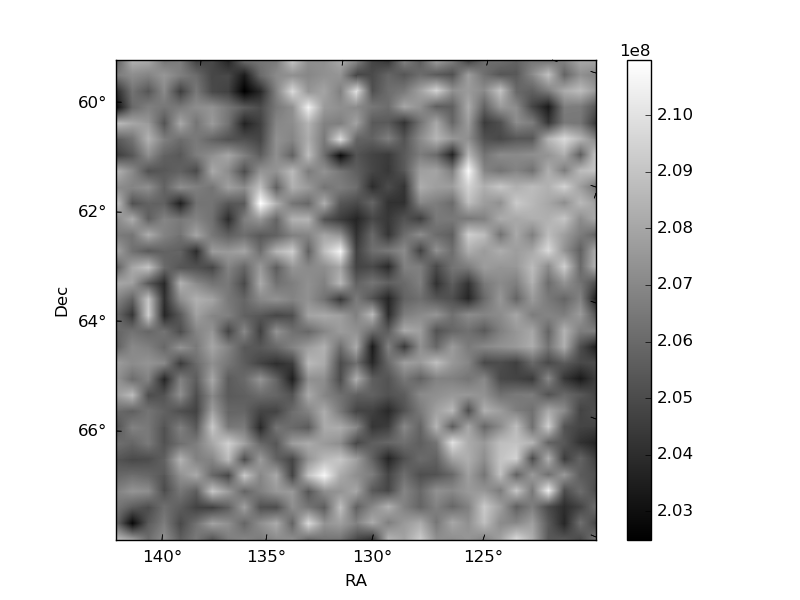
Histogram calculated using DETX and DETY for each event in the final _common_clean file
| Quadrant A |  |
 |
Quadrant B |
|---|---|---|---|
| Quadrant D |  |
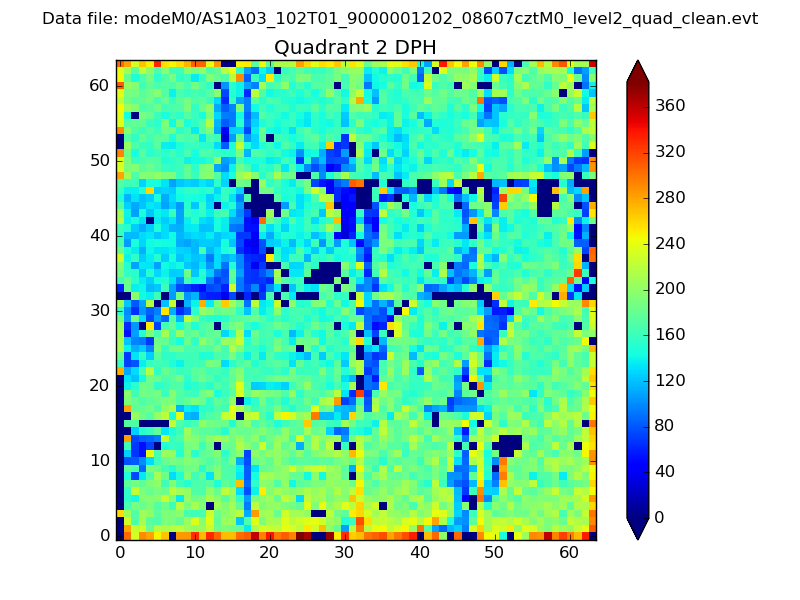 |
Quadrant C |
| Plot type | Count rate plots | Images |
|---|---|---|
| Comparison with Poisson distribution Blue bars denote a histogram of data divided into 1 sec bins. Red curve is a Poisson curve with rate = median count rate of data. |
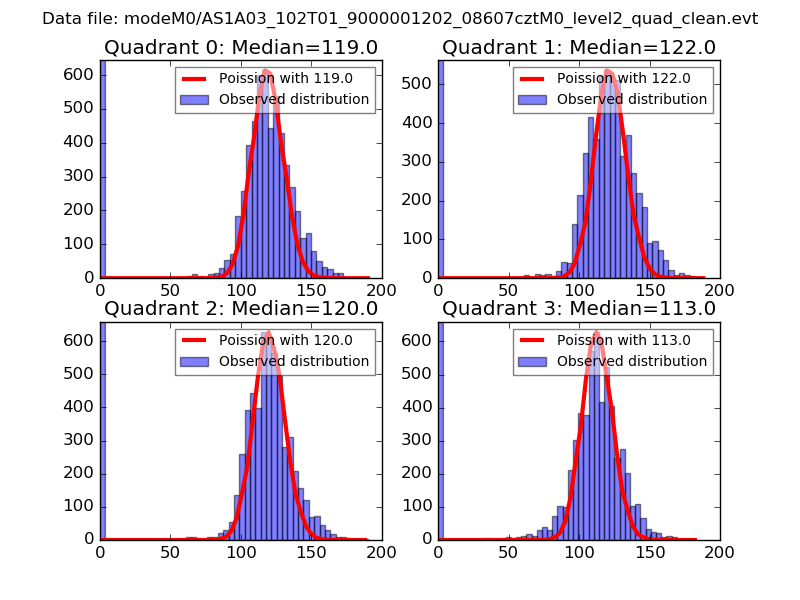 |
 |
| Quadrant-wise count rates Data is divided into 100 sec bins |
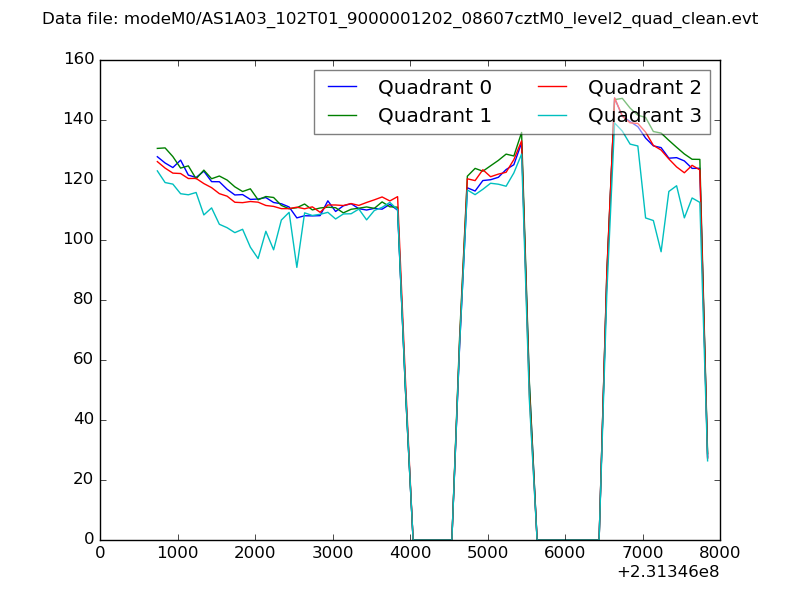 |
|
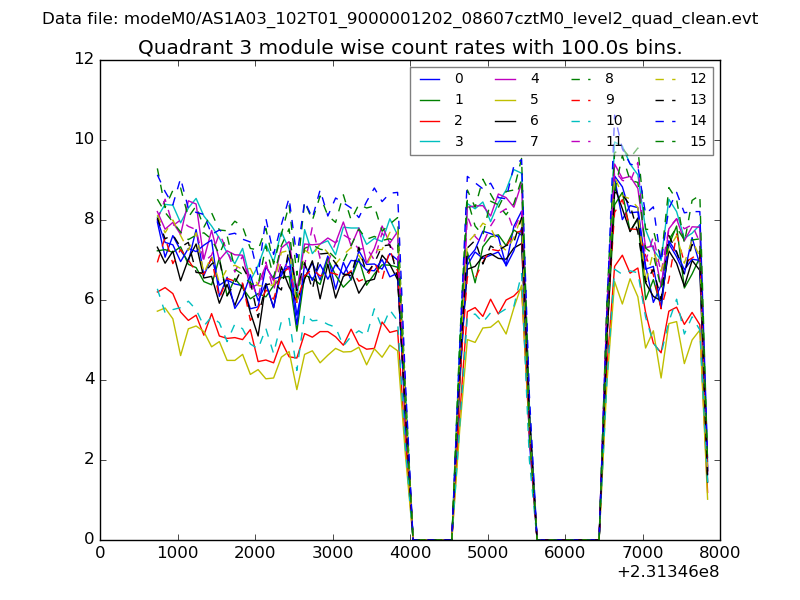
| Module-wise count rates for Quadrant A Data is divided into 100 sec bins |
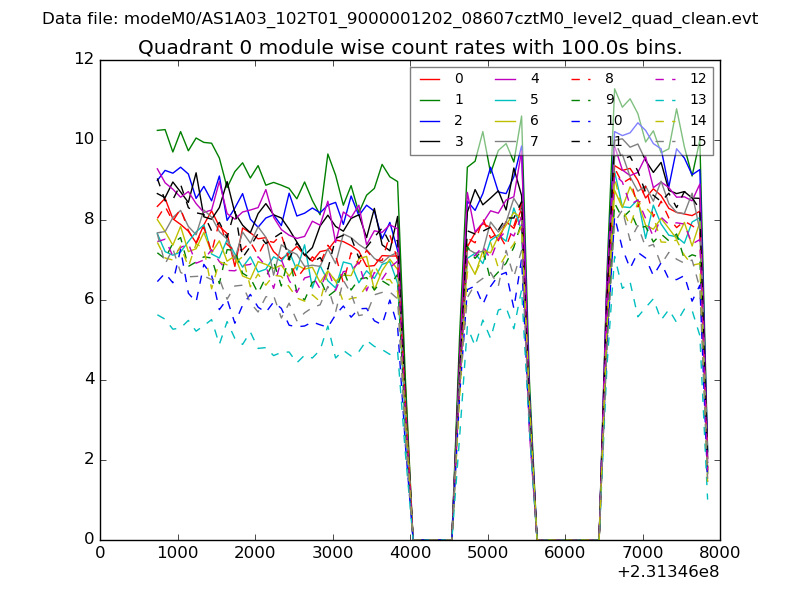 |
 |
| Module-wise count rates for Quadrant B Data is divided into 100 sec bins |
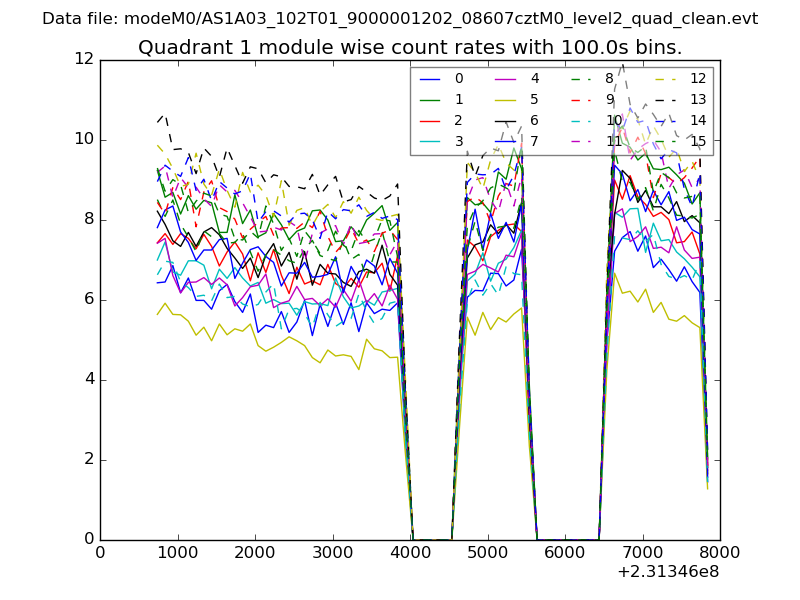 |
 |
| Module-wise count rates for Quadrant C Data is divided into 100 sec bins |
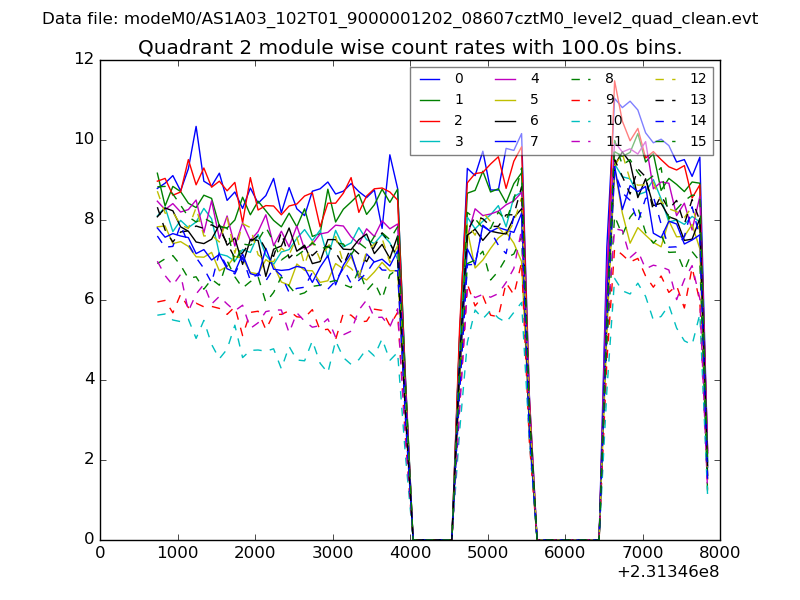 |
 |
| Module-wise count rates for Quadrant D Data is divided into 100 sec bins |
 |
 |
| Parameter | Plot |
|---|---|
| CZT HV Monitor | 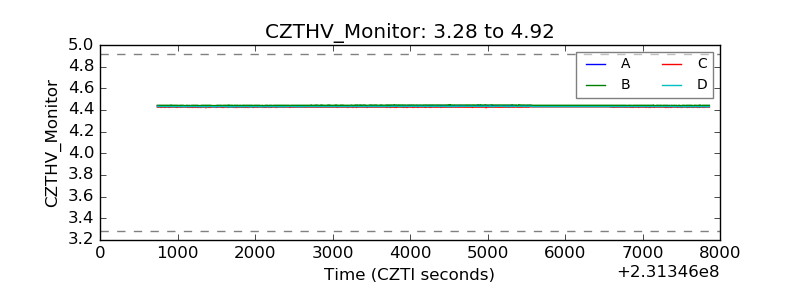 |
| D_VDD | 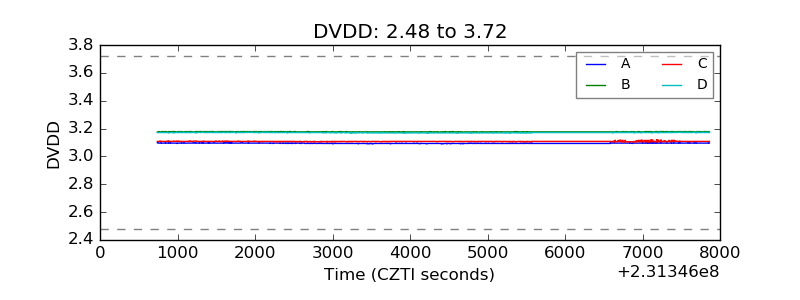 |
| Temperature 1 | 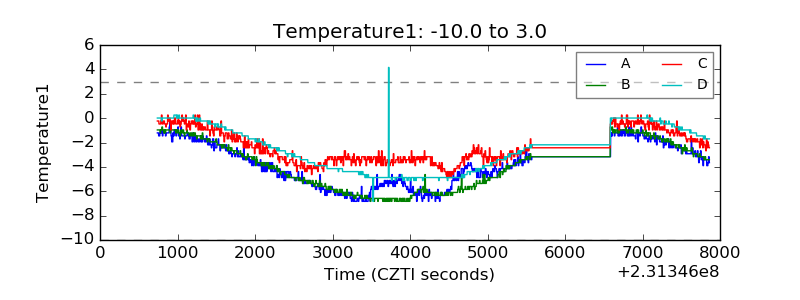 |
| Veto HV Monitor | 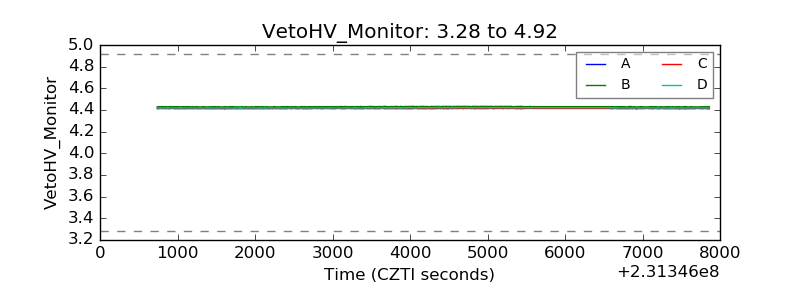 |
| Veto LLD | 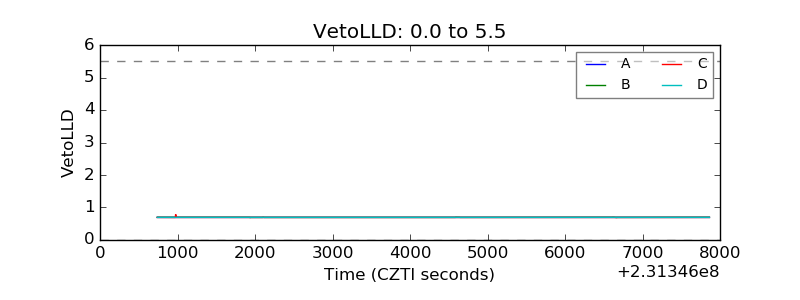 |
| Alpha Counter | 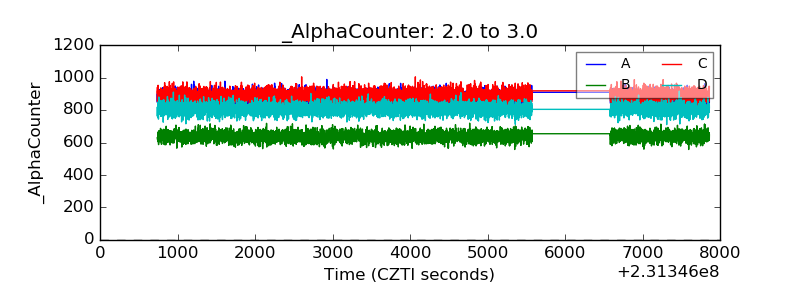 |
| _CPM_Rate | 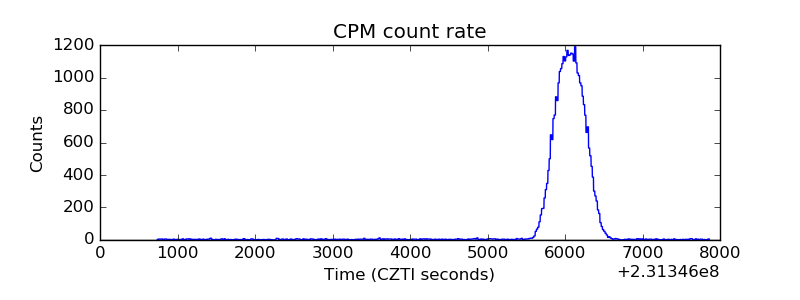 |
| CZT Counter |  |
| +2.5 Volts monitor |  |
| +5 Volts monitor |  |
| _ROLL_ROT | 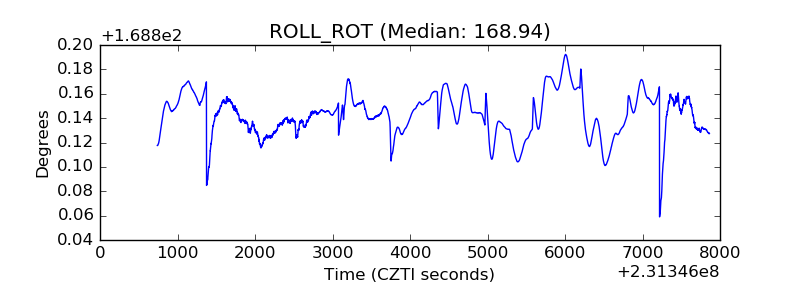 |
| _Roll_DEC | 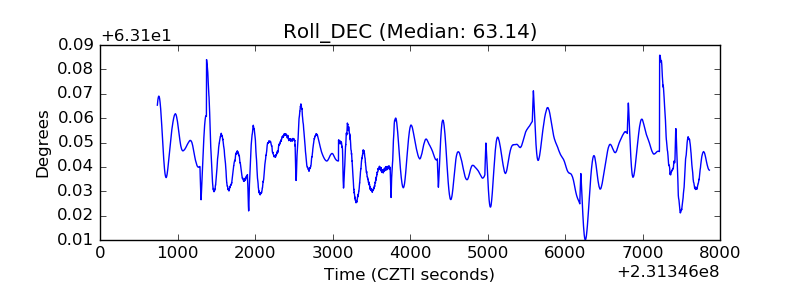 |
| _Roll_RA | 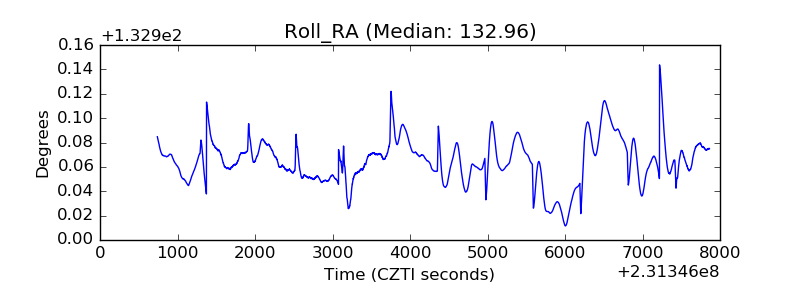 |
| Veto Counter | 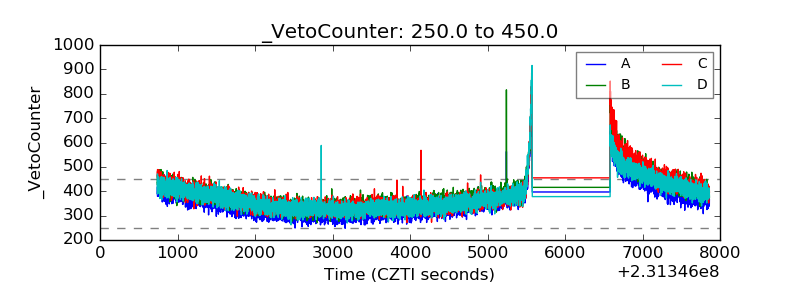 |