| Param | Original file | Final file |
|---|---|---|
| Filename | modeM0/AS1A03_102T01_9000001202_08609cztM0_level2.evt | modeM0/AS1A03_102T01_9000001202_08609cztM0_level2_quad_clean.evt |
| Size (bytes) | 1,939,792,320 | 454,135,680 |
| Size | 1.8 GB | 433.1 MB |
| Events in quadrant A | 13,306,302 | 2,960,436 |
| Events in quadrant B | 15,588,070 | 3,021,762 |
| Events in quadrant C | 12,489,882 | 2,969,288 |
| Events in quadrant D | 15,415,202 | 2,824,072 |
| Mode M9 | |||
|---|---|---|---|
| Quadrant | BADHDUFLAG | Total packets | Discarded packets |
| A | 0 | 31 | 0 |
| B | 0 | 31 | 0 |
| C | 0 | 31 | 0 |
| D | 0 | 31 | 0 |
| Mode SS | |||
|---|---|---|---|
| Quadrant | BADHDUFLAG | Total packets | Discarded packets |
| A | 0 | 590 | 0 |
| B | 0 | 590 | 0 |
| C | 0 | 590 | 0 |
| D | 0 | 590 | 0 |
| Mode M0 | |||
|---|---|---|---|
| Quadrant | BADHDUFLAG | Total packets | Discarded packets |
| A | 0 | 60274 | 6 |
| B | 0 | 65915 | 6 |
| C | 0 | 58502 | 6 |
| D | 0 | 67023 | 6 |
| Quadrant | Total seconds | Saturated seconds | Saturation percentage |
|---|---|---|---|
| A | 28793 | 472 | 1.639287% |
| B | 28793 | 900 | 3.125760% |
| C | 28793 | 250 | 0.868267% |
| D | 28793 | 888 | 3.084083% |
Noise dominated data is calculated using 1-second bins in cleaned event files. If a bin has >2000 counts, and if more than 50% of those come from <1% of pixels, then it is considered to be noise-dominated and hence unusable.
| Quadrant | # 1 sec bins | Bins with >0 counts | Bins with >2000 counts | High rate bins dominated by noise | Noise dominated (total time) | Noise dominated (detector-on time) | Marked lightcurve |
|---|---|---|---|---|---|---|---|
| A | 32074 | 28794 | 94 | 94 | 0.29% | 0.33% |  |
| B | 32074 | 28794 | 465 | 465 | 1.45% | 1.61% |  |
| C | 32074 | 28795 | 0 | 0 | 0.00% | 0.00% | 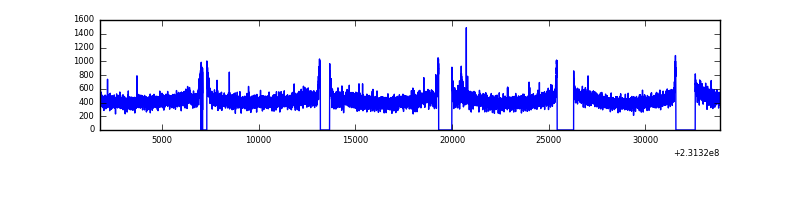 |
| D | 32074 | 28795 | 641 | 641 | 2.00% | 2.23% | 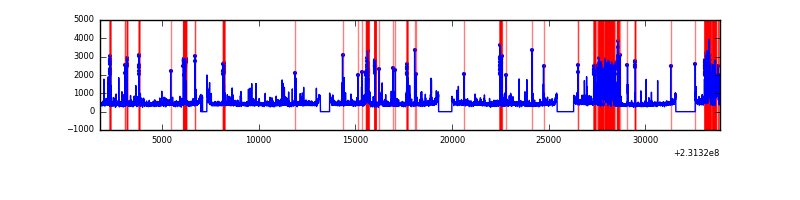 |
Top three noisy pixels from each quadrant. If the there are fewer than three noisy pixels in the level2.evt file, extra rows are filled as -1
| Pixel properties | Quadrant properties | ||||||
|---|---|---|---|---|---|---|---|
| Quadrant | DetID | PixID | Counts | Sigma | Mean | Median | Sigma |
| A | 13 | 248 | 207015 | 312.0 | 3245 | 3166 | 653.4 |
| A | 15 | 223 | 160379 | 240.62 | 3245 | 3166 | 653.4 |
| A | 5 | 16 | 152894 | 229.17 | 3245 | 3166 | 653.4 |
| B | 10 | 16 | 1635774 | 2665.29 | 3253 | 3173 | 612.5 |
| B | 0 | 214 | 352828 | 570.83 | 3253 | 3173 | 612.5 |
| B | 0 | 219 | 246884 | 397.87 | 3253 | 3173 | 612.5 |
| C | 12 | 16 | 49352 | 62.87 | 3181 | 3182 | 734.4 |
| C | 13 | 61 | 24170 | 28.58 | 3181 | 3182 | 734.4 |
| C | 8 | 222 | 18287 | 20.57 | 3181 | 3182 | 734.4 |
| D | 9 | 102 | 1605346 | 2096.38 | 3156 | 3058 | 764.3 |
| D | 12 | 233 | 501384 | 651.99 | 3156 | 3058 | 764.3 |
| D | 13 | 105 | 340111 | 440.99 | 3156 | 3058 | 764.3 |
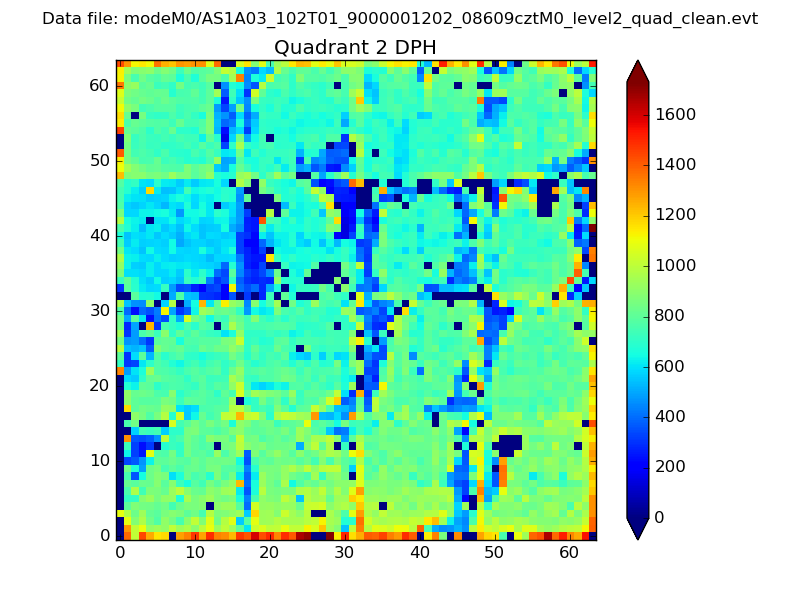
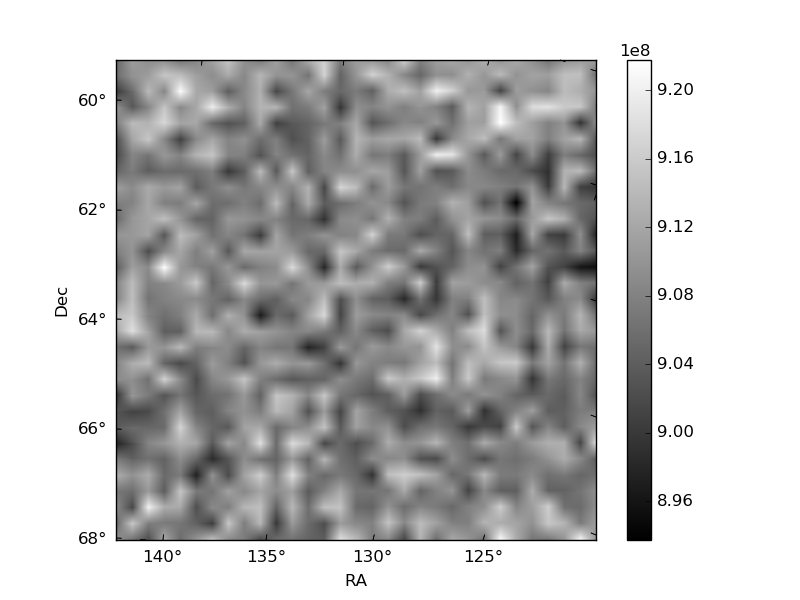
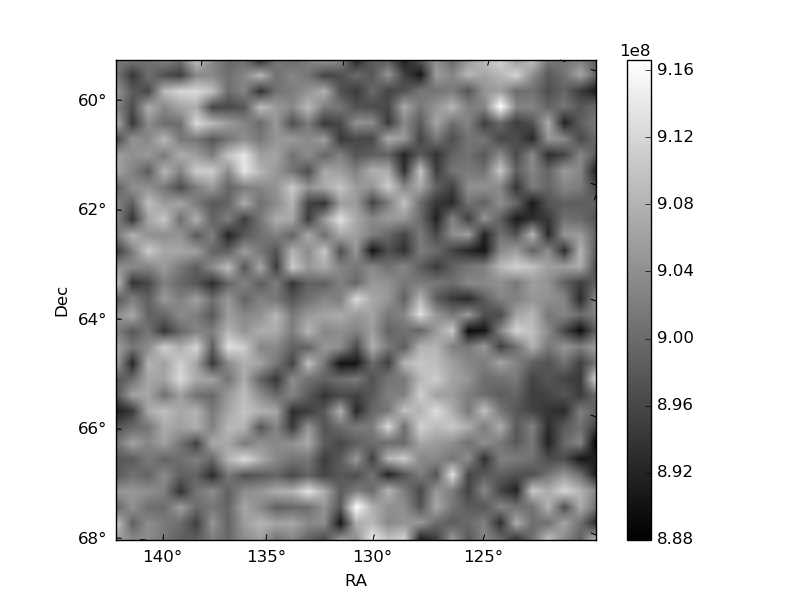
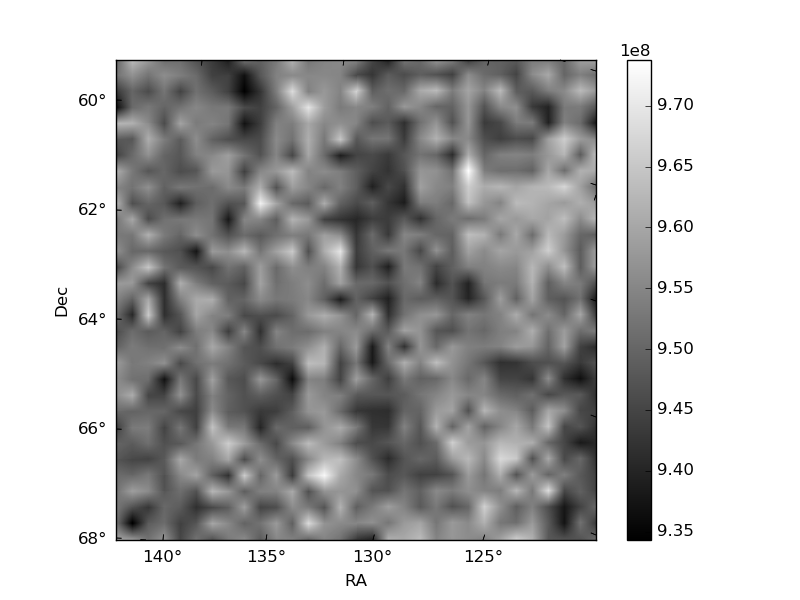
Histogram calculated using DETX and DETY for each event in the final _common_clean file
| Quadrant A | 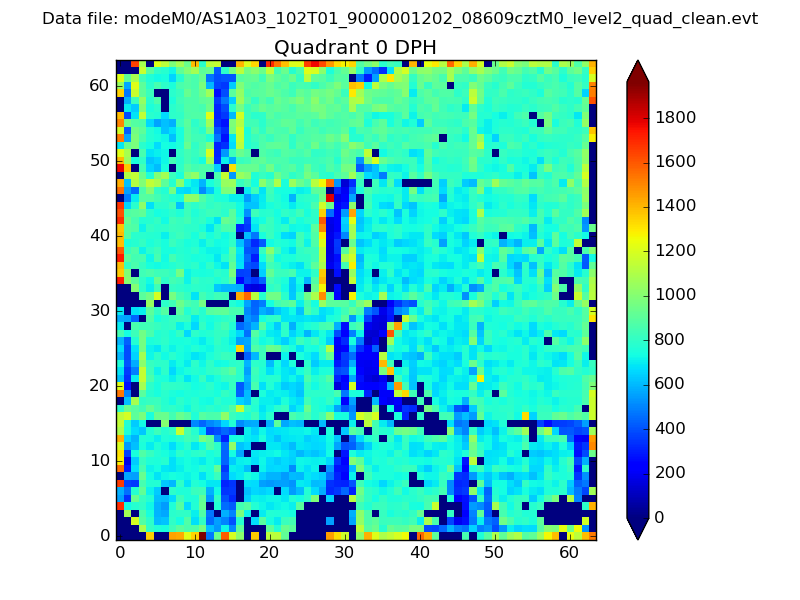 |
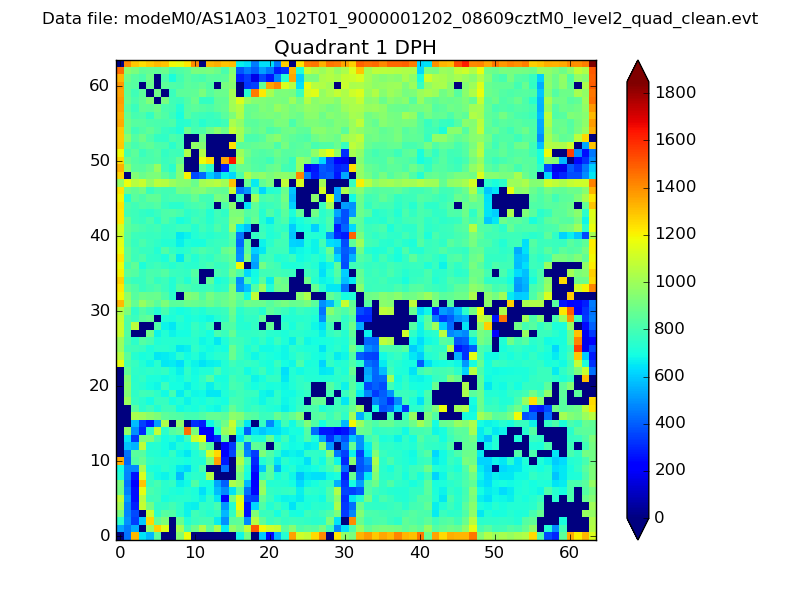 |
Quadrant B |
|---|---|---|---|
| Quadrant D | 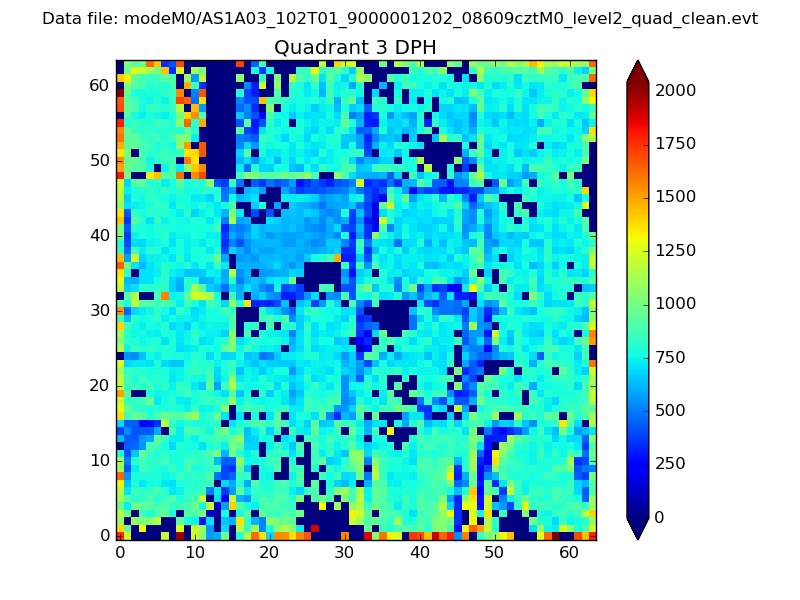 |
 |
Quadrant C |
| Plot type | Count rate plots | Images |
|---|---|---|
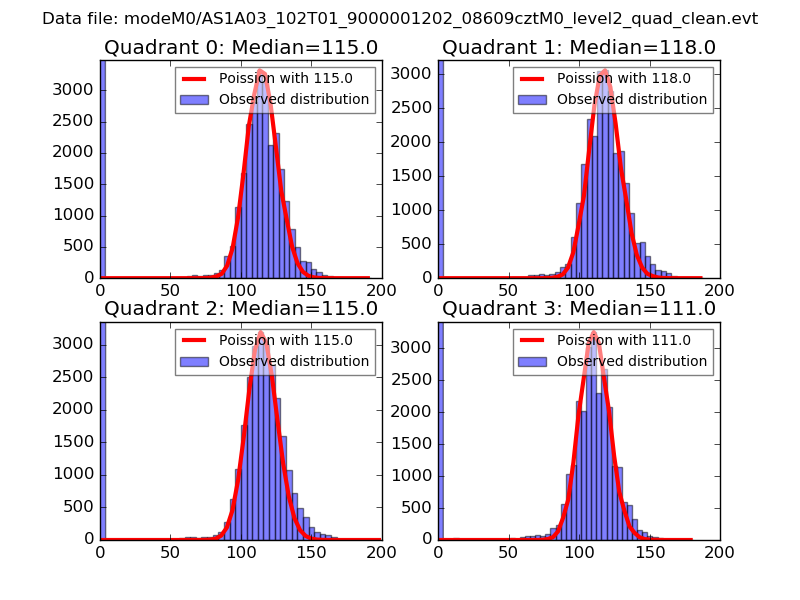
| Comparison with Poisson distribution Blue bars denote a histogram of data divided into 1 sec bins. Red curve is a Poisson curve with rate = median count rate of data. |
 |
 |
| Quadrant-wise count rates Data is divided into 100 sec bins |
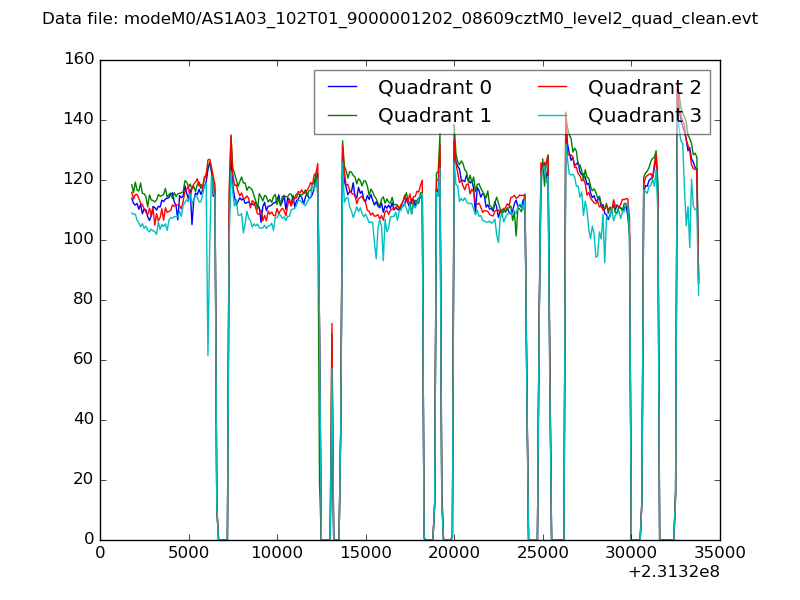 |
|
| Module-wise count rates for Quadrant A Data is divided into 100 sec bins |
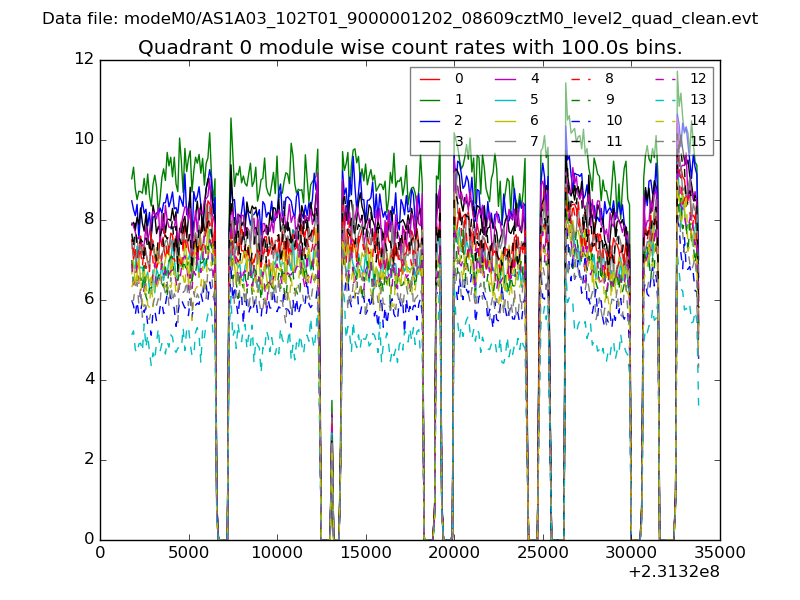 |
 |
| Module-wise count rates for Quadrant B Data is divided into 100 sec bins |
 |
 |
| Module-wise count rates for Quadrant C Data is divided into 100 sec bins |
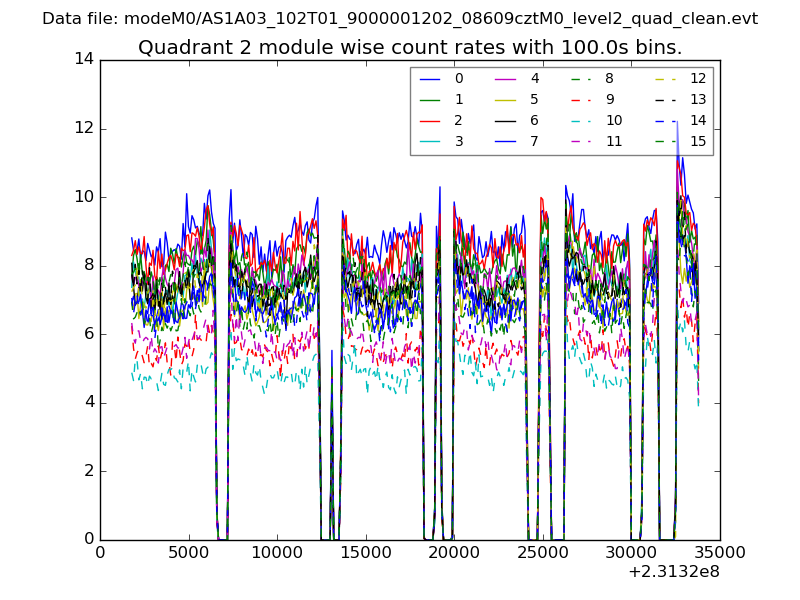 |
 |
| Module-wise count rates for Quadrant D Data is divided into 100 sec bins |
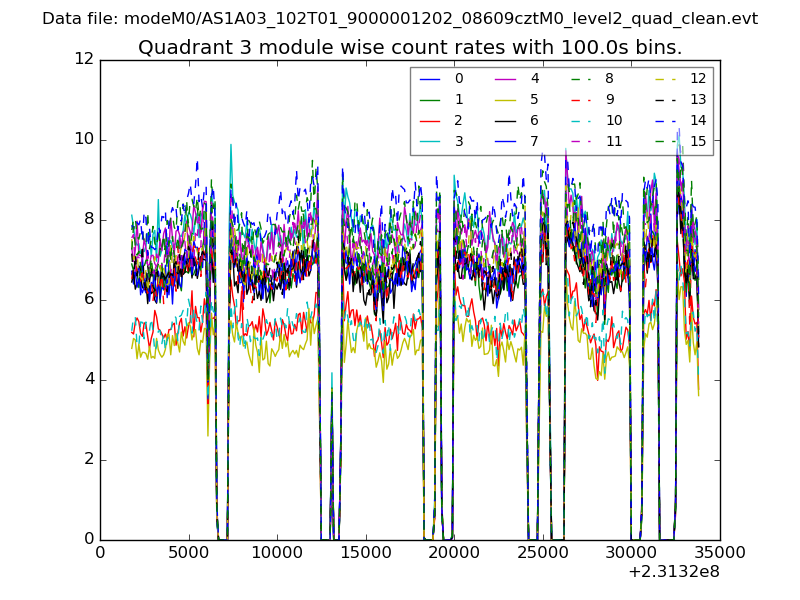 |
 |
| Parameter | Plot |
|---|---|
| CZT HV Monitor | 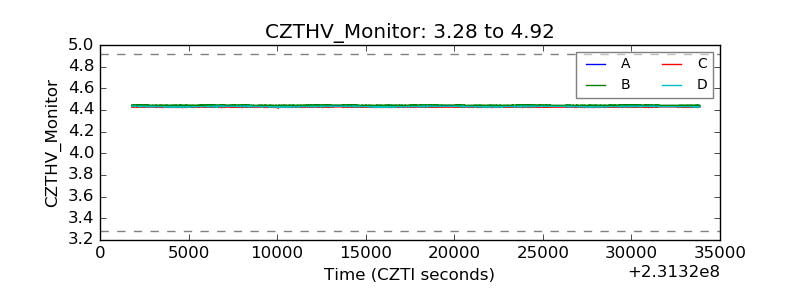 |
| D_VDD | 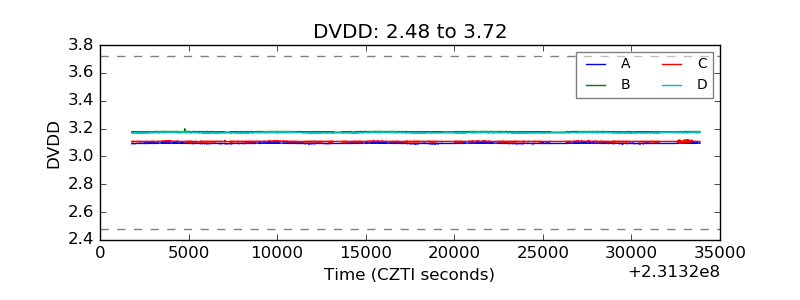 |
| Temperature 1 | 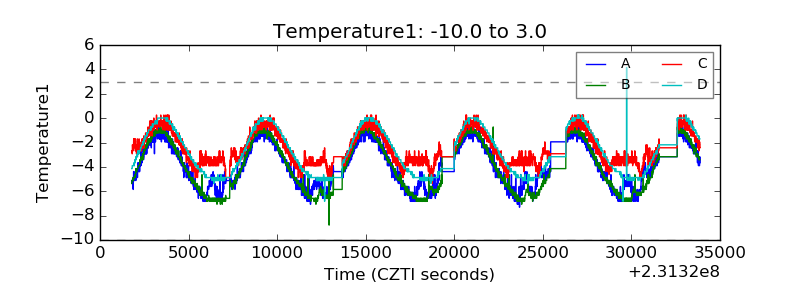 |
| Veto HV Monitor | 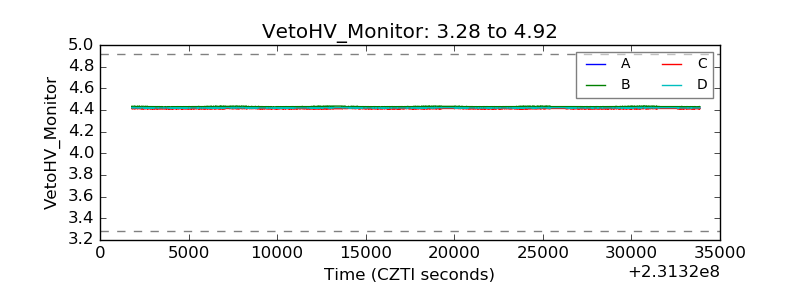 |
| Veto LLD | 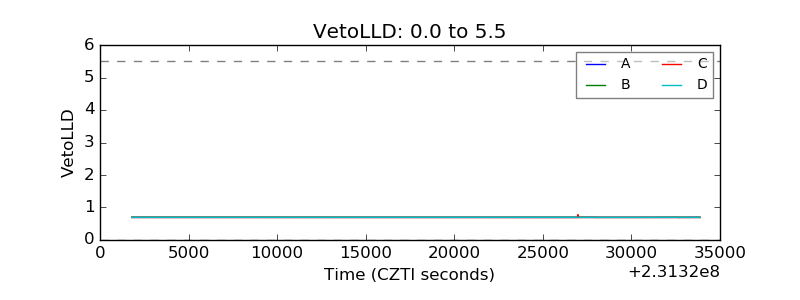 |
| Alpha Counter | 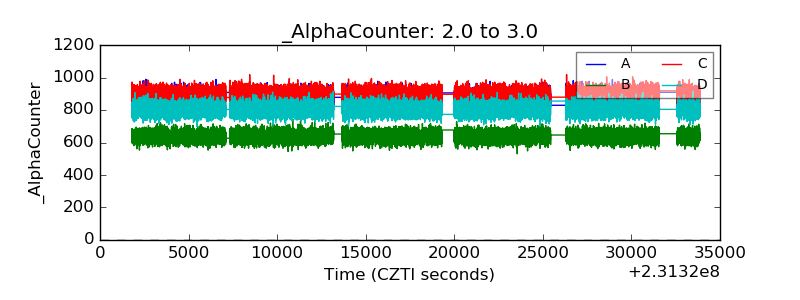 |
| _CPM_Rate | 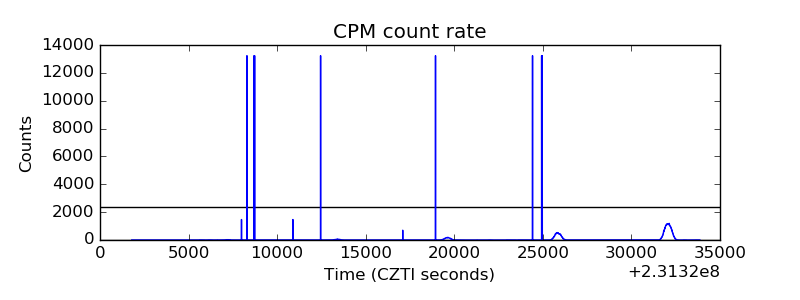 |
| CZT Counter | 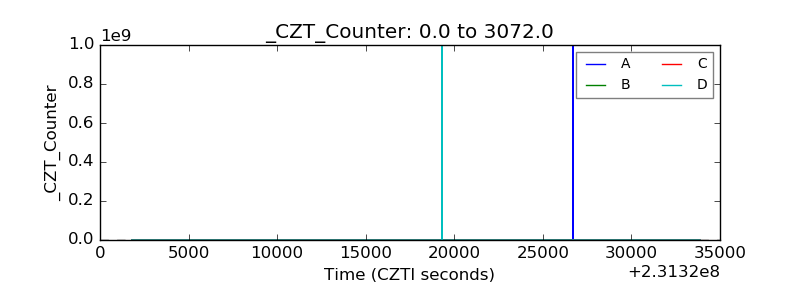 |
| +2.5 Volts monitor |  |
| +5 Volts monitor | 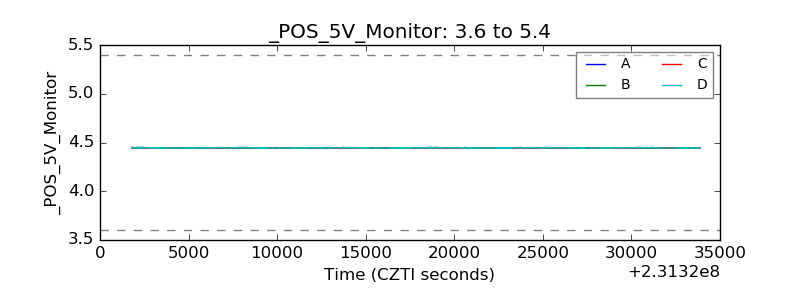 |
| _ROLL_ROT | 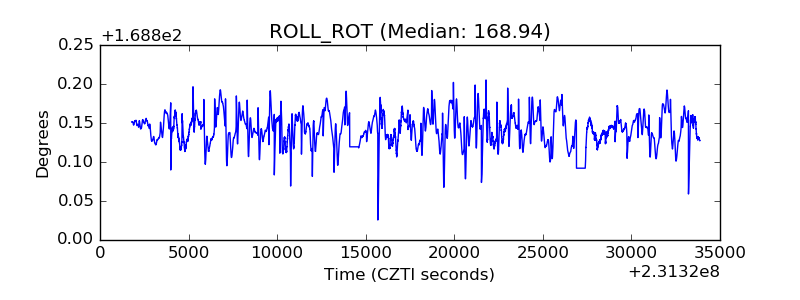 |
| _Roll_DEC | 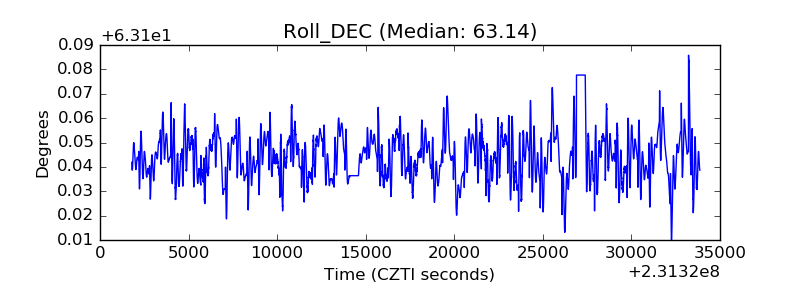 |
| _Roll_RA | 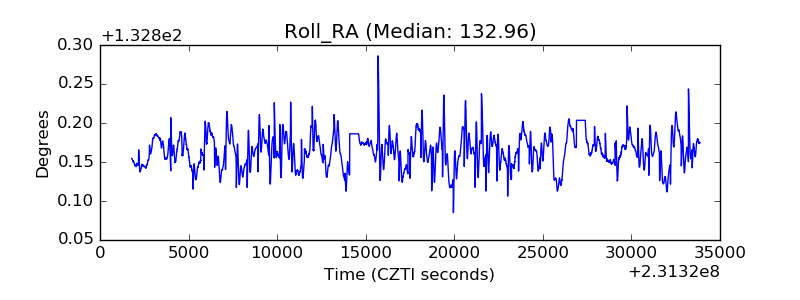 |
| Veto Counter | 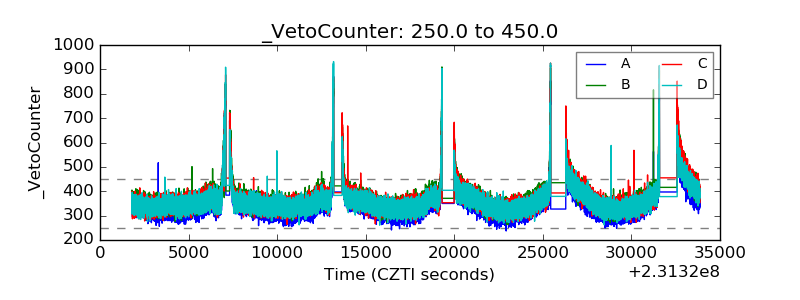 |