| Param | Original file | Final file |
|---|---|---|
| Filename | modeM0/AS1A03_036T01_9000001204cztM0_level2.fits | modeM0/AS1A03_036T01_9000001204cztM0_level2_quad_clean.evt |
| Size (bytes) | 525,674,880 | 565,473,600 |
| Size | 501.3 MB | 539.3 MB |
| Events in quadrant A | 3,120,350 | 3,440,355 |
| Events in quadrant B | 3,029,190 | 3,448,017 |
| Events in quadrant C | 3,114,706 | 3,283,381 |
| Events in quadrant D | 2,663,220 | 2,962,716 |
| Mode M0 | |||
|---|---|---|---|
| Quadrant | BADHDUFLAG | Total packets | Discarded packets |
| A | 0 | 120646 | 0 |
| B | 0 | 132009 | 0 |
| C | 0 | 118821 | 0 |
| D | 0 | 132215 | 0 |
| Mode M9 | |||
|---|---|---|---|
| Quadrant | BADHDUFLAG | Total packets | Discarded packets |
| A | 0 | 76 | 0 |
| B | 0 | 76 | 0 |
| C | 0 | 76 | 0 |
| D | 0 | 77 | 0 |
| Mode SS | |||
|---|---|---|---|
| Quadrant | BADHDUFLAG | Total packets | Discarded packets |
| A | 0 | 1186 | 0 |
| B | 0 | 1186 | 0 |
| C | 0 | 1186 | 0 |
| D | 0 | 1186 | 0 |
| Quadrant | Total seconds | Saturated seconds | Saturation percentage |
|---|---|---|---|
| A | 58158 | 792 | 1.361807% |
| B | 58163 | 1708 | 2.936575% |
| C | 58174 | 474 | 0.814797% |
| D | 58177 | 1576 | 2.708974% |
Noise dominated data is calculated using 1-second bins in cleaned event files. If a bin has >2000 counts, and if more than 50% of those come from <1% of pixels, then it is considered to be noise-dominated and hence unusable.
| Quadrant | # 1 sec bins | Bins with >0 counts | Bins with >2000 counts | High rate bins dominated by noise | Noise dominated (total time) | Noise dominated (detector-on time) | Marked lightcurve |
|---|---|---|---|---|---|---|---|
| A | 66044 | 58196 | 0 | 0 | 0.00% | 0.00% |  |
| B | 66044 | 58176 | 0 | 0 | 0.00% | 0.00% | 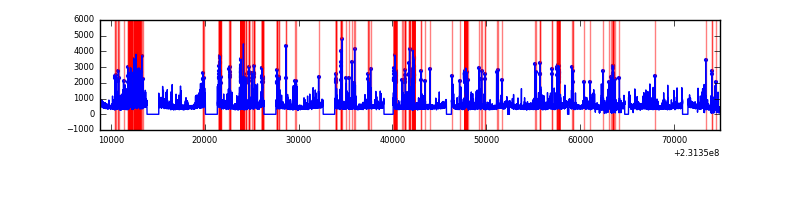 |
| C | 66044 | 58202 | 0 | 0 | 0.00% | 0.00% | 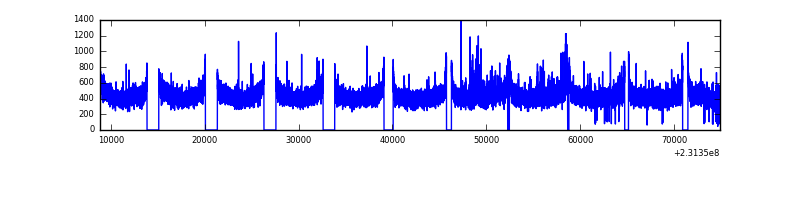 |
| D | 66044 | 58178 | 0 | 0 | 0.00% | 0.00% |  |
Top three noisy pixels from each quadrant. If the there are fewer than three noisy pixels in the level2.evt file, extra rows are filled as -1
| Pixel properties | Quadrant properties | ||||||
|---|---|---|---|---|---|---|---|
| Quadrant | DetID | PixID | Counts | Sigma | Mean | Median | Sigma |
| A | 0 | 29 | 3154 | 11.58 | 812 | 760 | 206.8 |
| A | 7 | 110 | 2617 | 8.98 | 812 | 760 | 206.8 |
| A | 0 | 30 | 2489 | 8.36 | 812 | 760 | 206.8 |
| B | 2 | 9 | 2609 | 11.64 | 801 | 765 | 158.4 |
| B | 5 | 128 | 2076 | 8.28 | 801 | 765 | 158.4 |
| B | 12 | 226 | 2043 | 8.07 | 801 | 765 | 158.4 |
| C | 1 | 80 | 2411 | 7.64 | 823 | 763 | 215.6 |
| C | 1 | 81 | 2371 | 7.46 | 823 | 763 | 215.6 |
| C | 12 | 241 | 2244 | 6.87 | 823 | 763 | 215.6 |
| D | 3 | 14 | 1987 | 6.33 | 758 | 688 | 205.1 |
| D | 7 | 5 | 1946 | 6.13 | 758 | 688 | 205.1 |
| D | 7 | 3 | 1922 | 6.02 | 758 | 688 | 205.1 |
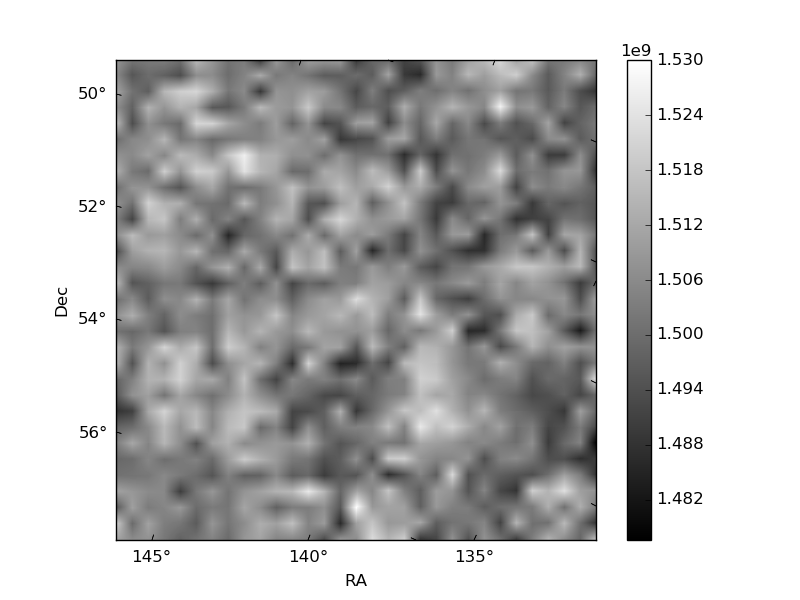
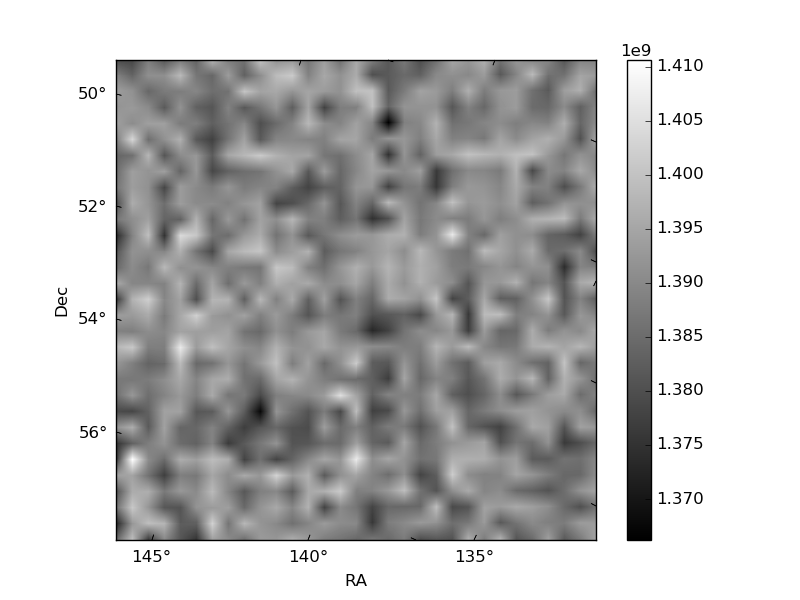
Histogram calculated using DETX and DETY for each event in the final _common_clean file
| Quadrant A | 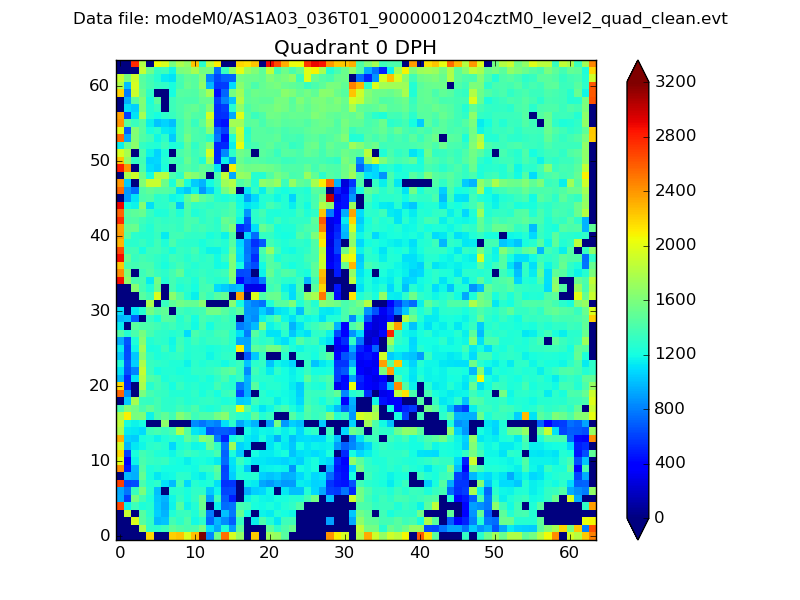 |
 |
Quadrant B |
|---|---|---|---|
| Quadrant D |  |
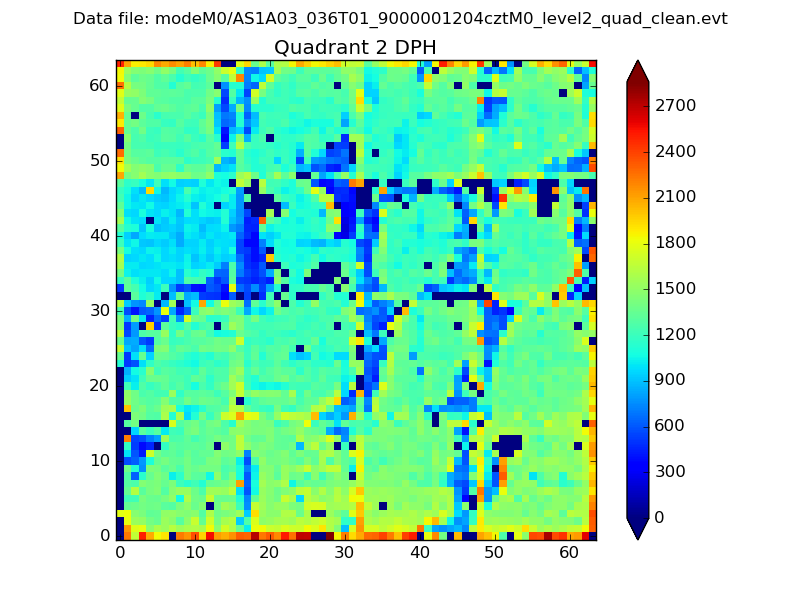 |
Quadrant C |
| Plot type | Count rate plots | Images |
|---|---|---|
| Comparison with Poisson distribution Blue bars denote a histogram of data divided into 1 sec bins. Red curve is a Poisson curve with rate = median count rate of data. |
 |
 |
| Quadrant-wise count rates Data is divided into 100 sec bins |
 |
|
| Module-wise count rates for Quadrant A Data is divided into 100 sec bins |
 |
 |
| Module-wise count rates for Quadrant B Data is divided into 100 sec bins |
 |
 |
| Module-wise count rates for Quadrant C Data is divided into 100 sec bins |
 |
 |
| Module-wise count rates for Quadrant D Data is divided into 100 sec bins |
 |
 |
| Parameter | Plot |
|---|---|
| CZT HV Monitor |  |
| D_VDD |  |
| Temperature 1 |  |
| Veto HV Monitor | 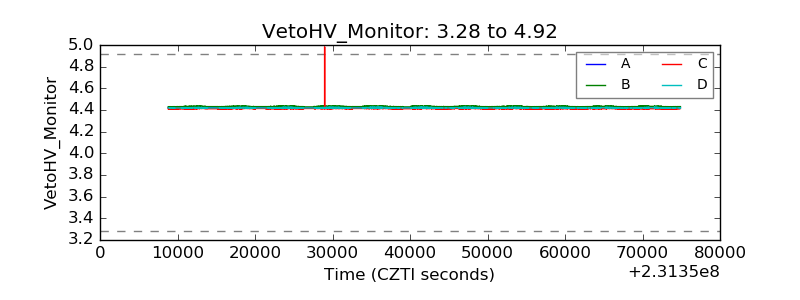 |
| Veto LLD |  |
| Alpha Counter |  |
| _CPM_Rate |  |
| CZT Counter |  |
| +2.5 Volts monitor |  |
| +5 Volts monitor |  |
| _ROLL_ROT |  |
| _Roll_DEC |  |
| _Roll_RA |  |
| Veto Counter |  |