| Param | Original file | Final file |
|---|---|---|
| Filename | modeM0/AS1A03_036T01_9000001204_08609cztM0_level2.evt | modeM0/AS1A03_036T01_9000001204_08609cztM0_level2_quad_clean.evt |
| Size (bytes) | 428,607,360 | 92,975,040 |
| Size | 408.8 MB | 88.7 MB |
| Events in quadrant A | 2,886,313 | 599,338 |
| Events in quadrant B | 3,609,399 | 616,011 |
| Events in quadrant C | 2,801,998 | 604,968 |
| Events in quadrant D | 3,261,719 | 563,331 |
| Mode M0 | |||
|---|---|---|---|
| Quadrant | BADHDUFLAG | Total packets | Discarded packets |
| A | 0 | 12899 | 3 |
| B | 0 | 14790 | 2 |
| C | 0 | 12621 | 2 |
| D | 0 | 14125 | 2 |
| Mode M9 | |||
|---|---|---|---|
| Quadrant | BADHDUFLAG | Total packets | Discarded packets |
| A | 0 | 20 | 0 |
| B | 0 | 20 | 0 |
| C | 0 | 20 | 0 |
| D | 0 | 21 | 0 |
| Mode SS | |||
|---|---|---|---|
| Quadrant | BADHDUFLAG | Total packets | Discarded packets |
| A | 0 | 128 | 0 |
| B | 0 | 128 | 0 |
| C | 0 | 128 | 0 |
| D | 0 | 128 | 0 |
| Quadrant | Total seconds | Saturated seconds | Saturation percentage |
|---|---|---|---|
| A | 6181 | 41 | 0.663323% |
| B | 6181 | 187 | 3.025400% |
| C | 6181 | 17 | 0.275036% |
| D | 6181 | 91 | 1.472254% |
Noise dominated data is calculated using 1-second bins in cleaned event files. If a bin has >2000 counts, and if more than 50% of those come from <1% of pixels, then it is considered to be noise-dominated and hence unusable.
| Quadrant | # 1 sec bins | Bins with >0 counts | Bins with >2000 counts | High rate bins dominated by noise | Noise dominated (total time) | Noise dominated (detector-on time) | Marked lightcurve |
|---|---|---|---|---|---|---|---|
| A | 7466 | 6182 | 18 | 18 | 0.24% | 0.29% | 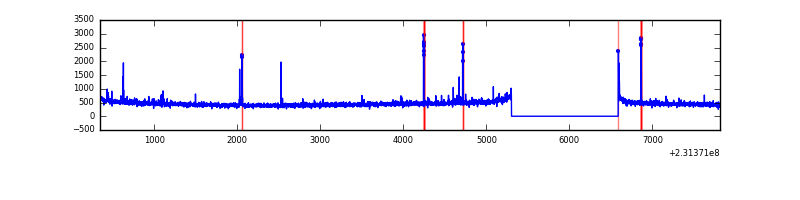 |
| B | 7466 | 6182 | 121 | 121 | 1.62% | 1.96% | 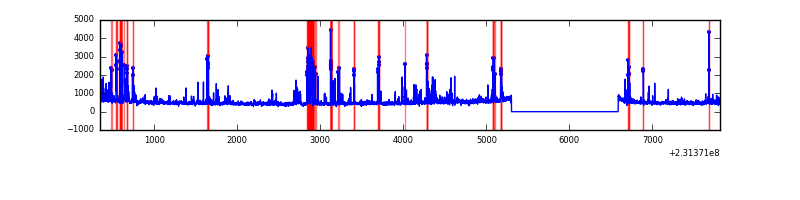 |
| C | 7466 | 6182 | 0 | 0 | 0.00% | 0.00% | 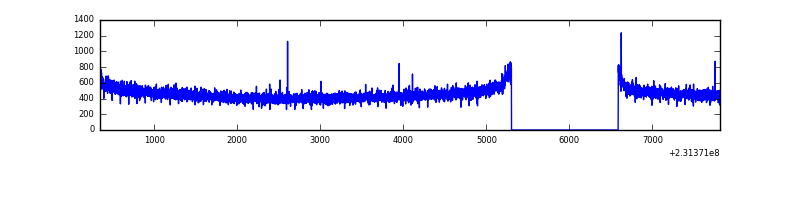 |
| D | 7466 | 6182 | 63 | 63 | 0.84% | 1.02% | 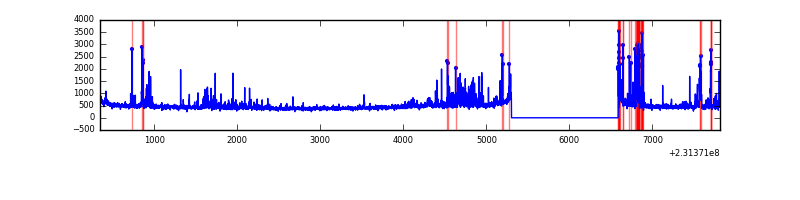 |
Top three noisy pixels from each quadrant. If the there are fewer than three noisy pixels in the level2.evt file, extra rows are filled as -1
| Pixel properties | Quadrant properties | ||||||
|---|---|---|---|---|---|---|---|
| Quadrant | DetID | PixID | Counts | Sigma | Mean | Median | Sigma |
| A | 15 | 174 | 55216 | 374.62 | 722 | 707 | 145.5 |
| A | 13 | 248 | 27099 | 181.38 | 722 | 707 | 145.5 |
| A | 5 | 16 | 22805 | 151.87 | 722 | 707 | 145.5 |
| B | 10 | 16 | 448330 | 3264.94 | 733 | 715 | 137.1 |
| B | 10 | 246 | 106260 | 769.85 | 733 | 715 | 137.1 |
| B | 0 | 214 | 77406 | 559.39 | 733 | 715 | 137.1 |
| C | 13 | 61 | 5504 | 29.14 | 715 | 720 | 164.2 |
| C | 8 | 128 | 4455 | 22.75 | 715 | 720 | 164.2 |
| C | 8 | 222 | 3594 | 17.51 | 715 | 720 | 164.2 |
| D | 2 | 136 | 241183 | 1418.01 | 699 | 680 | 169.6 |
| D | 7 | 71 | 106528 | 624.08 | 699 | 680 | 169.6 |
| D | 10 | 253 | 96508 | 565.0 | 699 | 680 | 169.6 |
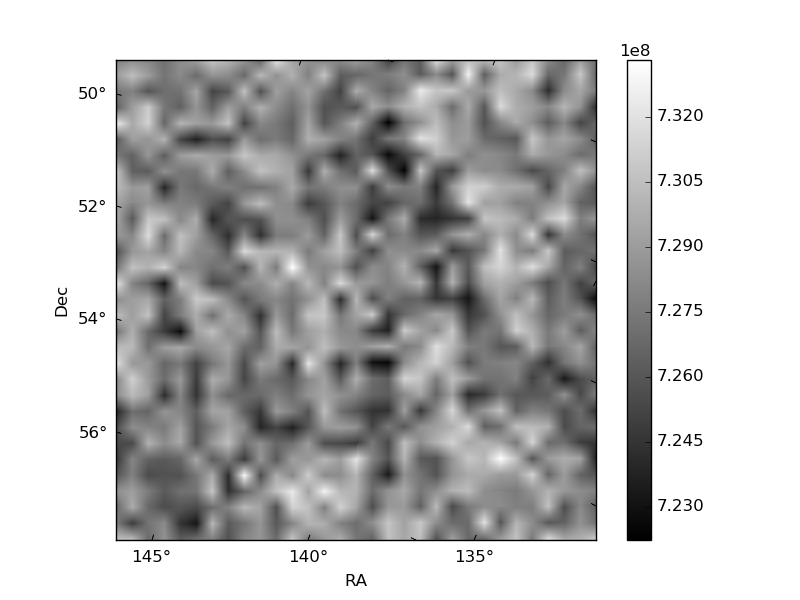
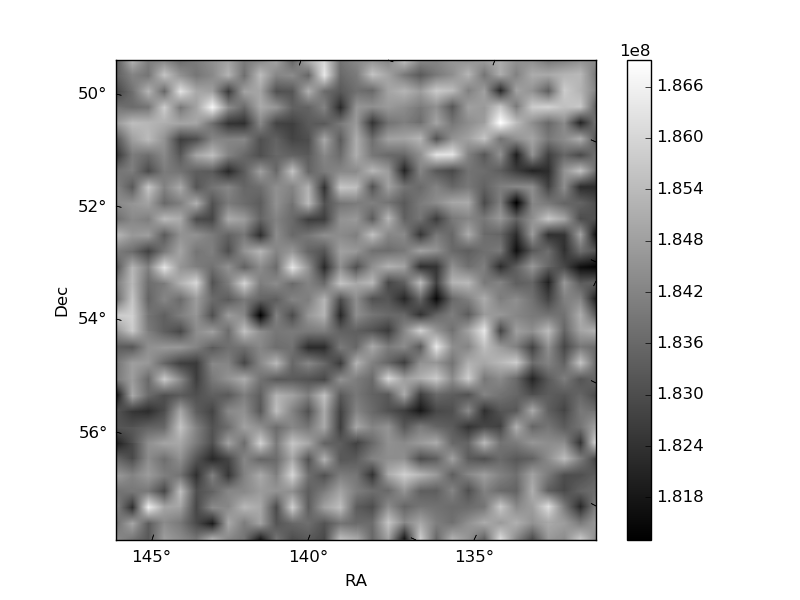
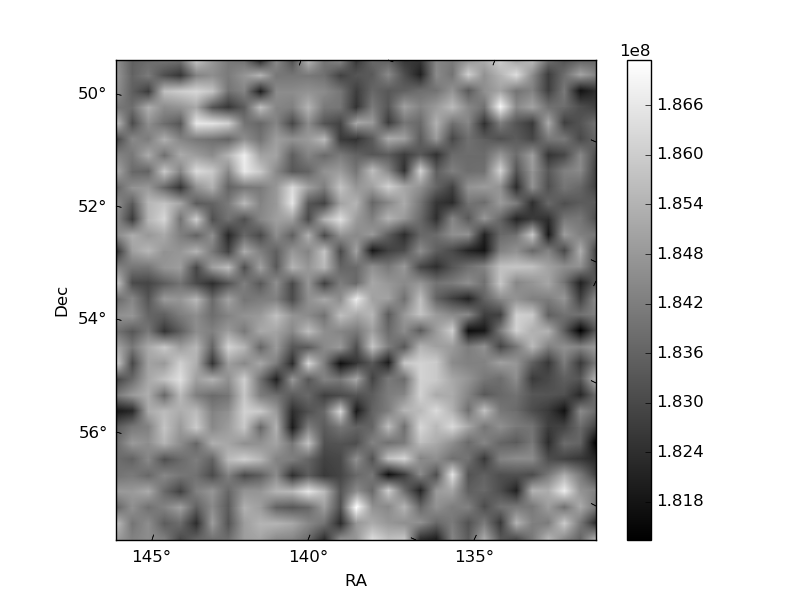
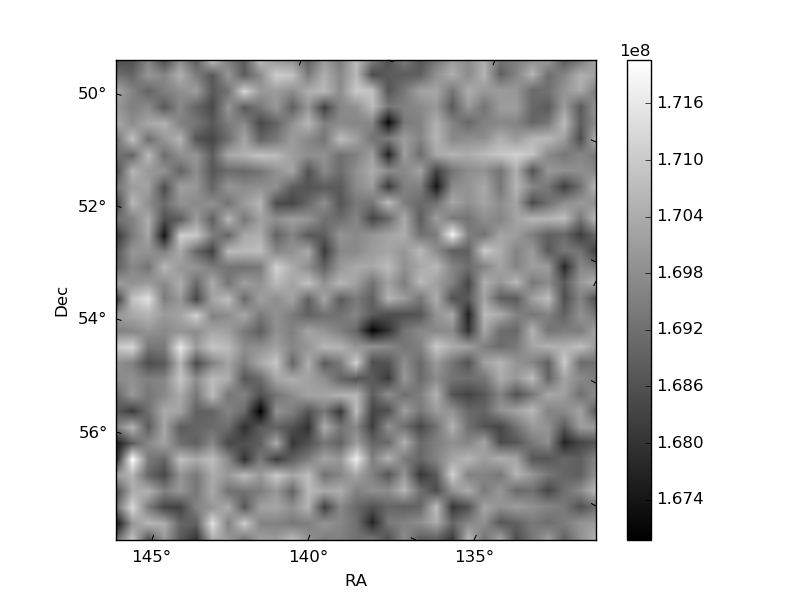
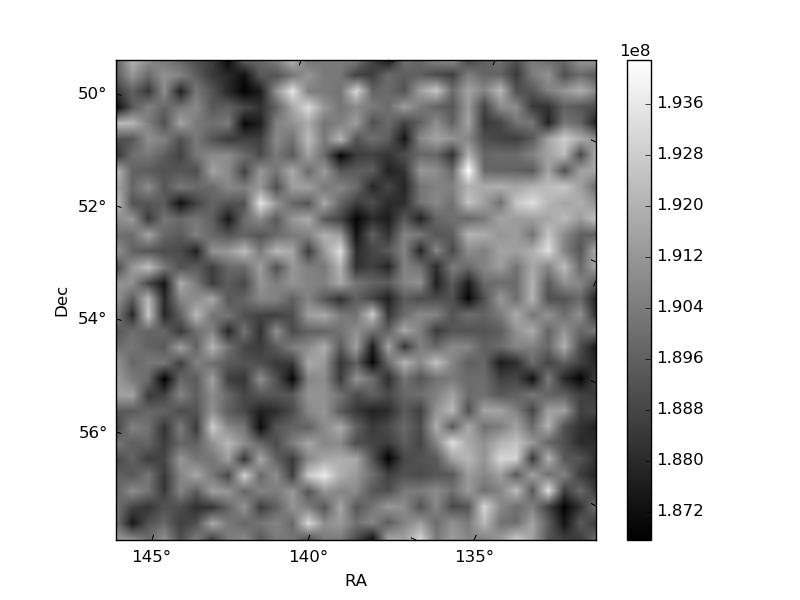
Histogram calculated using DETX and DETY for each event in the final _common_clean file
| Quadrant A | 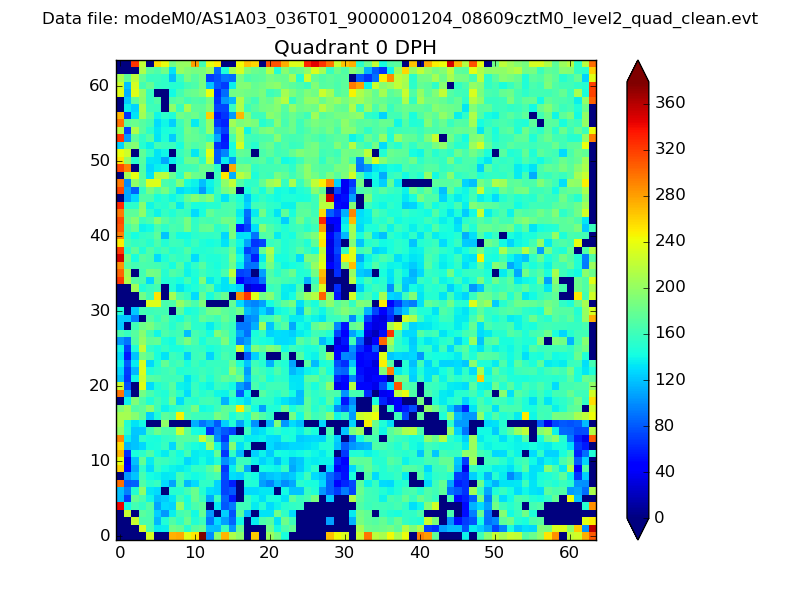 |
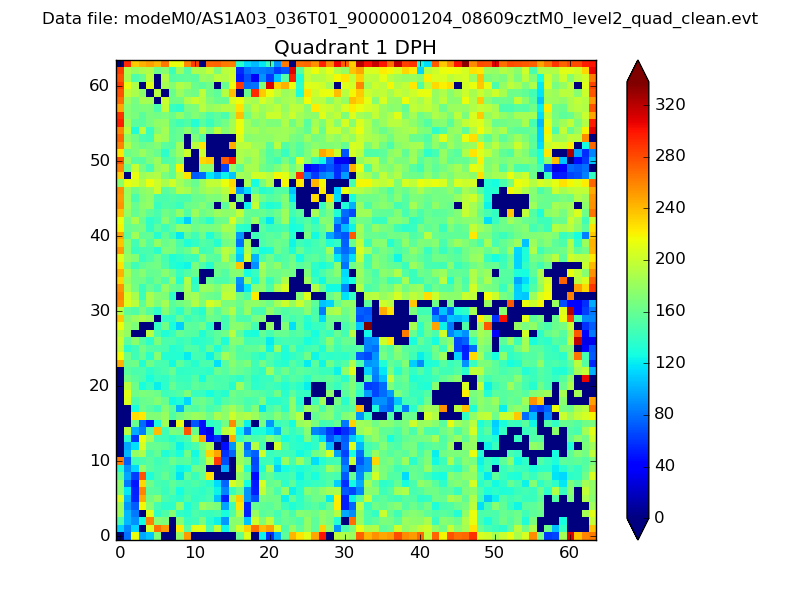 |
Quadrant B |
|---|---|---|---|
| Quadrant D | 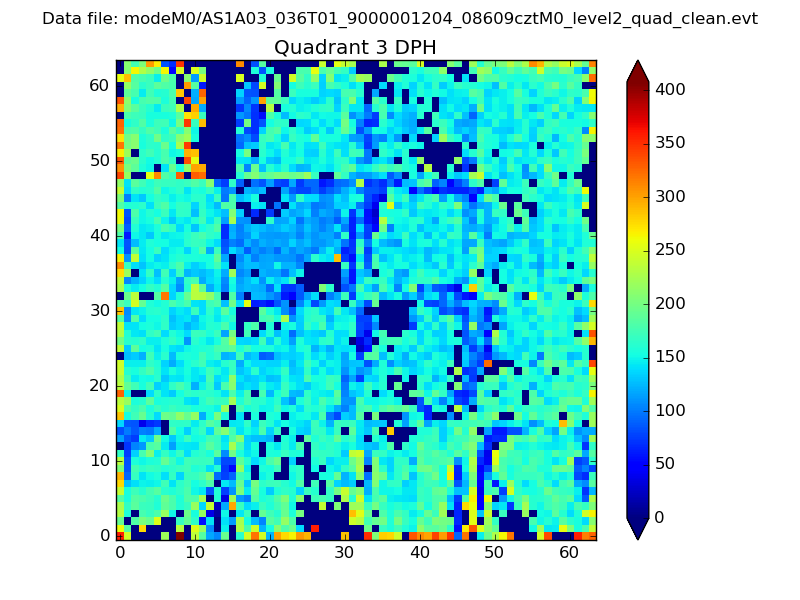 |
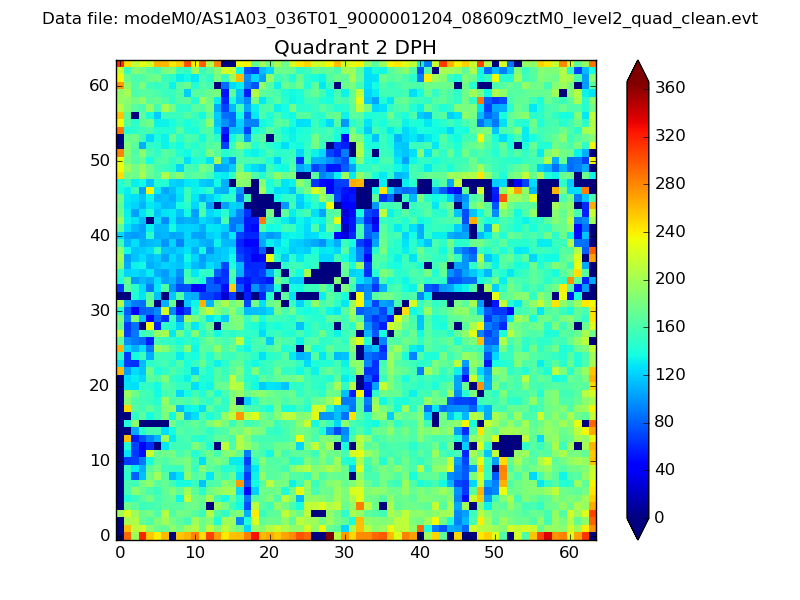 |
Quadrant C |
| Plot type | Count rate plots | Images |
|---|---|---|
| Comparison with Poisson distribution Blue bars denote a histogram of data divided into 1 sec bins. Red curve is a Poisson curve with rate = median count rate of data. |
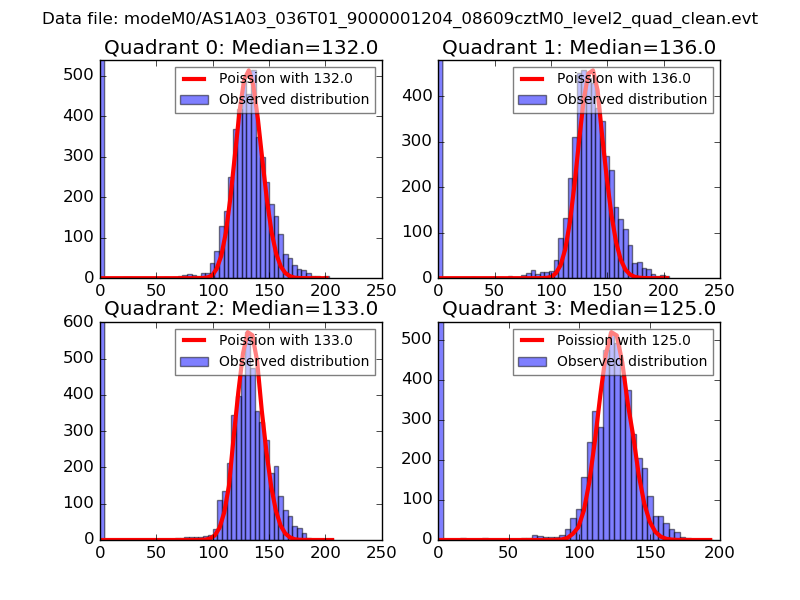 |
 |
| Quadrant-wise count rates Data is divided into 100 sec bins |
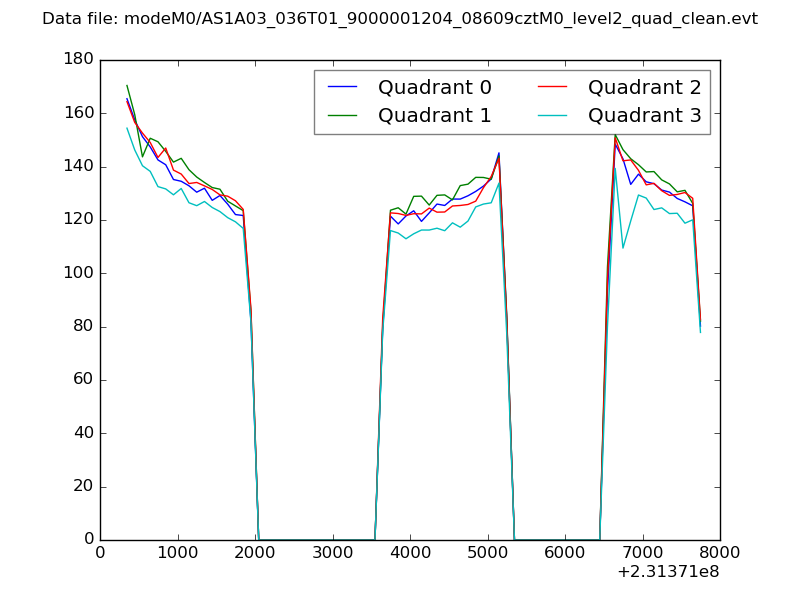 |
|
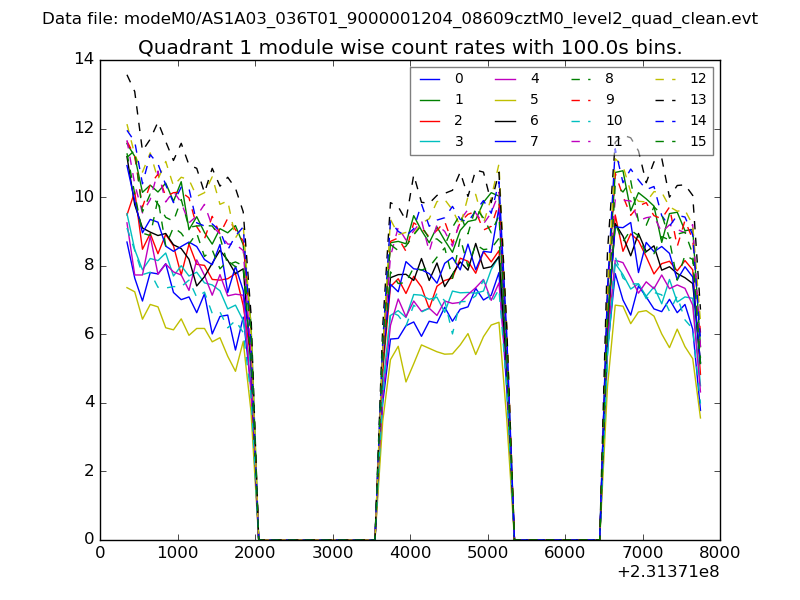
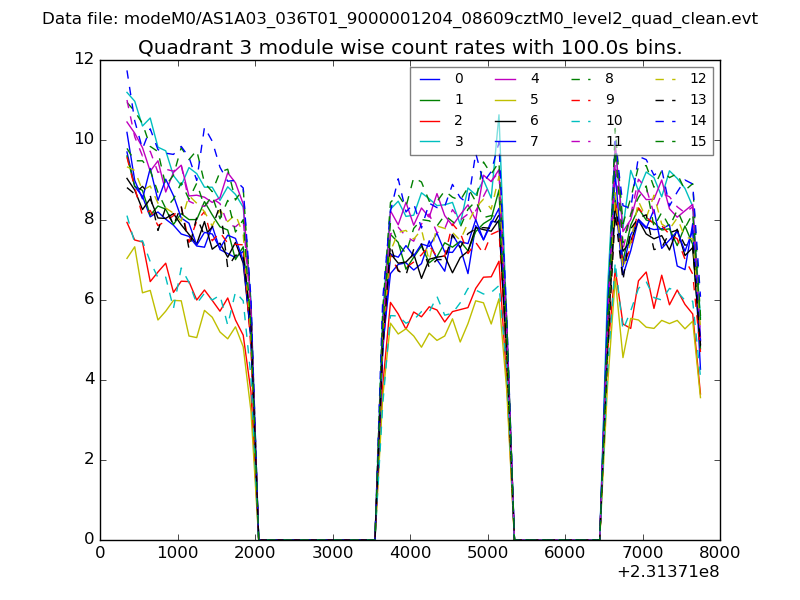
| Module-wise count rates for Quadrant A Data is divided into 100 sec bins |
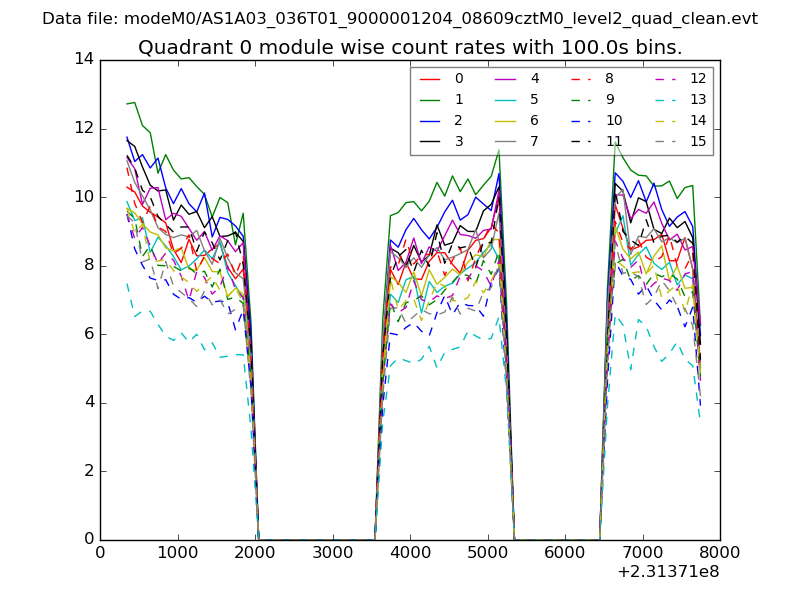 |
 |
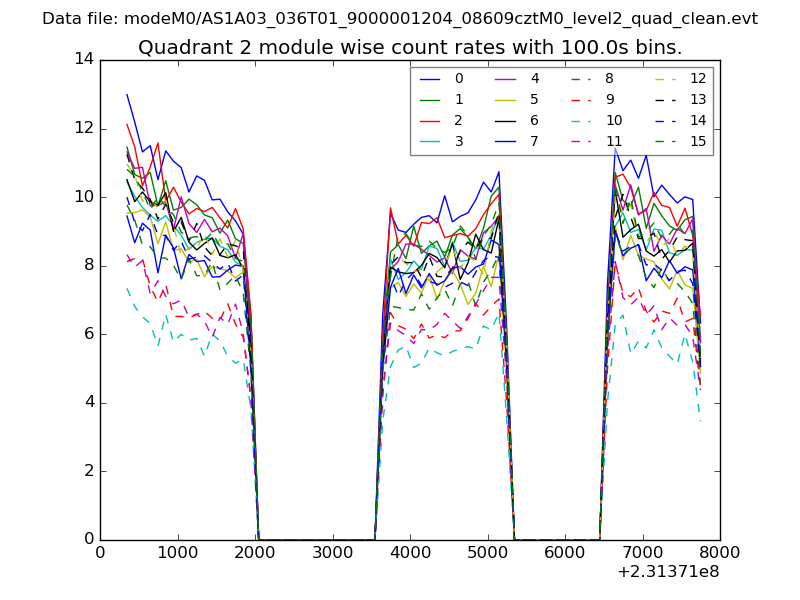
| Module-wise count rates for Quadrant B Data is divided into 100 sec bins |
 |
 |
| Module-wise count rates for Quadrant C Data is divided into 100 sec bins |
 |
 |
| Module-wise count rates for Quadrant D Data is divided into 100 sec bins |
 |
 |
| Parameter | Plot |
|---|---|
| CZT HV Monitor | 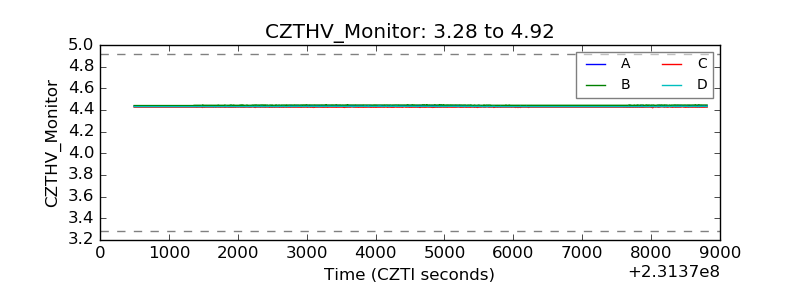 |
| D_VDD | 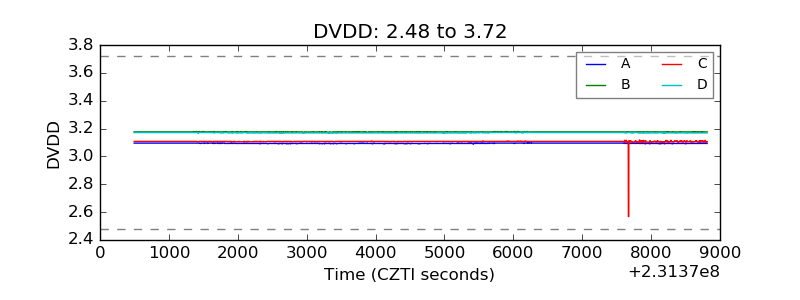 |
| Temperature 1 | 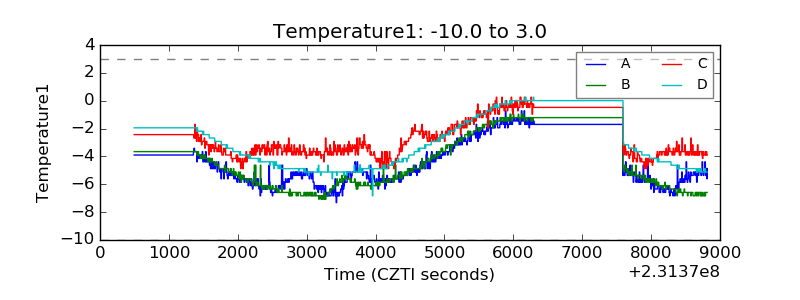 |
| Veto HV Monitor | 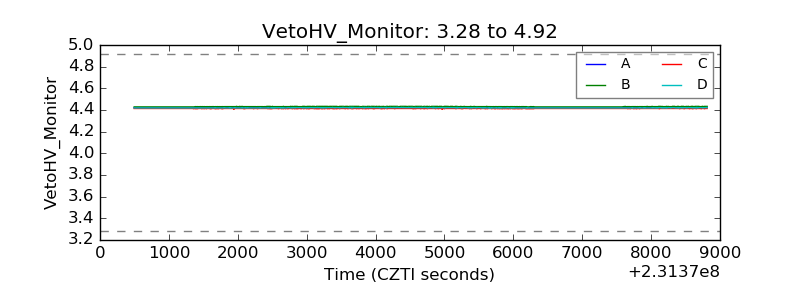 |
| Veto LLD | 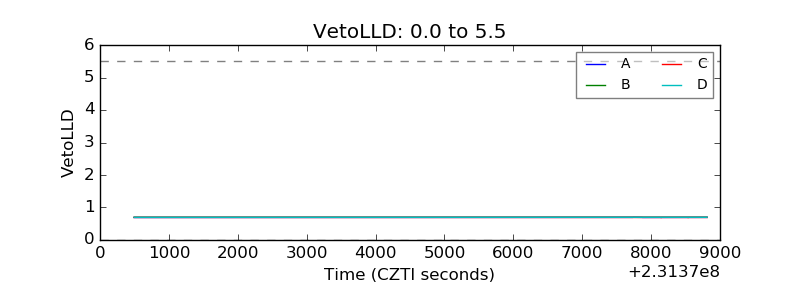 |
| Alpha Counter |  |
| _CPM_Rate |  |
| CZT Counter |  |
| +2.5 Volts monitor | 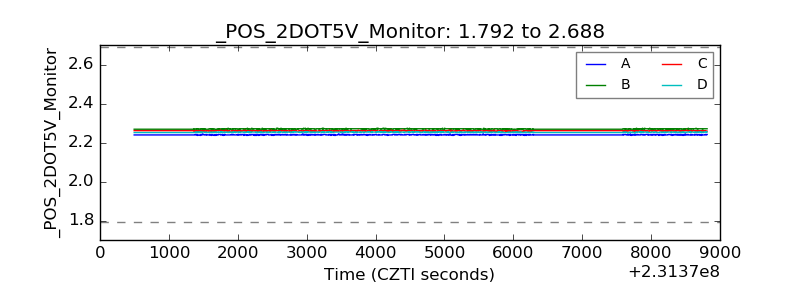 |
| +5 Volts monitor |  |
| _ROLL_ROT | 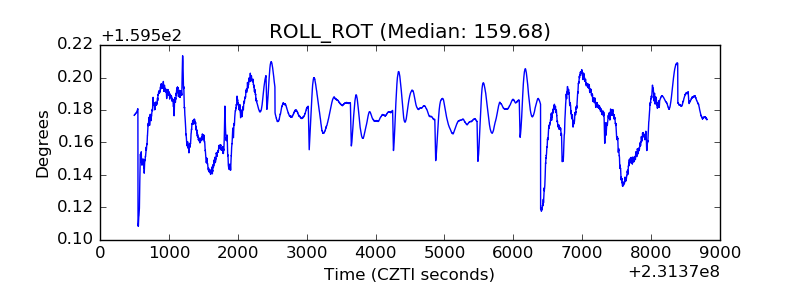 |
| _Roll_DEC | 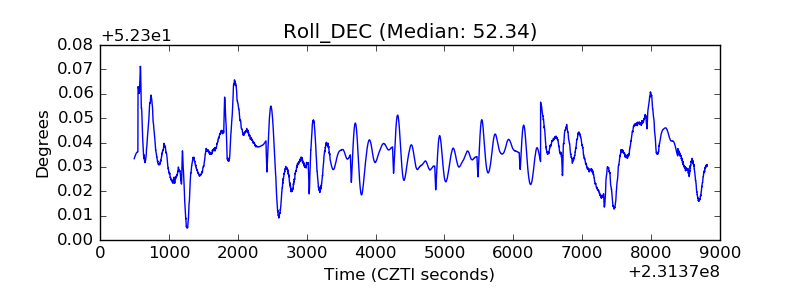 |
| _Roll_RA | 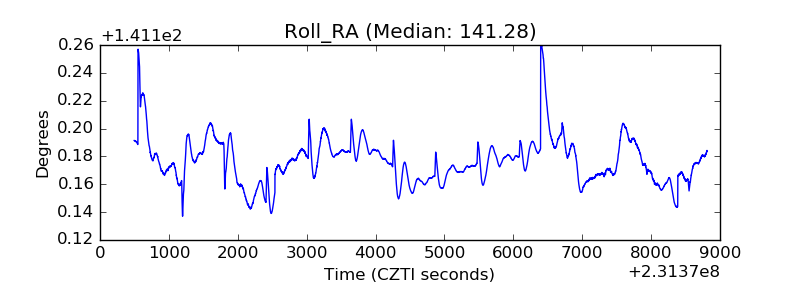 |
| Veto Counter | 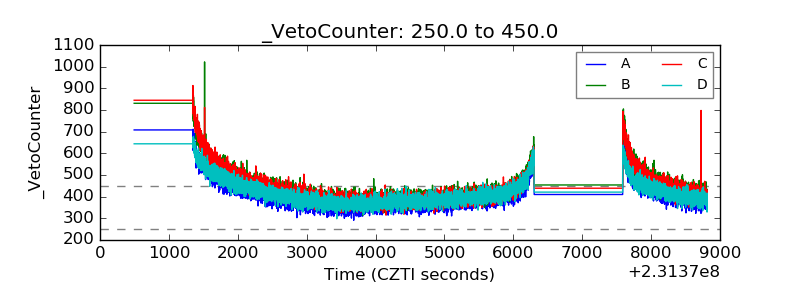 |