| Param | Original file | Final file |
|---|---|---|
| Filename | modeM0/AS1A03_036T01_9000001204_08610cztM0_level2.evt | modeM0/AS1A03_036T01_9000001204_08610cztM0_level2_quad_clean.evt |
| Size (bytes) | 451,768,320 | 95,097,600 |
| Size | 430.8 MB | 90.7 MB |
| Events in quadrant A | 2,915,786 | 613,089 |
| Events in quadrant B | 4,107,234 | 624,995 |
| Events in quadrant C | 2,869,088 | 622,002 |
| Events in quadrant D | 3,361,961 | 580,777 |
| Mode M0 | |||
|---|---|---|---|
| Quadrant | BADHDUFLAG | Total packets | Discarded packets |
| A | 0 | 13050 | 3 |
| B | 0 | 16462 | 2 |
| C | 0 | 12880 | 2 |
| D | 0 | 14274 | 2 |
| Mode M9 | |||
|---|---|---|---|
| Quadrant | BADHDUFLAG | Total packets | Discarded packets |
| A | 0 | 13 | 0 |
| B | 0 | 13 | 0 |
| C | 0 | 13 | 0 |
| D | 0 | 14 | 0 |
| Mode SS | |||
|---|---|---|---|
| Quadrant | BADHDUFLAG | Total packets | Discarded packets |
| A | 0 | 128 | 0 |
| B | 0 | 128 | 0 |
| C | 0 | 128 | 0 |
| D | 0 | 128 | 0 |
| Quadrant | Total seconds | Saturated seconds | Saturation percentage |
|---|---|---|---|
| A | 6292 | 14 | 0.222505% |
| B | 6292 | 354 | 5.626192% |
| C | 6292 | 6 | 0.095359% |
| D | 6292 | 109 | 1.732359% |
Noise dominated data is calculated using 1-second bins in cleaned event files. If a bin has >2000 counts, and if more than 50% of those come from <1% of pixels, then it is considered to be noise-dominated and hence unusable.
| Quadrant | # 1 sec bins | Bins with >0 counts | Bins with >2000 counts | High rate bins dominated by noise | Noise dominated (total time) | Noise dominated (detector-on time) | Marked lightcurve |
|---|---|---|---|---|---|---|---|
| A | 7552 | 6293 | 5 | 5 | 0.07% | 0.08% |  |
| B | 7552 | 6293 | 297 | 297 | 3.93% | 4.72% |  |
| C | 7552 | 6293 | 0 | 0 | 0.00% | 0.00% |  |
| D | 7552 | 6293 | 90 | 90 | 1.19% | 1.43% |  |
Top three noisy pixels from each quadrant. If the there are fewer than three noisy pixels in the level2.evt file, extra rows are filled as -1
| Pixel properties | Quadrant properties | ||||||
|---|---|---|---|---|---|---|---|
| Quadrant | DetID | PixID | Counts | Sigma | Mean | Median | Sigma |
| A | 15 | 63 | 34020 | 225.04 | 735 | 720 | 148.0 |
| A | 5 | 16 | 21876 | 142.97 | 735 | 720 | 148.0 |
| A | 15 | 174 | 19132 | 124.42 | 735 | 720 | 148.0 |
| B | 10 | 16 | 992820 | 7254.94 | 730 | 714 | 136.7 |
| B | 0 | 214 | 105353 | 765.19 | 730 | 714 | 136.7 |
| B | 10 | 246 | 50987 | 367.63 | 730 | 714 | 136.7 |
| C | 8 | 128 | 6250 | 32.87 | 730 | 734 | 167.8 |
| C | 14 | 67 | 5580 | 28.88 | 730 | 734 | 167.8 |
| C | 13 | 61 | 5559 | 28.75 | 730 | 734 | 167.8 |
| D | 12 | 233 | 187224 | 1079.58 | 715 | 696 | 172.8 |
| D | 2 | 136 | 104803 | 602.55 | 715 | 696 | 172.8 |
| D | 7 | 71 | 74710 | 428.37 | 715 | 696 | 172.8 |
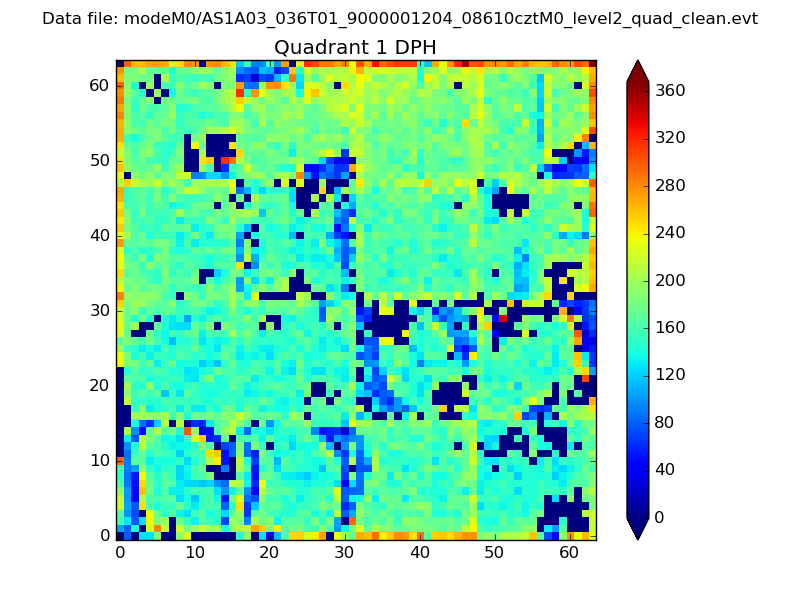
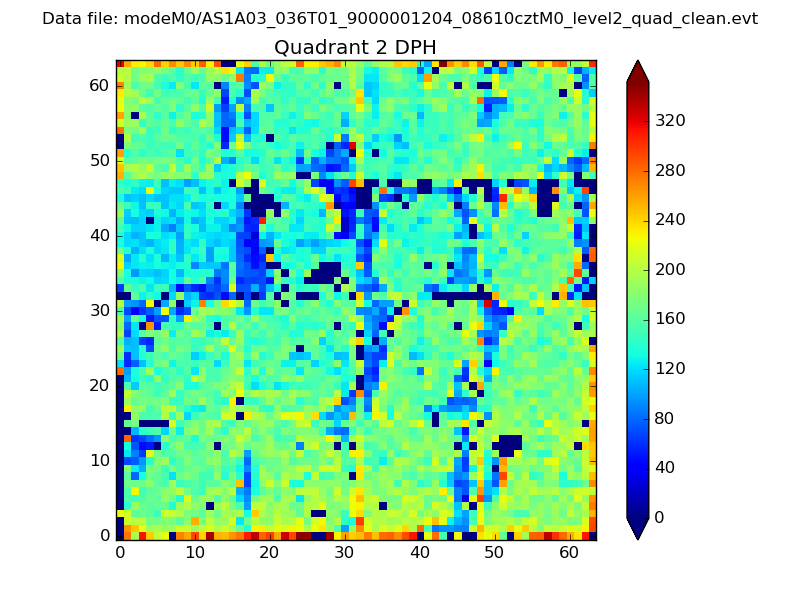
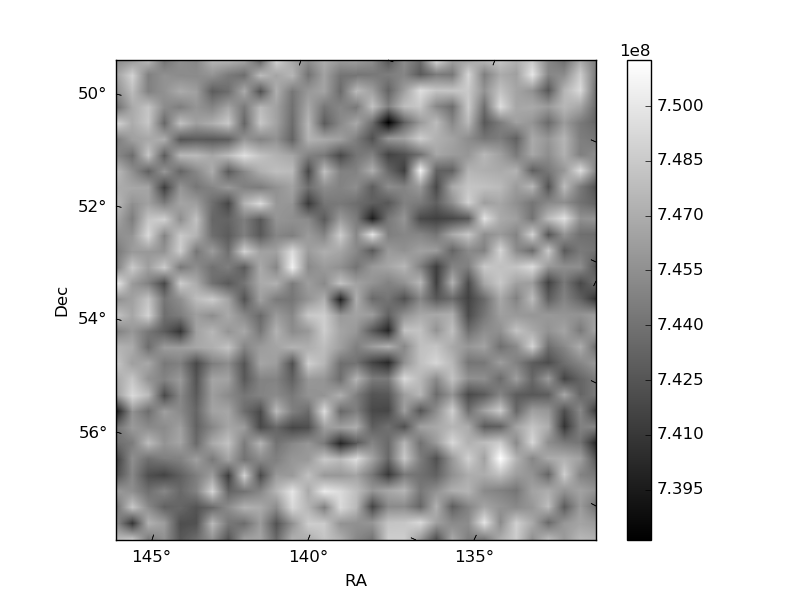
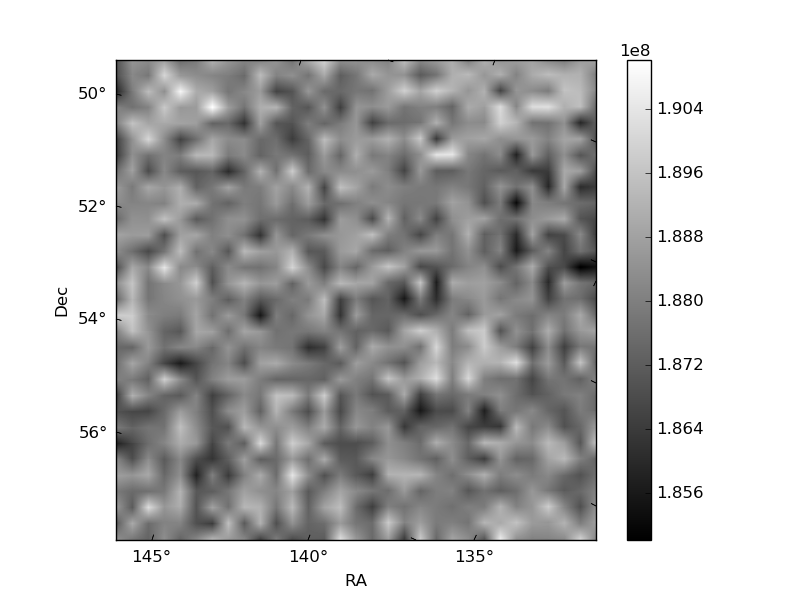
Histogram calculated using DETX and DETY for each event in the final _common_clean file
| Quadrant A |  |
 |
Quadrant B |
|---|---|---|---|
| Quadrant D | 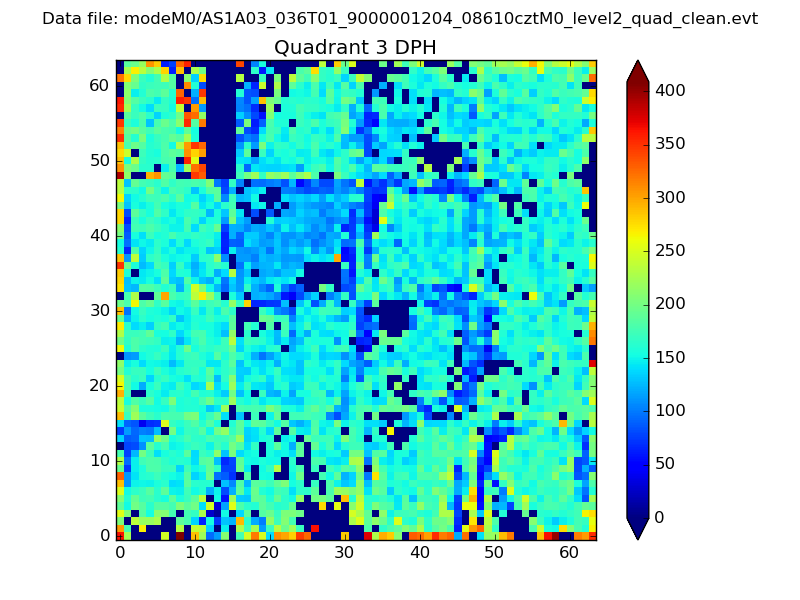 |
 |
Quadrant C |
| Plot type | Count rate plots | Images |
|---|---|---|
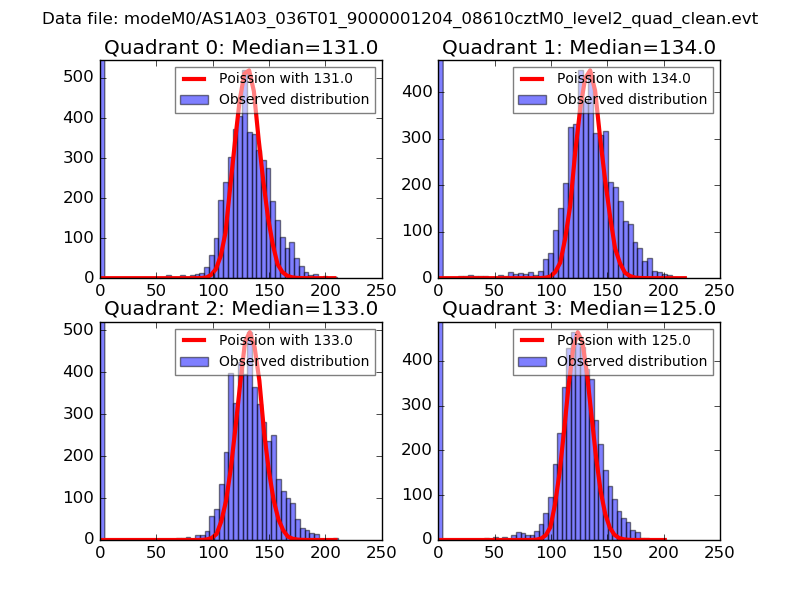
| Comparison with Poisson distribution Blue bars denote a histogram of data divided into 1 sec bins. Red curve is a Poisson curve with rate = median count rate of data. |
 |
 |
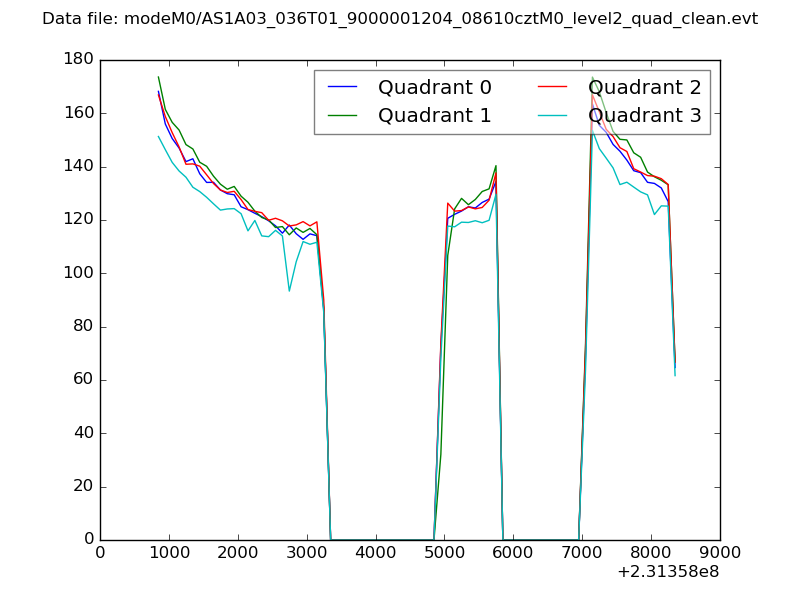
| Quadrant-wise count rates Data is divided into 100 sec bins |
 |
|
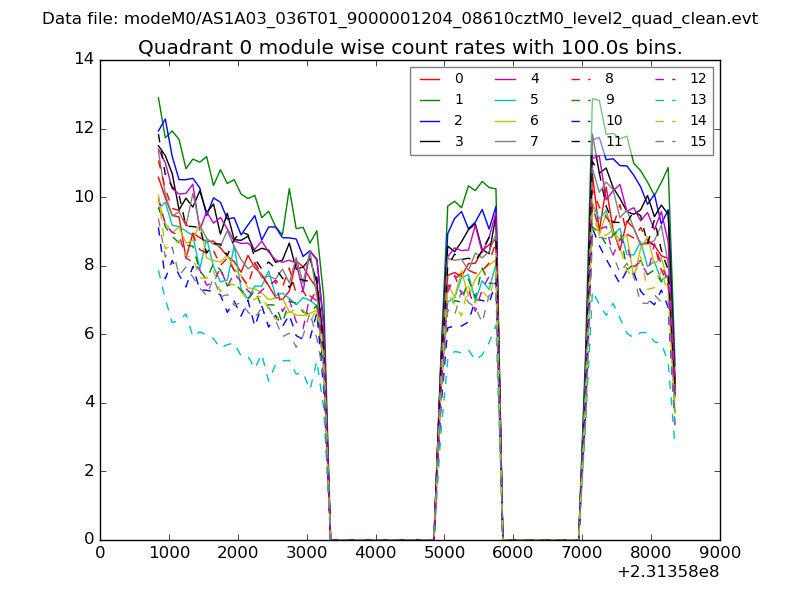
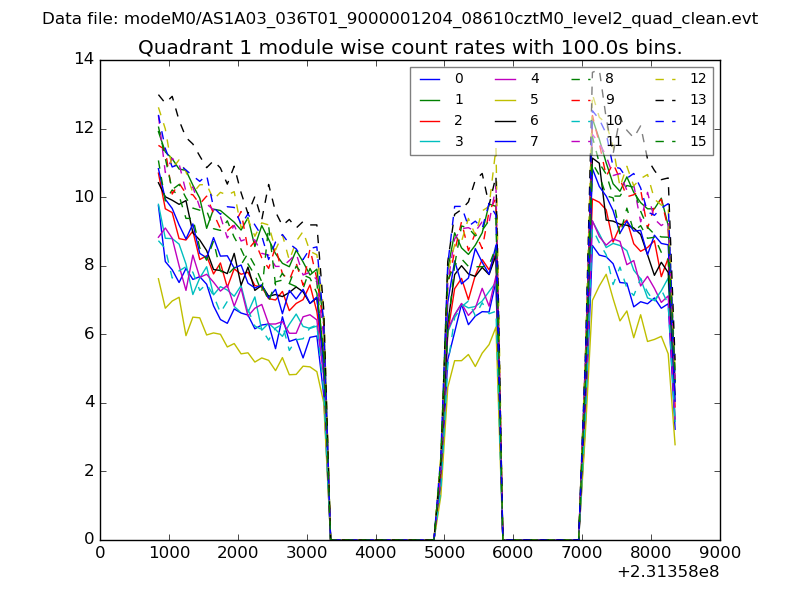
| Module-wise count rates for Quadrant A Data is divided into 100 sec bins |
 |
 |
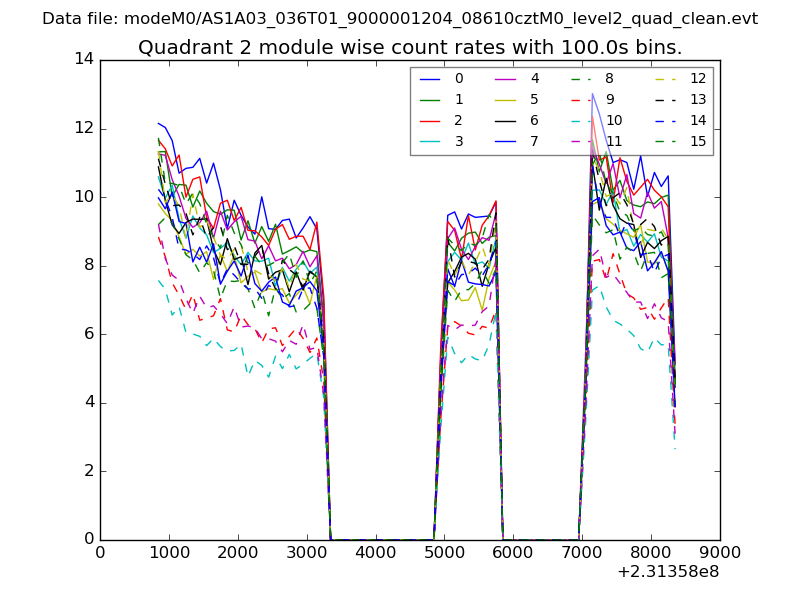
| Module-wise count rates for Quadrant B Data is divided into 100 sec bins |
 |
 |
| Module-wise count rates for Quadrant C Data is divided into 100 sec bins |
 |
 |
| Module-wise count rates for Quadrant D Data is divided into 100 sec bins |
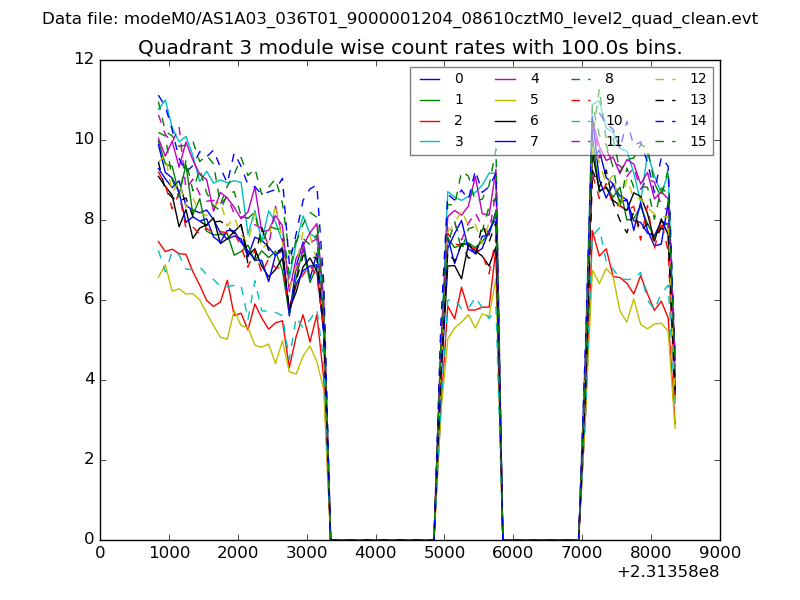 |
 |
| Parameter | Plot |
|---|---|
| CZT HV Monitor | 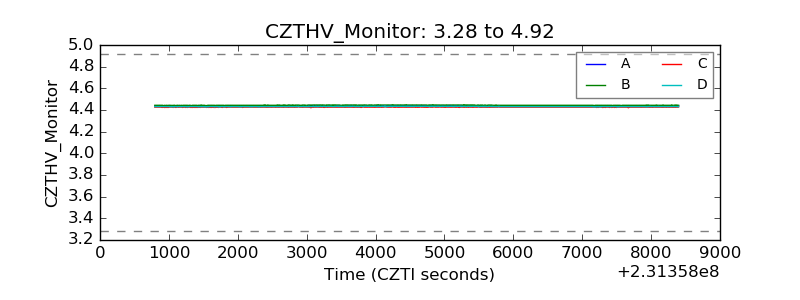 |
| D_VDD | 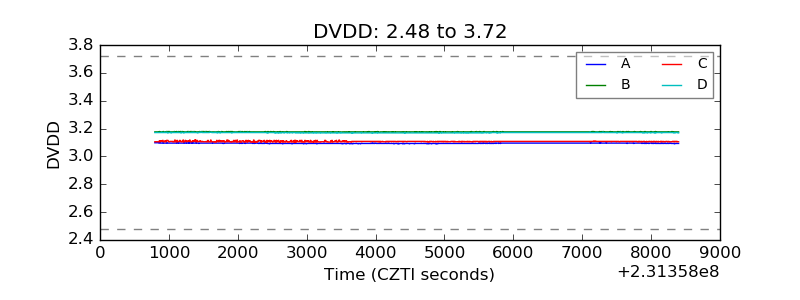 |
| Temperature 1 | 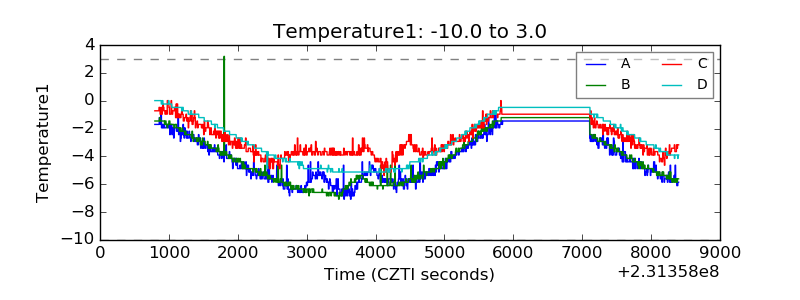 |
| Veto HV Monitor | 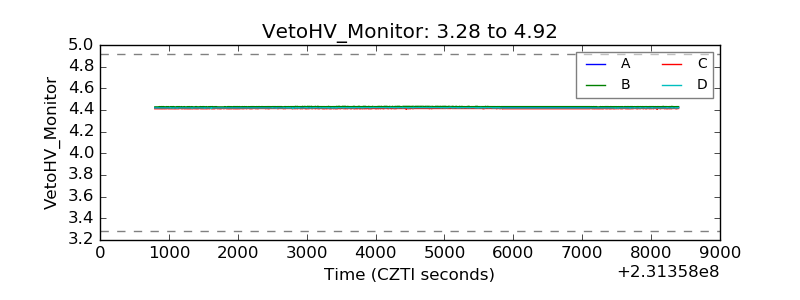 |
| Veto LLD |  |
| Alpha Counter | 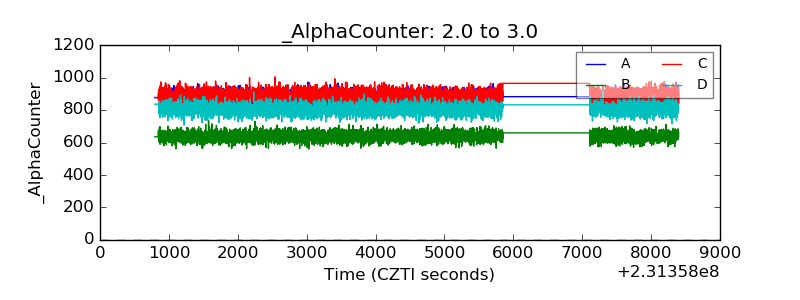 |
| _CPM_Rate | 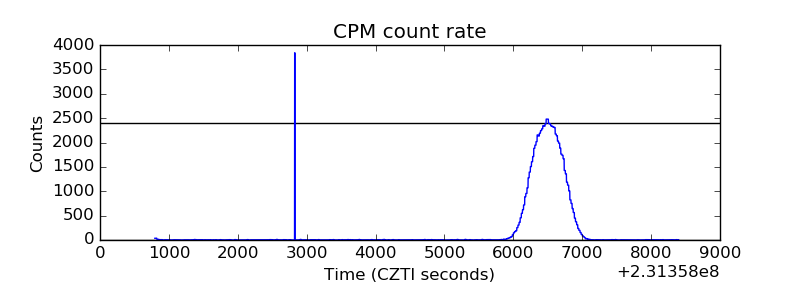 |
| CZT Counter | 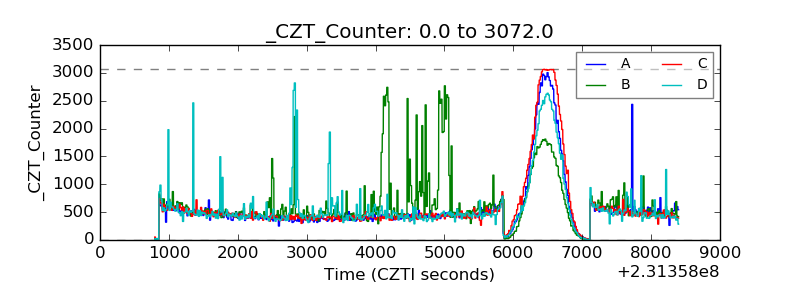 |
| +2.5 Volts monitor |  |
| +5 Volts monitor |  |
| _ROLL_ROT | 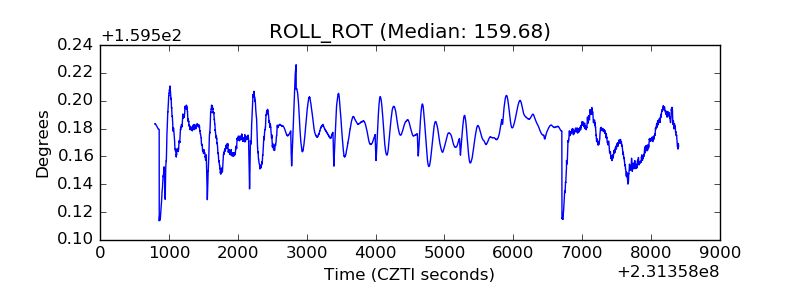 |
| _Roll_DEC | 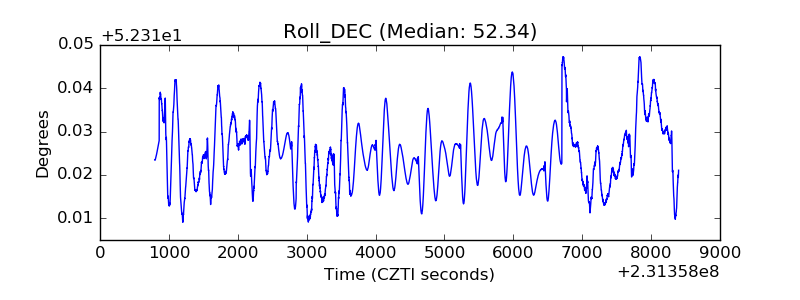 |
| _Roll_RA | 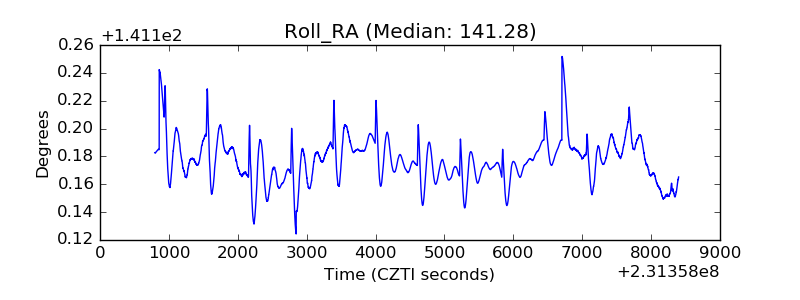 |
| Veto Counter | 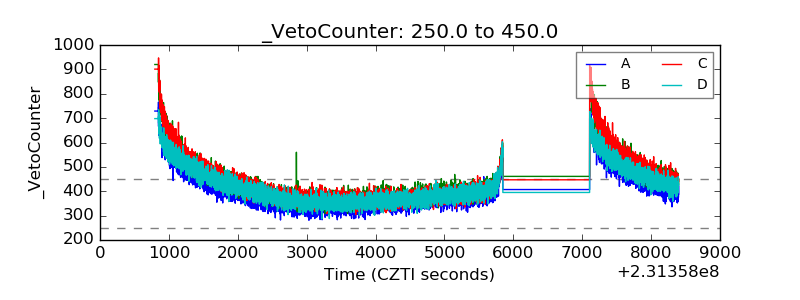 |