| Param | Original file | Final file |
|---|---|---|
| Filename | modeM0/AS1A03_036T01_9000001204_08613cztM0_level2.evt | modeM0/AS1A03_036T01_9000001204_08613cztM0_level2_quad_clean.evt |
| Size (bytes) | 433,584,000 | 87,730,560 |
| Size | 413.5 MB | 83.7 MB |
| Events in quadrant A | 3,041,111 | 554,100 |
| Events in quadrant B | 3,422,628 | 568,392 |
| Events in quadrant C | 2,932,020 | 555,331 |
| Events in quadrant D | 3,288,867 | 521,040 |
| Mode M0 | |||
|---|---|---|---|
| Quadrant | BADHDUFLAG | Total packets | Discarded packets |
| A | 0 | 13664 | 3 |
| B | 0 | 14503 | 2 |
| C | 0 | 13417 | 2 |
| D | 0 | 14515 | 2 |
| Mode M9 | |||
|---|---|---|---|
| Quadrant | BADHDUFLAG | Total packets | Discarded packets |
| A | 0 | 24 | 0 |
| B | 0 | 24 | 0 |
| C | 0 | 24 | 0 |
| D | 0 | 24 | 0 |
| Mode SS | |||
|---|---|---|---|
| Quadrant | BADHDUFLAG | Total packets | Discarded packets |
| A | 0 | 138 | 0 |
| B | 0 | 138 | 0 |
| C | 0 | 138 | 0 |
| D | 0 | 138 | 0 |
| Quadrant | Total seconds | Saturated seconds | Saturation percentage |
|---|---|---|---|
| A | 6555 | 47 | 0.717010% |
| B | 6555 | 89 | 1.357742% |
| C | 6555 | 18 | 0.274600% |
| D | 6555 | 86 | 1.311976% |
Noise dominated data is calculated using 1-second bins in cleaned event files. If a bin has >2000 counts, and if more than 50% of those come from <1% of pixels, then it is considered to be noise-dominated and hence unusable.
| Quadrant | # 1 sec bins | Bins with >0 counts | Bins with >2000 counts | High rate bins dominated by noise | Noise dominated (total time) | Noise dominated (detector-on time) | Marked lightcurve |
|---|---|---|---|---|---|---|---|
| A | 9075 | 6557 | 13 | 13 | 0.14% | 0.20% | 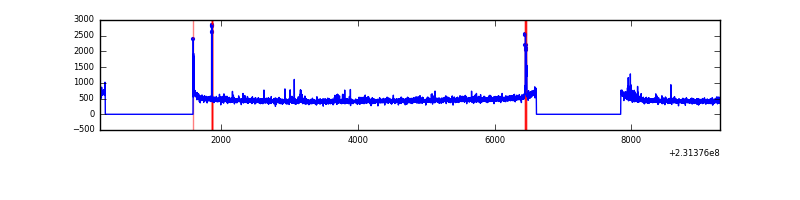 |
| B | 9075 | 6557 | 24 | 24 | 0.26% | 0.37% | 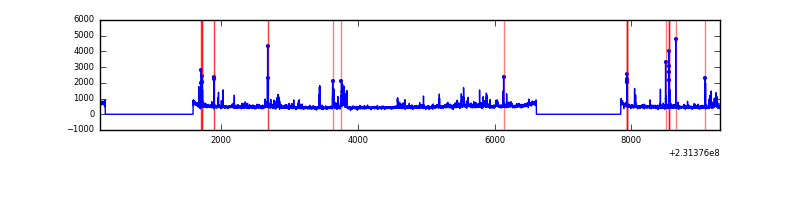 |
| C | 9075 | 6557 | 0 | 0 | 0.00% | 0.00% | 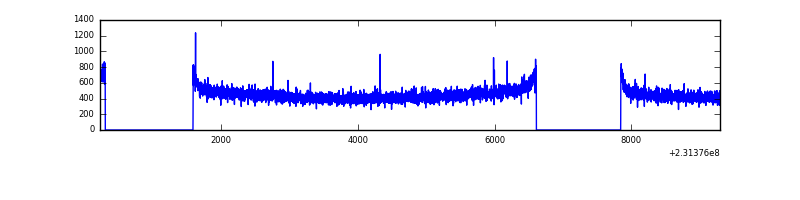 |
| D | 9075 | 6557 | 64 | 64 | 0.71% | 0.98% | 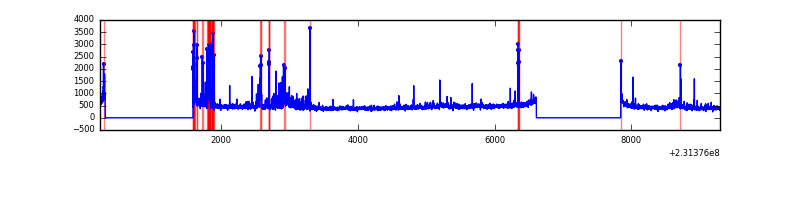 |
Top three noisy pixels from each quadrant. If the there are fewer than three noisy pixels in the level2.evt file, extra rows are filled as -1
| Pixel properties | Quadrant properties | ||||||
|---|---|---|---|---|---|---|---|
| Quadrant | DetID | PixID | Counts | Sigma | Mean | Median | Sigma |
| A | 13 | 248 | 42243 | 271.07 | 756 | 741 | 153.1 |
| A | 13 | 14 | 31740 | 202.47 | 756 | 741 | 153.1 |
| A | 15 | 174 | 27857 | 177.11 | 756 | 741 | 153.1 |
| B | 10 | 16 | 207811 | 1428.87 | 771 | 753 | 144.9 |
| B | 0 | 214 | 111062 | 761.22 | 771 | 753 | 144.9 |
| B | 4 | 80 | 50349 | 342.25 | 771 | 753 | 144.9 |
| C | 8 | 128 | 12457 | 68.08 | 746 | 748 | 172.0 |
| C | 8 | 112 | 6038 | 30.76 | 746 | 748 | 172.0 |
| C | 13 | 61 | 5645 | 28.47 | 746 | 748 | 172.0 |
| D | 2 | 136 | 144036 | 802.24 | 731 | 709 | 178.7 |
| D | 1 | 52 | 128109 | 713.09 | 731 | 709 | 178.7 |
| D | 7 | 71 | 99878 | 555.07 | 731 | 709 | 178.7 |
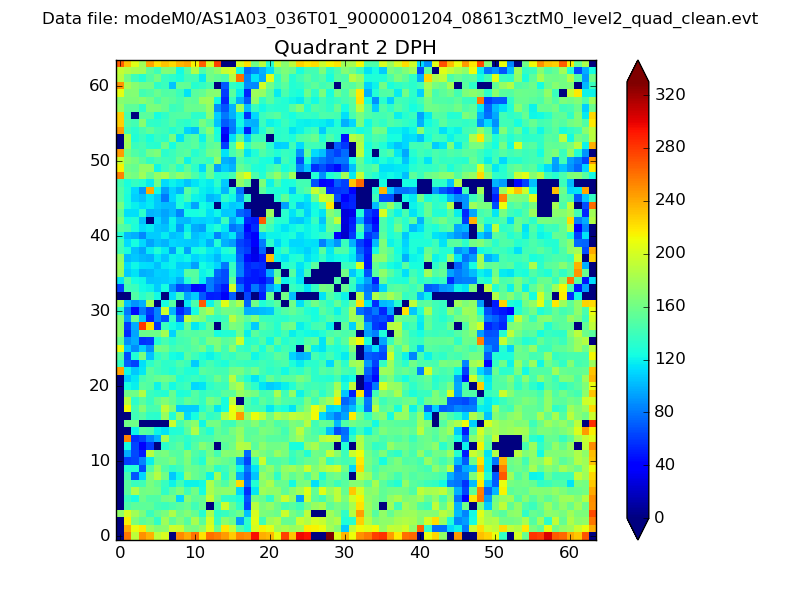
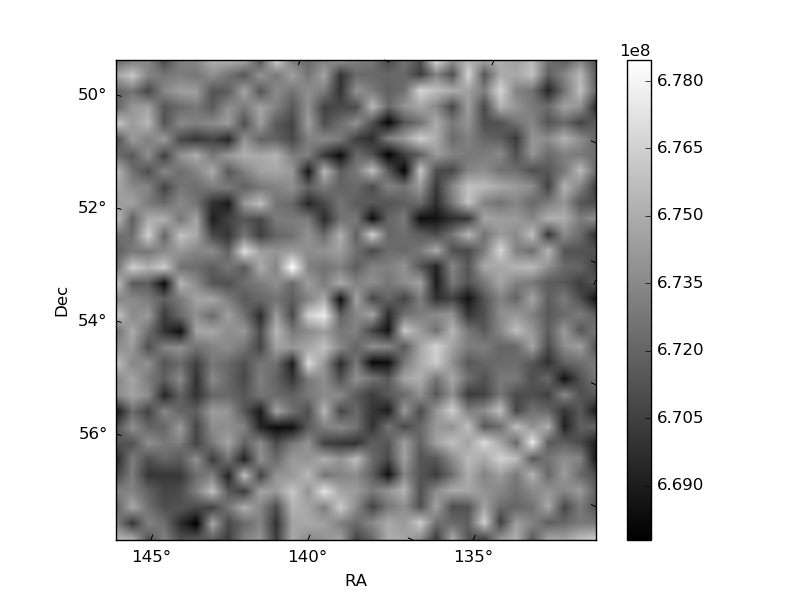
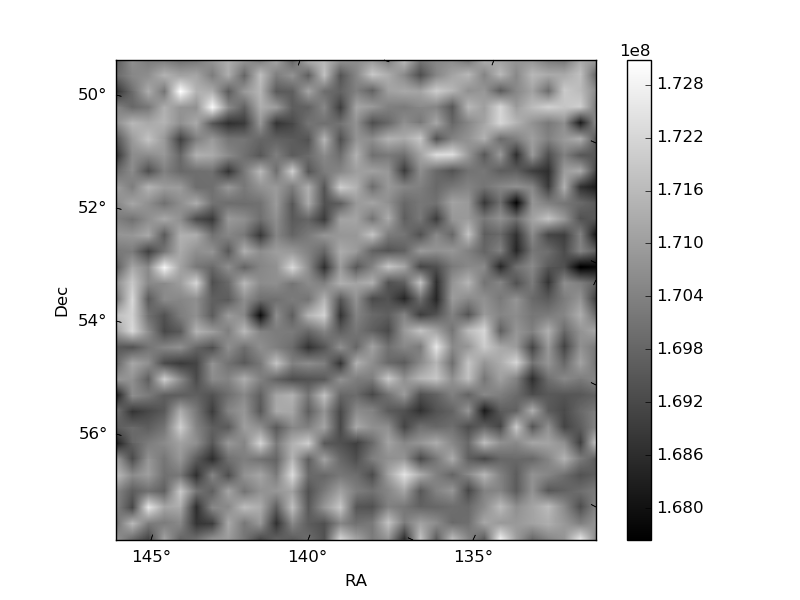
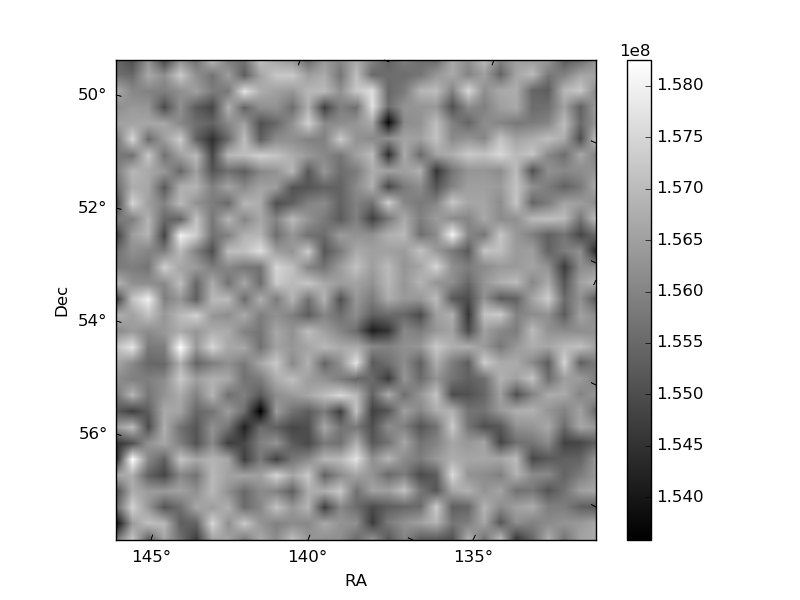
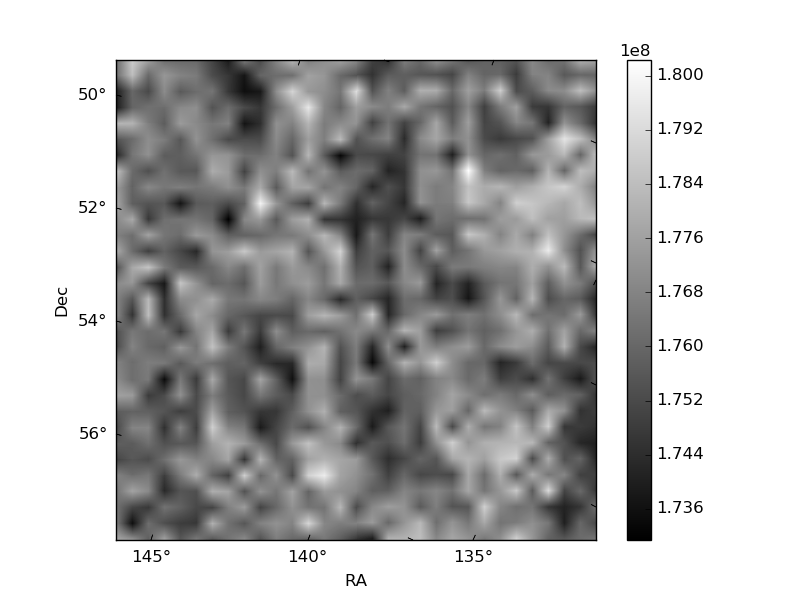
Histogram calculated using DETX and DETY for each event in the final _common_clean file
| Quadrant A | 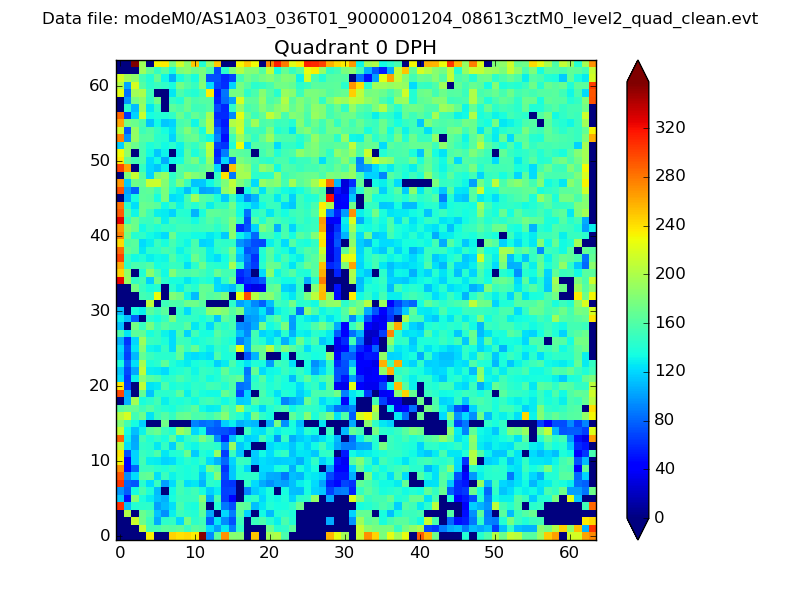 |
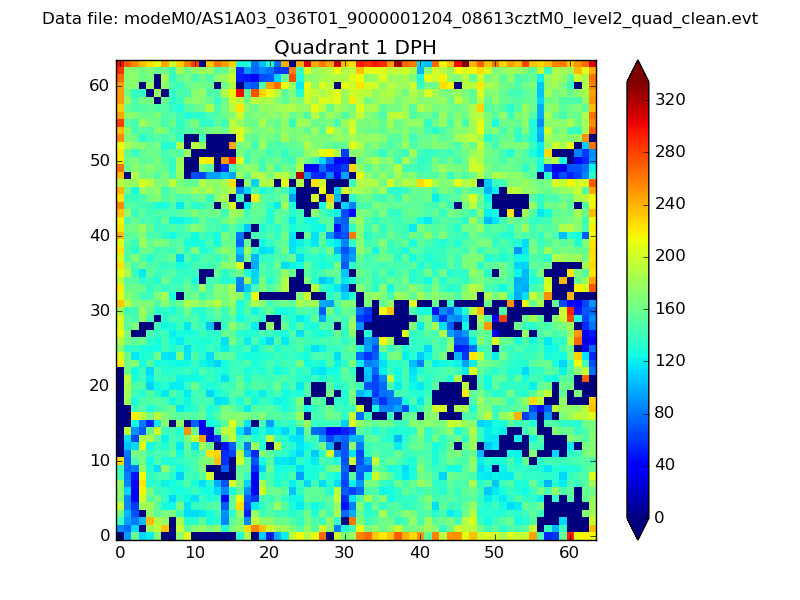 |
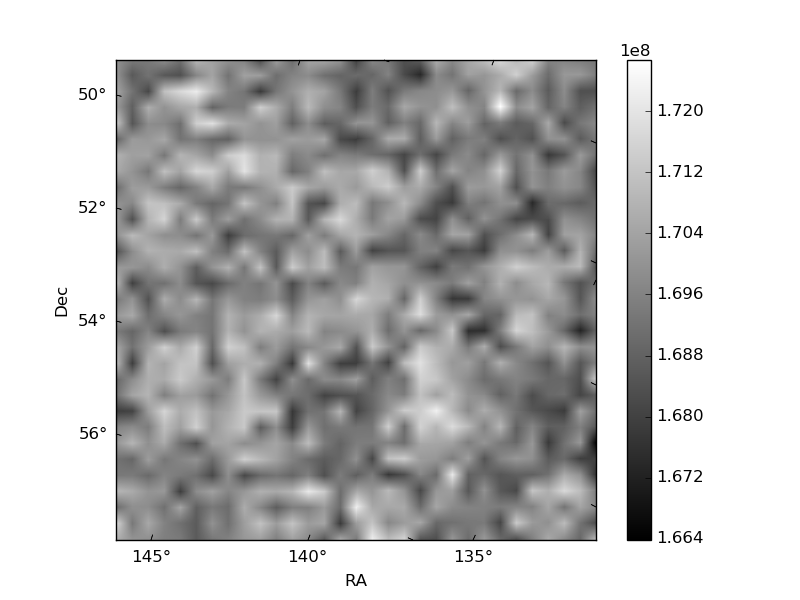
Quadrant B |
|---|---|---|---|
| Quadrant D | 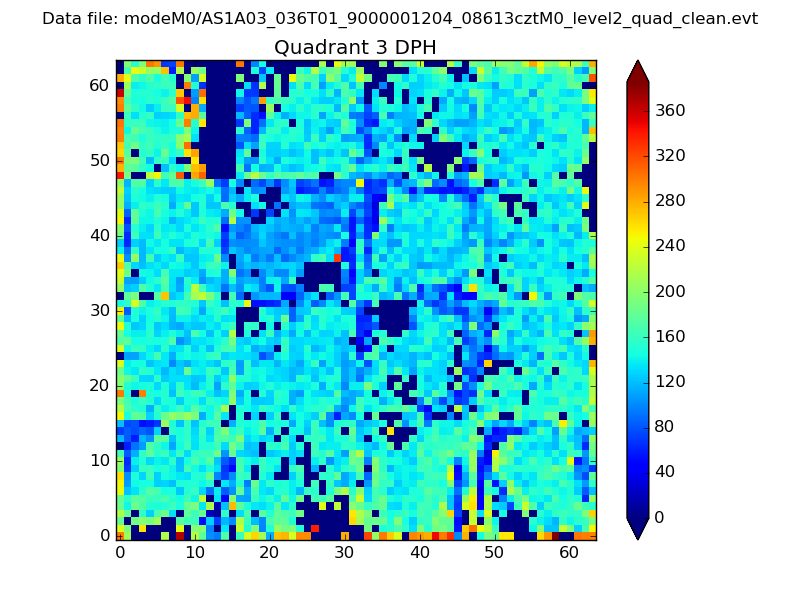 |
 |
Quadrant C |
| Plot type | Count rate plots | Images |
|---|---|---|
| Comparison with Poisson distribution Blue bars denote a histogram of data divided into 1 sec bins. Red curve is a Poisson curve with rate = median count rate of data. |
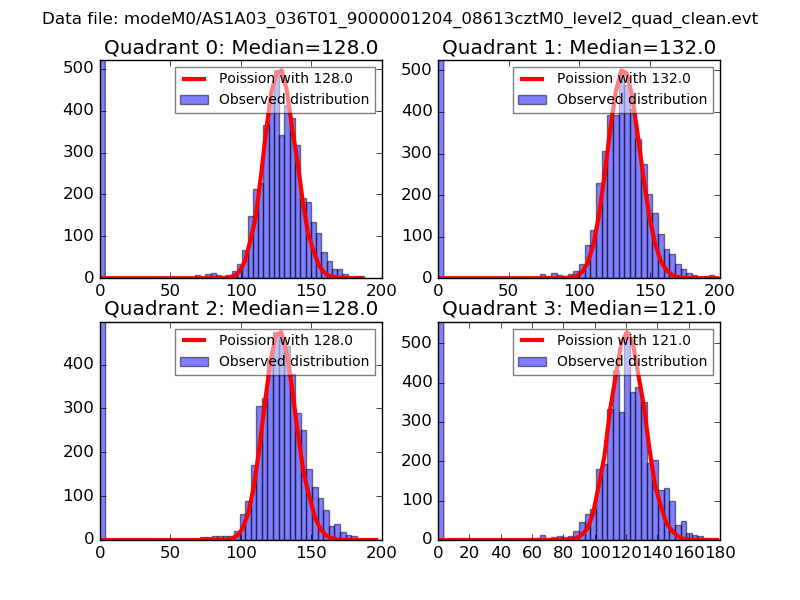 |
 |
| Quadrant-wise count rates Data is divided into 100 sec bins |
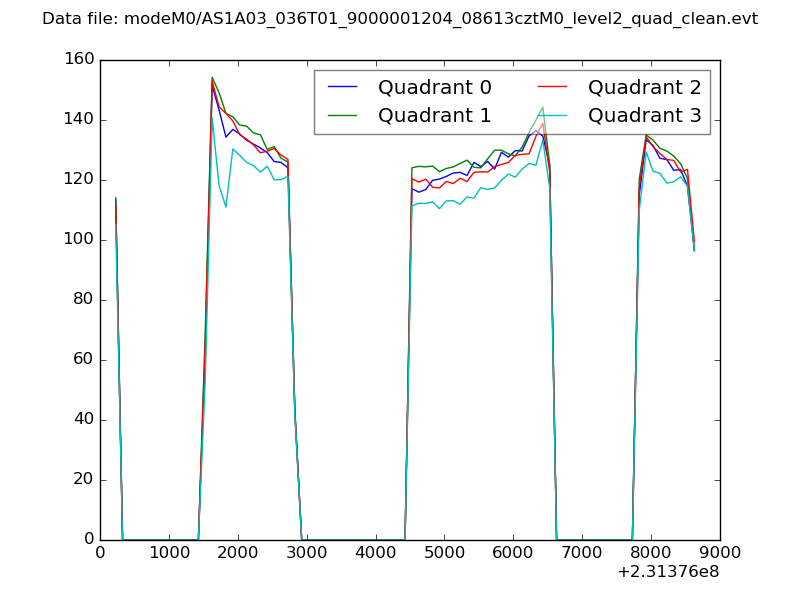 |
|
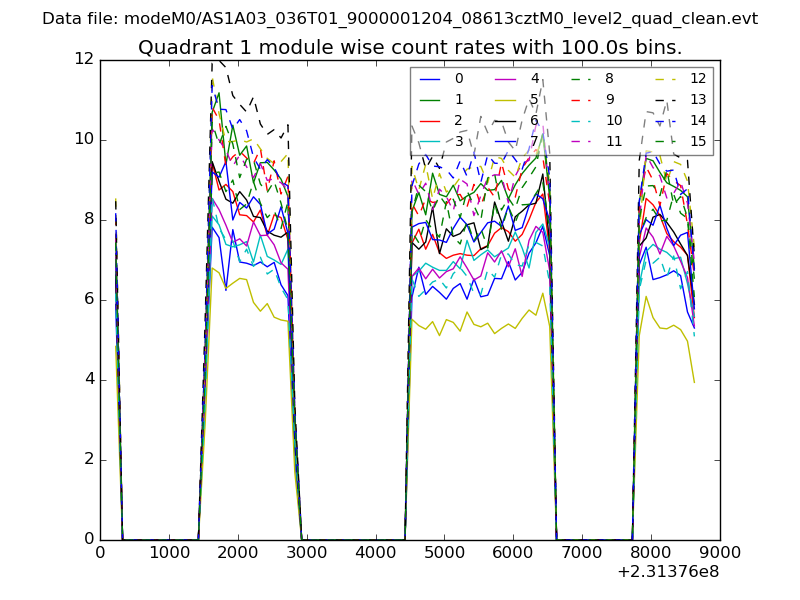
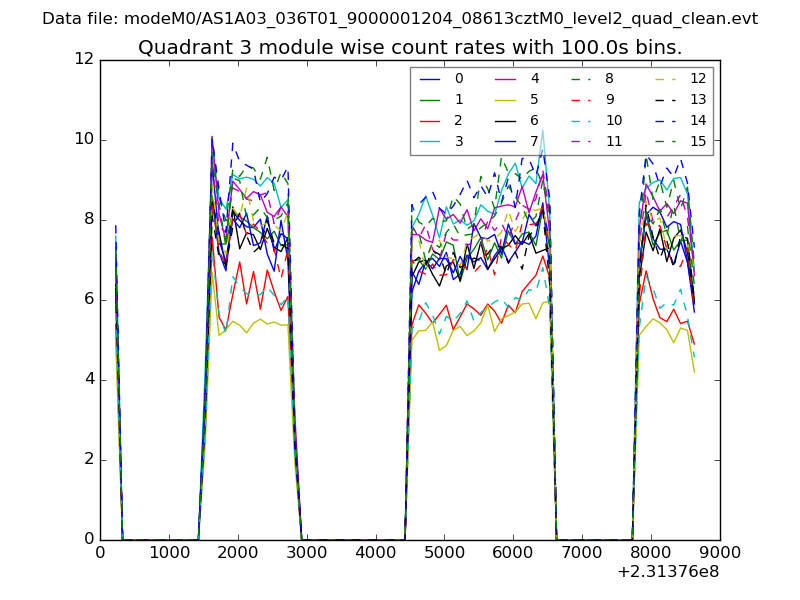
| Module-wise count rates for Quadrant A Data is divided into 100 sec bins |
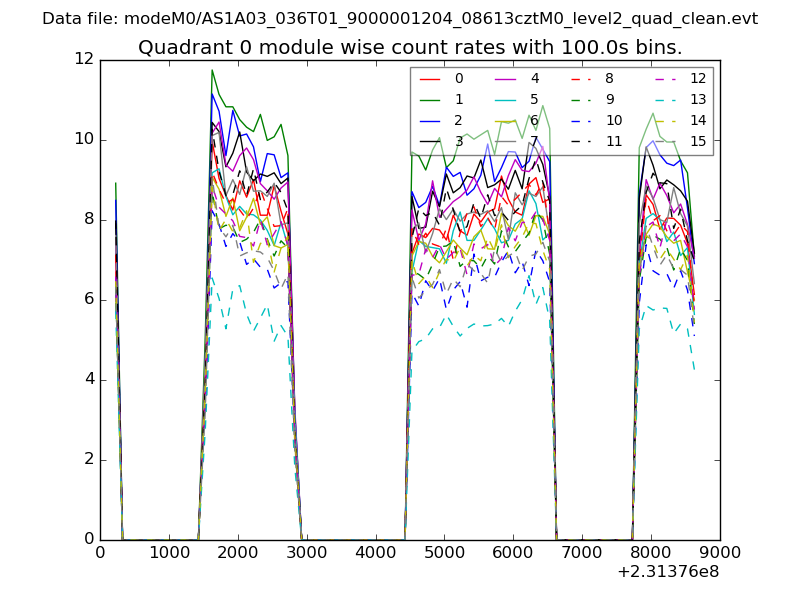 |
 |
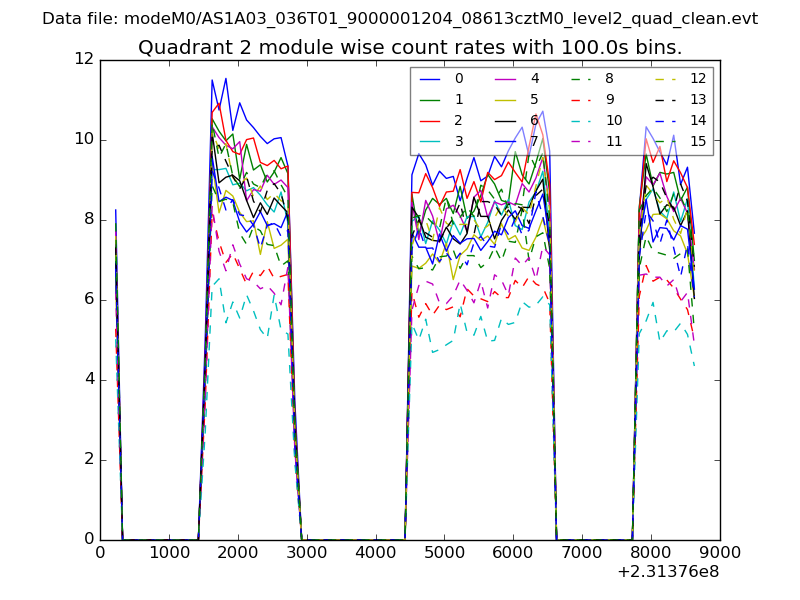
| Module-wise count rates for Quadrant B Data is divided into 100 sec bins |
 |
 |
| Module-wise count rates for Quadrant C Data is divided into 100 sec bins |
 |
 |
| Module-wise count rates for Quadrant D Data is divided into 100 sec bins |
 |
 |
| Parameter | Plot |
|---|---|
| CZT HV Monitor | 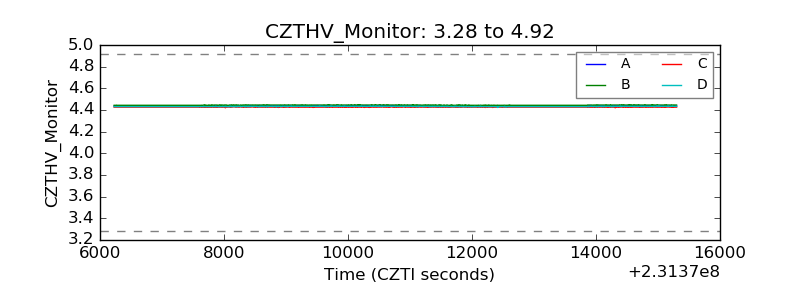 |
| D_VDD | 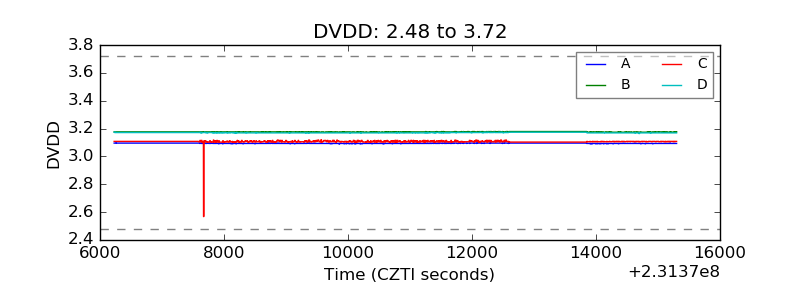 |
| Temperature 1 | 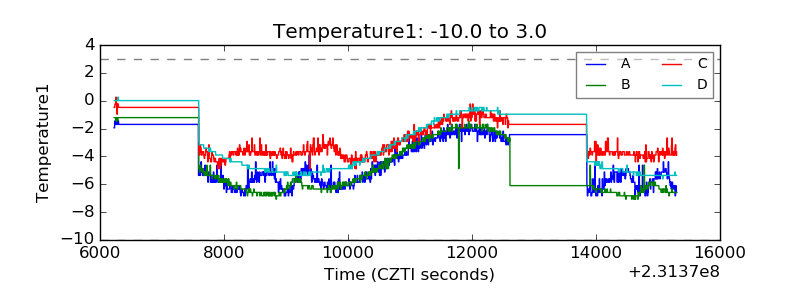 |
| Veto HV Monitor | 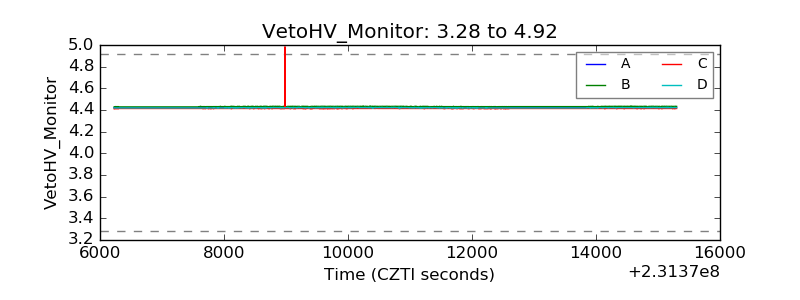 |
| Veto LLD | 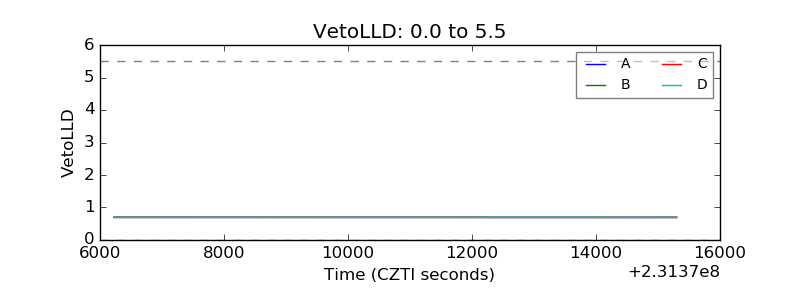 |
| Alpha Counter | 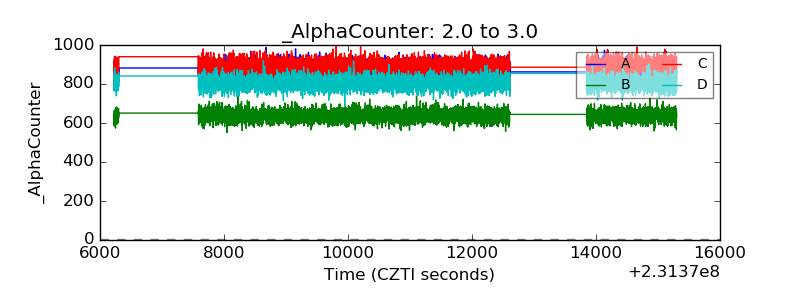 |
| _CPM_Rate | 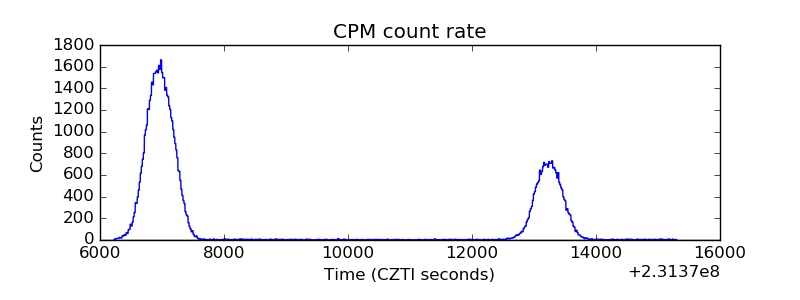 |
| CZT Counter | 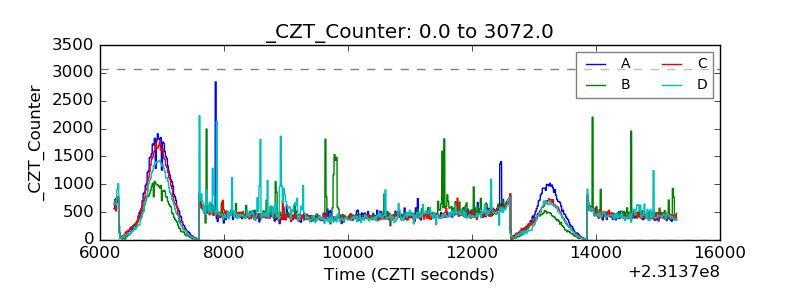 |
| +2.5 Volts monitor |  |
| +5 Volts monitor |  |
| _ROLL_ROT | 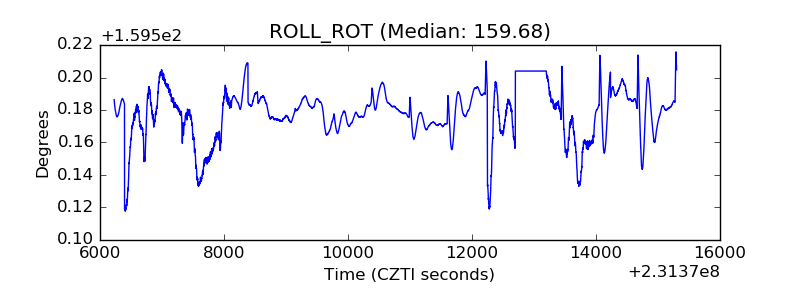 |
| _Roll_DEC | 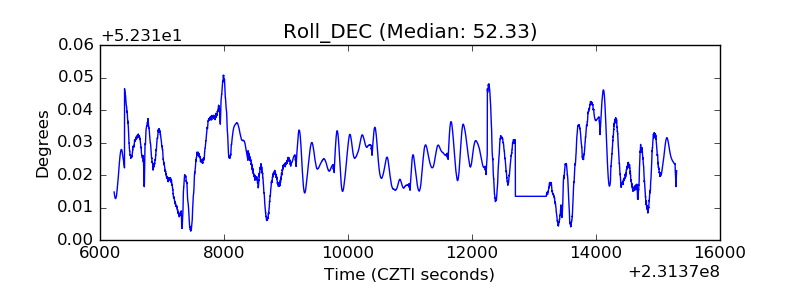 |
| _Roll_RA | 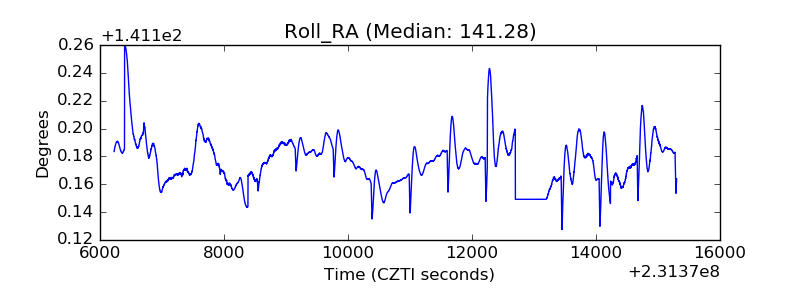 |
| Veto Counter | 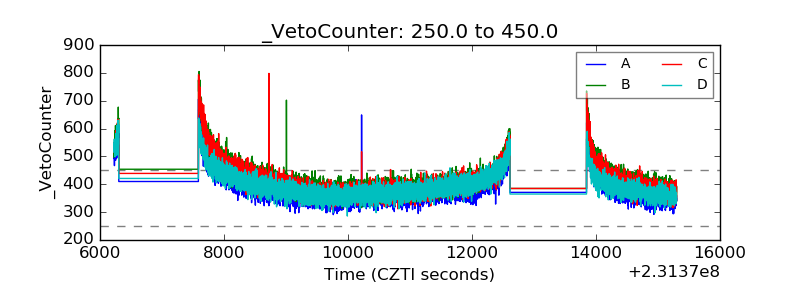 |