| Param | Original file | Final file |
|---|---|---|
| Filename | modeM0/AS1A03_036T01_9000001204_08614cztM0_level2.evt | modeM0/AS1A03_036T01_9000001204_08614cztM0_level2_quad_clean.evt |
| Size (bytes) | 436,224,960 | 81,342,720 |
| Size | 416.0 MB | 77.6 MB |
| Events in quadrant A | 3,173,893 | 501,164 |
| Events in quadrant B | 3,526,421 | 511,226 |
| Events in quadrant C | 2,931,721 | 499,961 |
| Events in quadrant D | 3,120,005 | 480,506 |
| Mode M0 | |||
|---|---|---|---|
| Quadrant | BADHDUFLAG | Total packets | Discarded packets |
| A | 0 | 14172 | 3 |
| B | 0 | 14952 | 2 |
| C | 0 | 13712 | 2 |
| D | 0 | 14296 | 2 |
| Mode M9 | |||
|---|---|---|---|
| Quadrant | BADHDUFLAG | Total packets | Discarded packets |
| A | 0 | 15 | 0 |
| B | 0 | 15 | 0 |
| C | 0 | 15 | 0 |
| D | 0 | 16 | 0 |
| Mode SS | |||
|---|---|---|---|
| Quadrant | BADHDUFLAG | Total packets | Discarded packets |
| A | 0 | 136 | 0 |
| B | 0 | 136 | 0 |
| C | 0 | 136 | 0 |
| D | 0 | 136 | 0 |
| Quadrant | Total seconds | Saturated seconds | Saturation percentage |
|---|---|---|---|
| A | 6751 | 28 | 0.414753% |
| B | 6751 | 118 | 1.747889% |
| C | 6751 | 13 | 0.192564% |
| D | 6751 | 42 | 0.622130% |
Noise dominated data is calculated using 1-second bins in cleaned event files. If a bin has >2000 counts, and if more than 50% of those come from <1% of pixels, then it is considered to be noise-dominated and hence unusable.
| Quadrant | # 1 sec bins | Bins with >0 counts | Bins with >2000 counts | High rate bins dominated by noise | Noise dominated (total time) | Noise dominated (detector-on time) | Marked lightcurve |
|---|---|---|---|---|---|---|---|
| A | 7736 | 6752 | 0 | 0 | 0.00% | 0.00% | 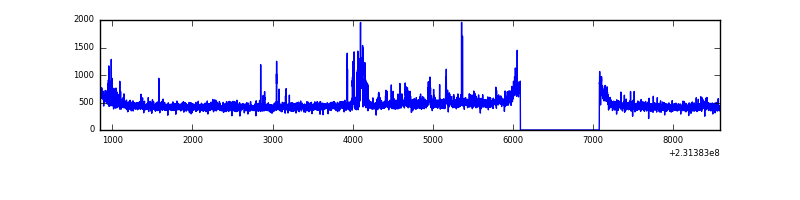 |
| B | 7736 | 6752 | 57 | 57 | 0.74% | 0.84% | 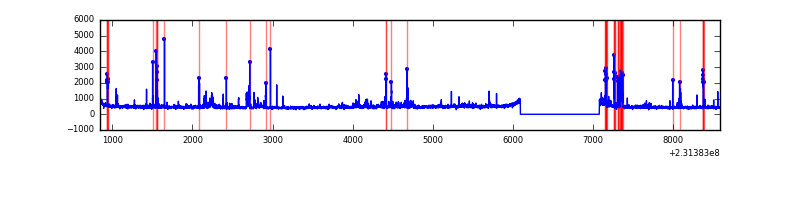 |
| C | 7736 | 6752 | 0 | 0 | 0.00% | 0.00% | 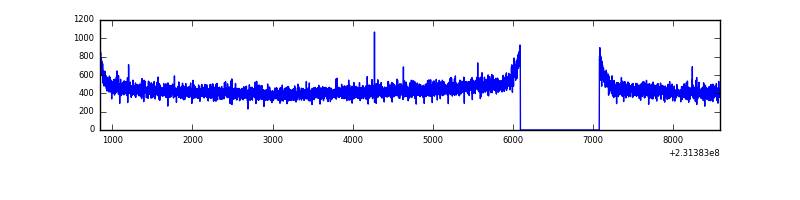 |
| D | 7736 | 6752 | 19 | 19 | 0.25% | 0.28% | 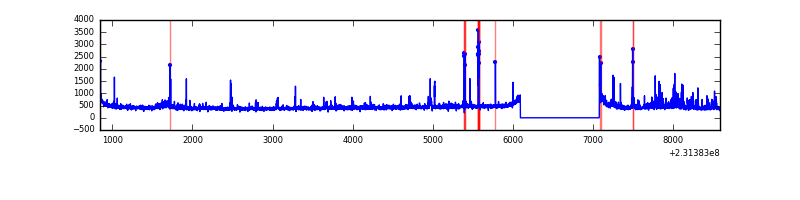 |
Top three noisy pixels from each quadrant. If the there are fewer than three noisy pixels in the level2.evt file, extra rows are filled as -1
| Pixel properties | Quadrant properties | ||||||
|---|---|---|---|---|---|---|---|
| Quadrant | DetID | PixID | Counts | Sigma | Mean | Median | Sigma |
| A | 8 | 5 | 196219 | 1263.93 | 762 | 743 | 154.7 |
| A | 13 | 14 | 25706 | 161.41 | 762 | 743 | 154.7 |
| A | 5 | 16 | 8093 | 47.52 | 762 | 743 | 154.7 |
| B | 10 | 16 | 295740 | 2002.43 | 775 | 756 | 147.3 |
| B | 0 | 214 | 109838 | 740.48 | 775 | 756 | 147.3 |
| B | 4 | 80 | 39607 | 263.73 | 775 | 756 | 147.3 |
| C | 13 | 61 | 5689 | 28.47 | 750 | 754 | 173.3 |
| C | 8 | 222 | 3696 | 16.97 | 750 | 754 | 173.3 |
| C | 14 | 64 | 2588 | 10.58 | 750 | 754 | 173.3 |
| D | 1 | 52 | 98149 | 497.17 | 734 | 716 | 196.0 |
| D | 2 | 136 | 67671 | 341.65 | 734 | 716 | 196.0 |
| D | 12 | 233 | 55005 | 277.02 | 734 | 716 | 196.0 |
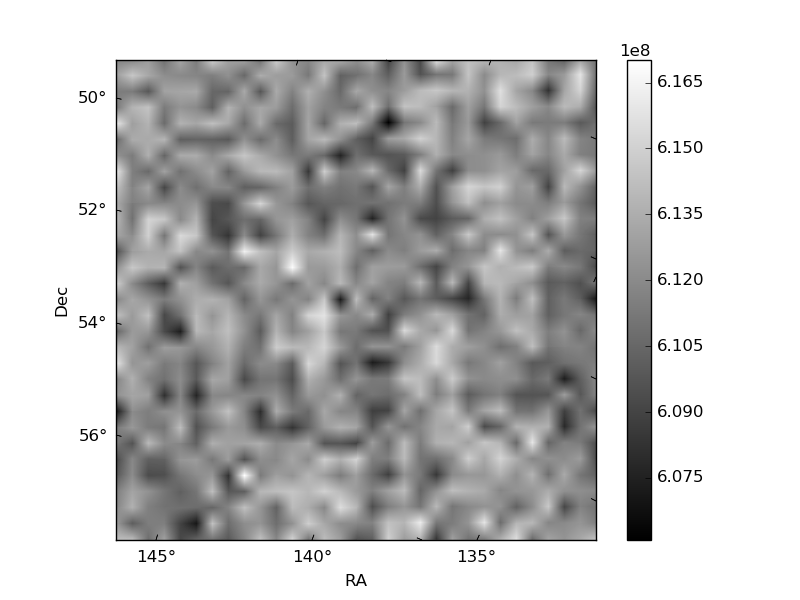
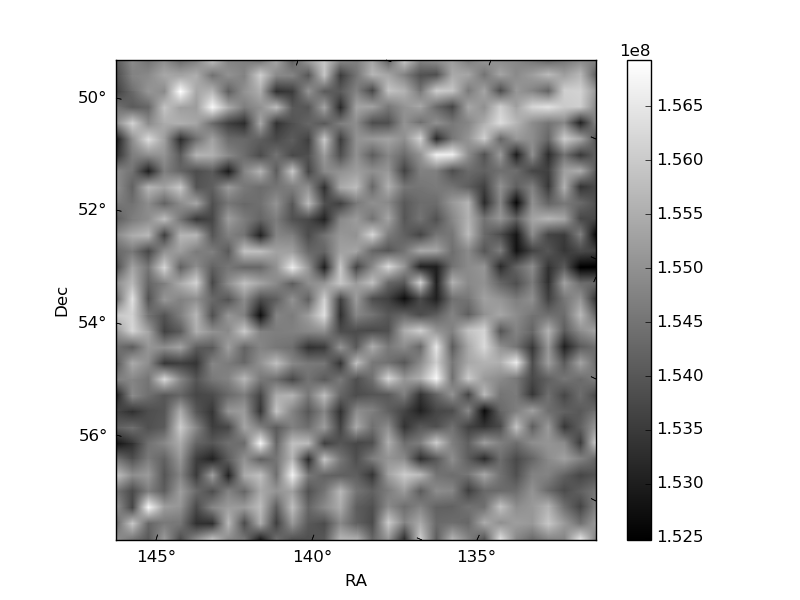
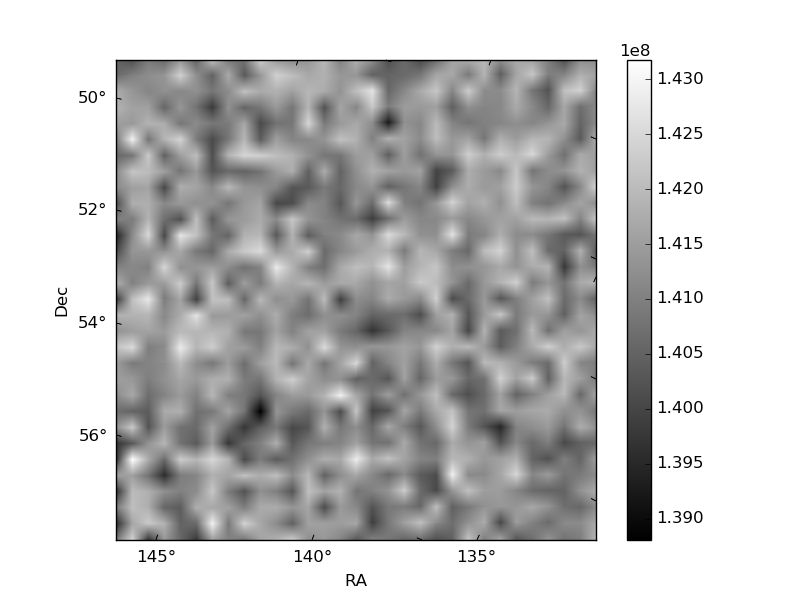
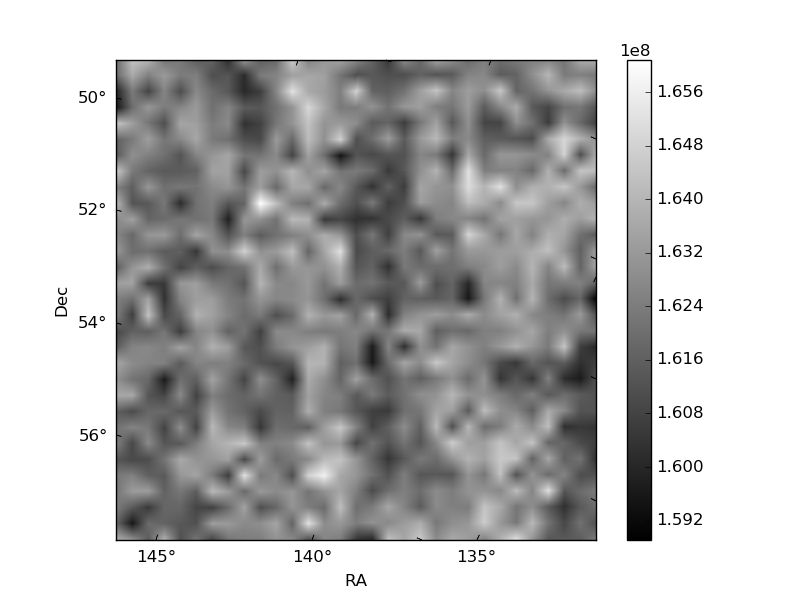
Histogram calculated using DETX and DETY for each event in the final _common_clean file
| Quadrant A | 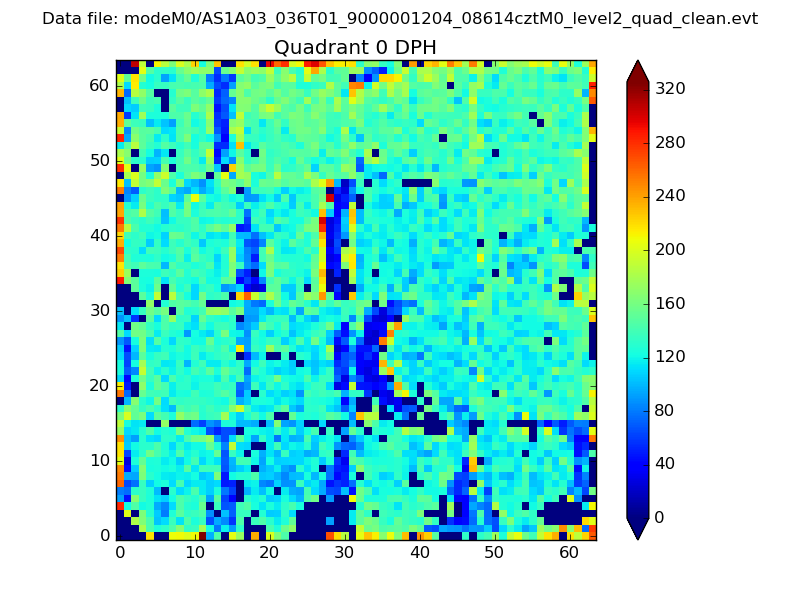 |
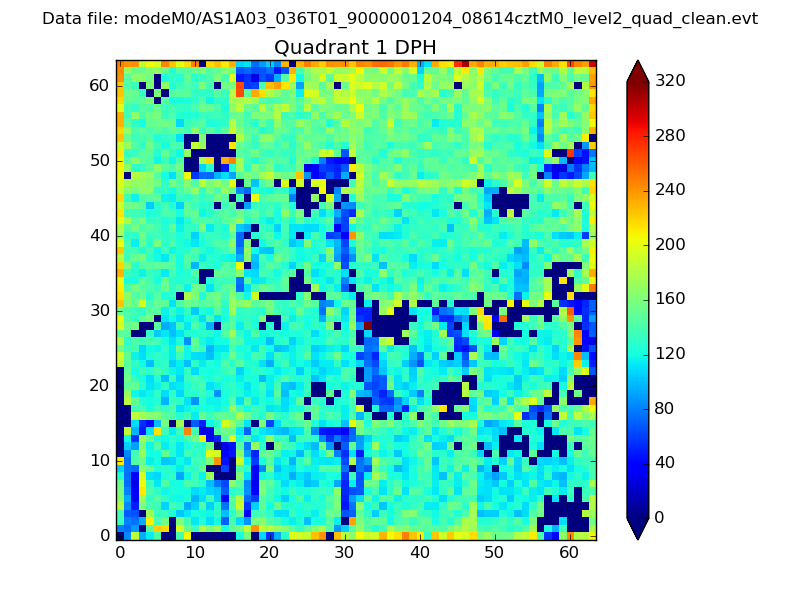 |
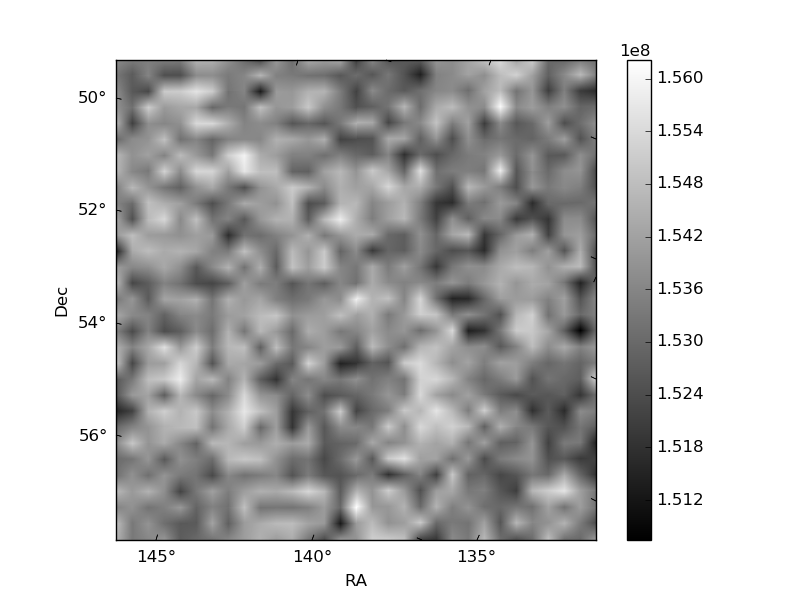
Quadrant B |
|---|---|---|---|
| Quadrant D | 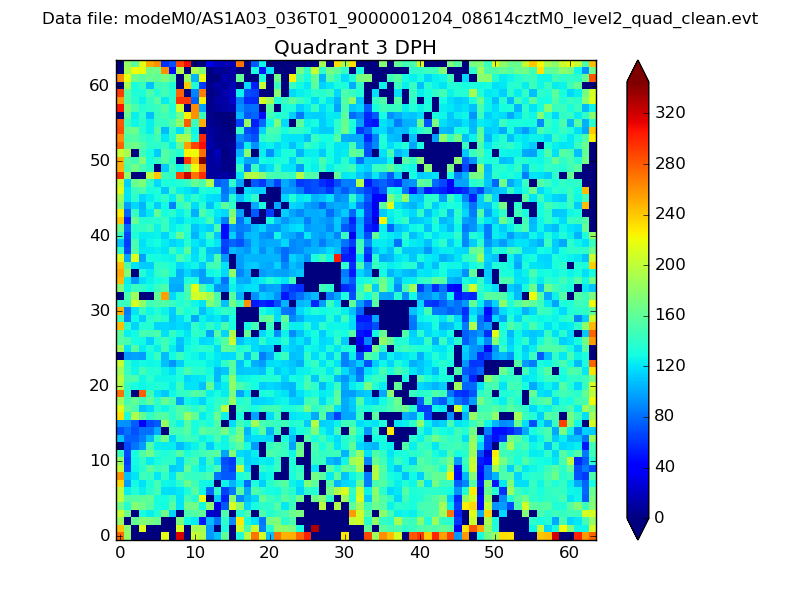 |
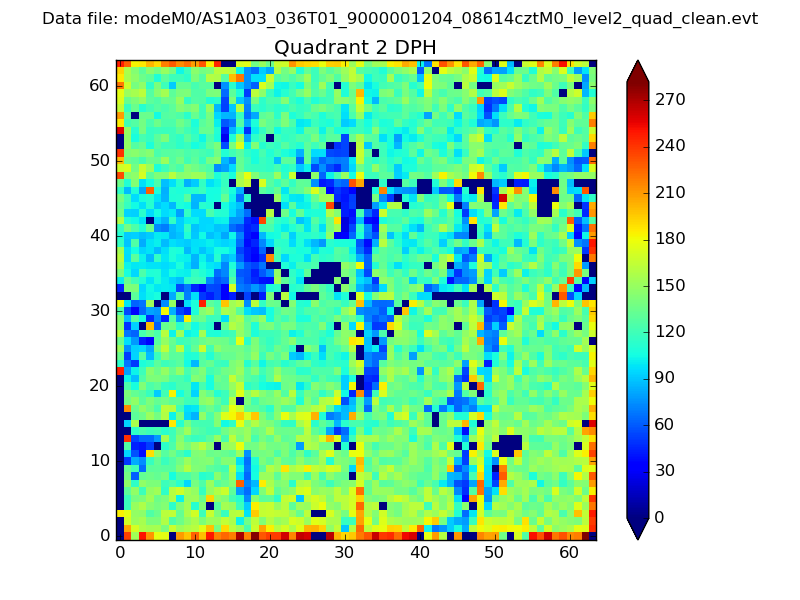 |
Quadrant C |
| Plot type | Count rate plots | Images |
|---|---|---|
| Comparison with Poisson distribution Blue bars denote a histogram of data divided into 1 sec bins. Red curve is a Poisson curve with rate = median count rate of data. |
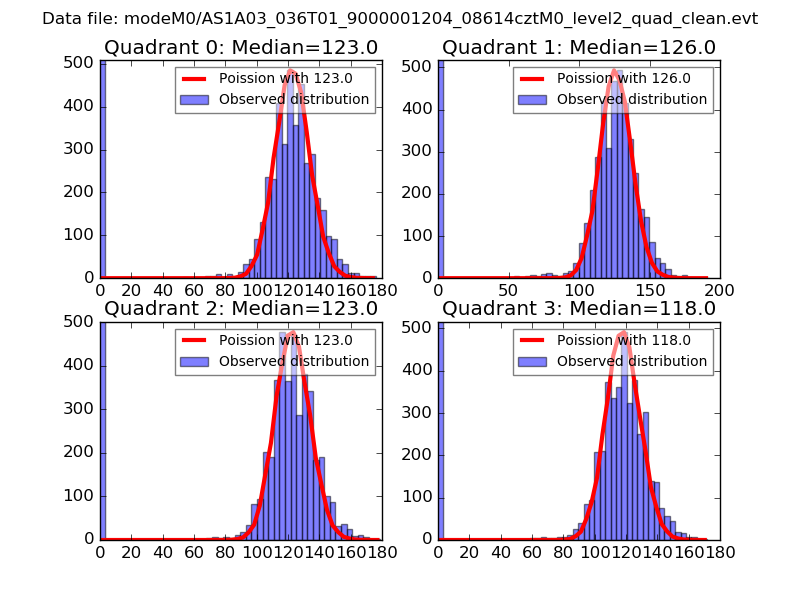 |
 |
| Quadrant-wise count rates Data is divided into 100 sec bins |
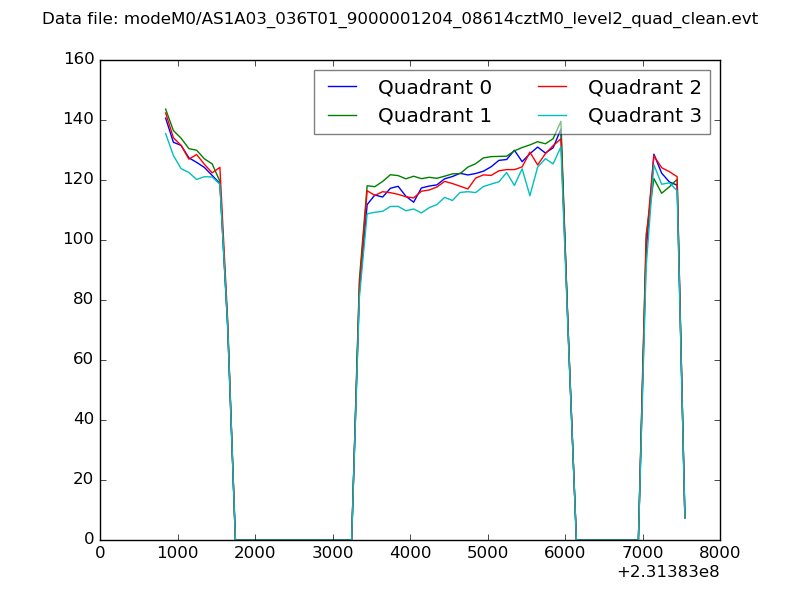 |
|
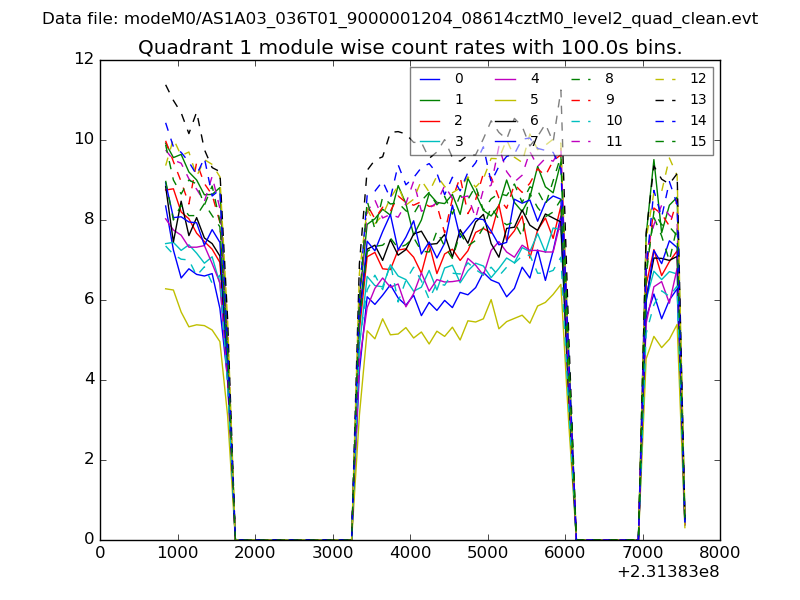
| Module-wise count rates for Quadrant A Data is divided into 100 sec bins |
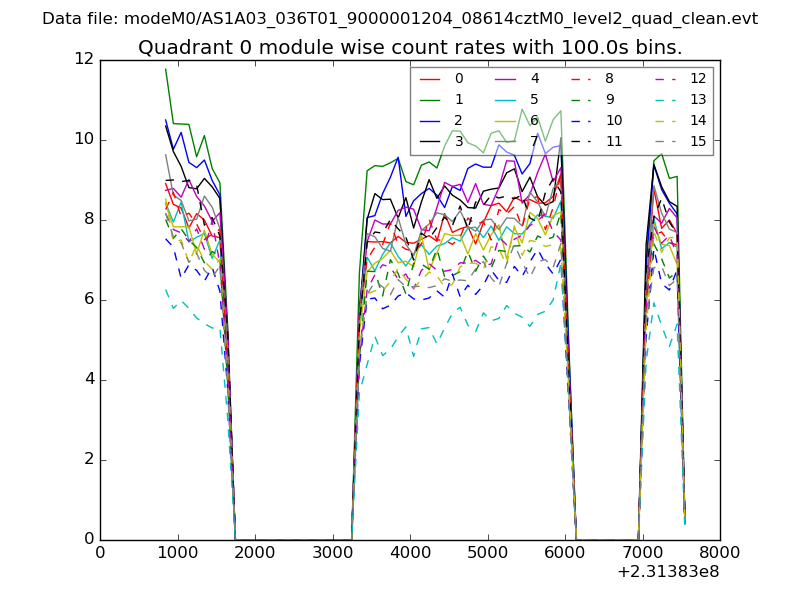 |
 |
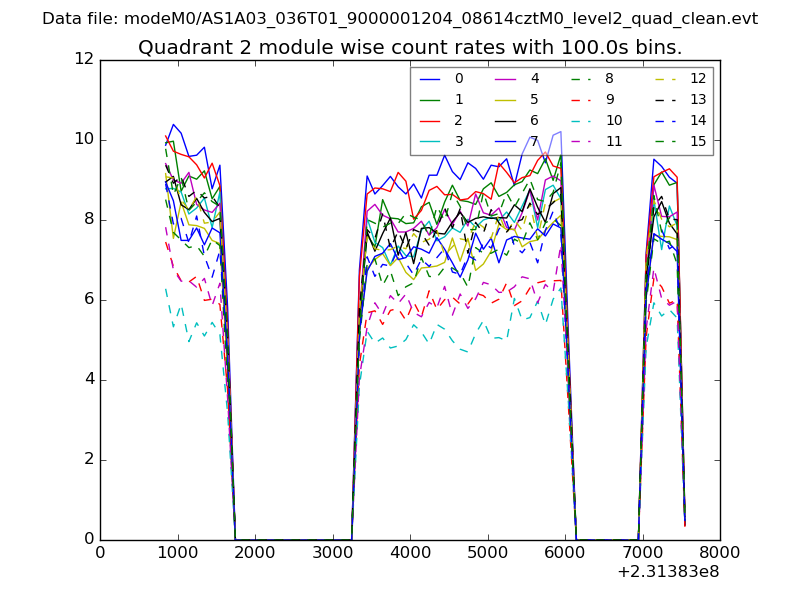
| Module-wise count rates for Quadrant B Data is divided into 100 sec bins |
 |
 |
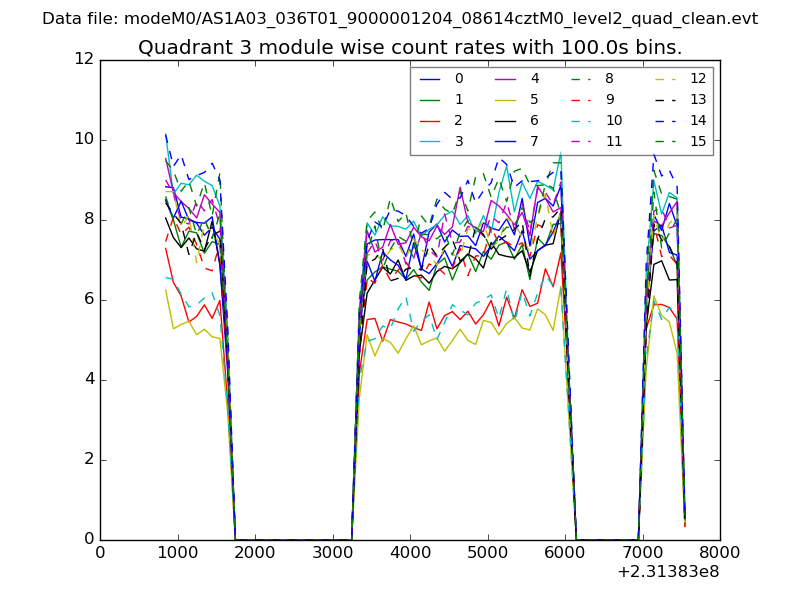
| Module-wise count rates for Quadrant C Data is divided into 100 sec bins |
 |
 |
| Module-wise count rates for Quadrant D Data is divided into 100 sec bins |
 |
 |
| Parameter | Plot |
|---|---|
| CZT HV Monitor | 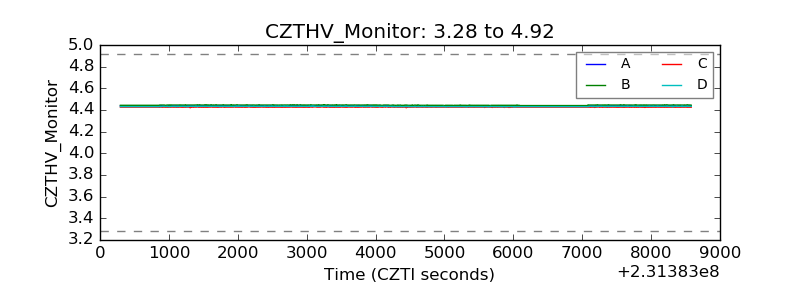 |
| D_VDD |  |
| Temperature 1 | 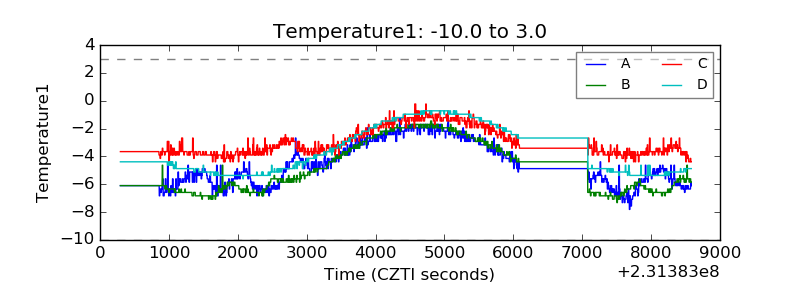 |
| Veto HV Monitor | 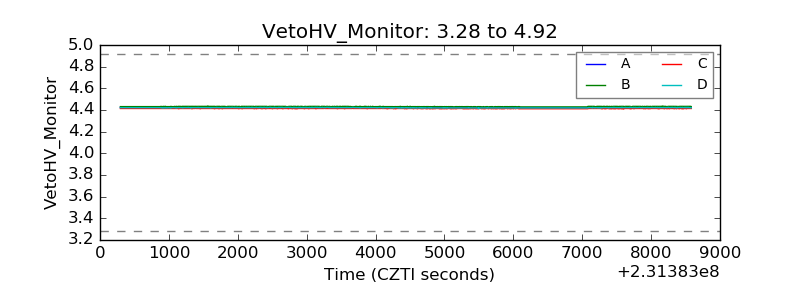 |
| Veto LLD | 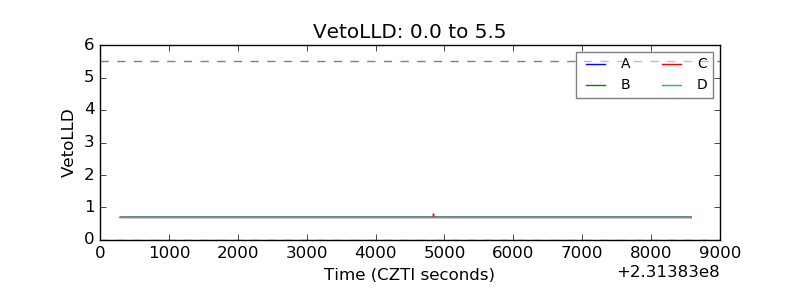 |
| Alpha Counter | 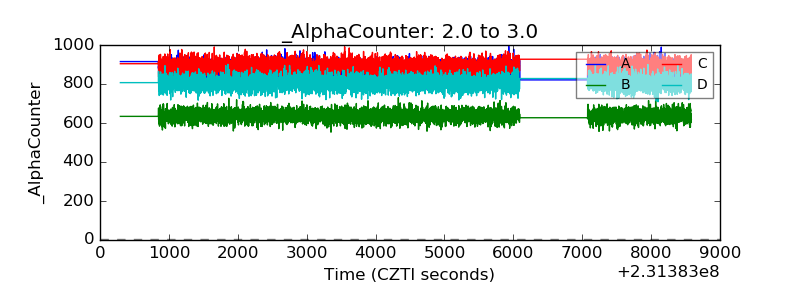 |
| _CPM_Rate | 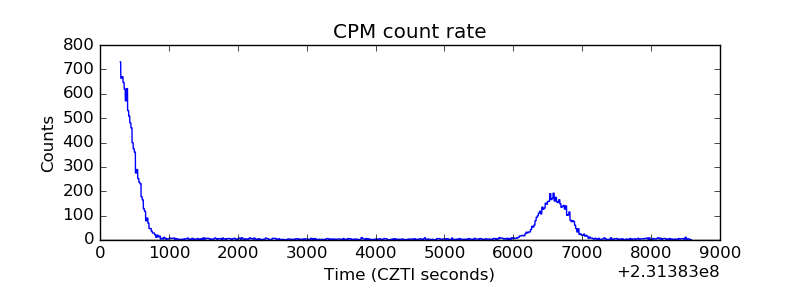 |
| CZT Counter | 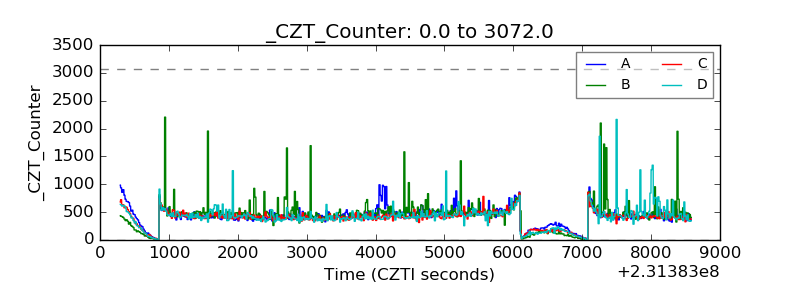 |
| +2.5 Volts monitor |  |
| +5 Volts monitor |  |
| _ROLL_ROT | 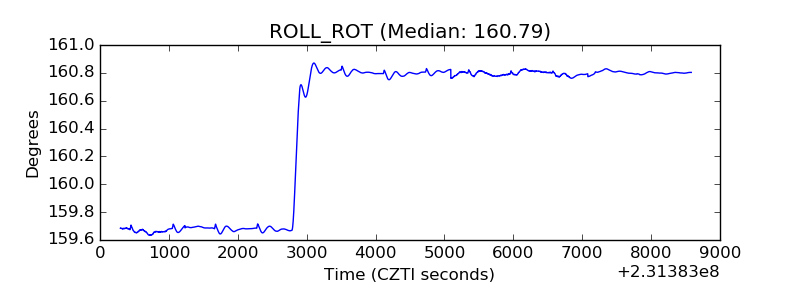 |
| _Roll_DEC | 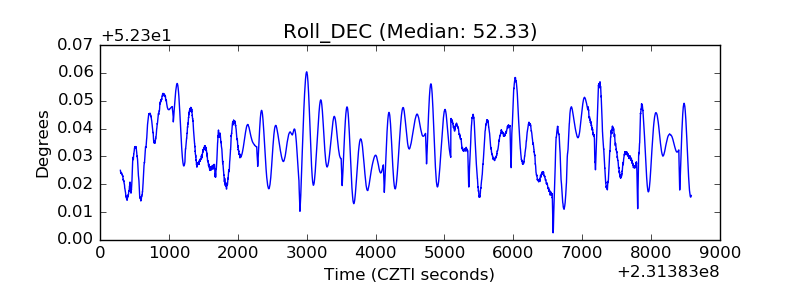 |
| _Roll_RA | 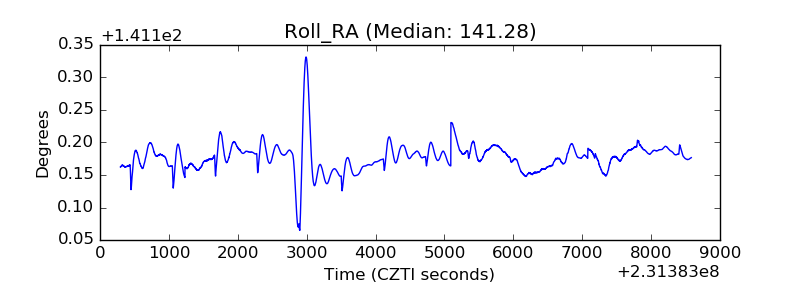 |
| Veto Counter | 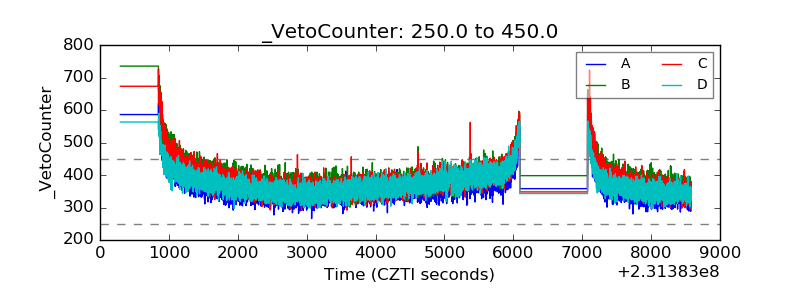 |