| Param | Original file | Final file |
|---|---|---|
| Filename | modeM0/AS1A03_036T01_9000001204_08615cztM0_level2.evt | modeM0/AS1A03_036T01_9000001204_08615cztM0_level2_quad_clean.evt |
| Size (bytes) | 482,863,680 | 83,194,560 |
| Size | 460.5 MB | 79.3 MB |
| Events in quadrant A | 3,329,669 | 505,202 |
| Events in quadrant B | 4,177,813 | 509,896 |
| Events in quadrant C | 3,228,396 | 504,529 |
| Events in quadrant D | 3,386,878 | 486,844 |
| Mode M0 | |||
|---|---|---|---|
| Quadrant | BADHDUFLAG | Total packets | Discarded packets |
| A | 0 | 15199 | 3 |
| B | 0 | 17466 | 2 |
| C | 0 | 15077 | 2 |
| D | 0 | 15619 | 2 |
| Mode M9 | |||
|---|---|---|---|
| Quadrant | BADHDUFLAG | Total packets | Discarded packets |
| A | 0 | 15 | 0 |
| B | 0 | 15 | 0 |
| C | 0 | 15 | 0 |
| D | 0 | 15 | 0 |
| Mode SS | |||
|---|---|---|---|
| Quadrant | BADHDUFLAG | Total packets | Discarded packets |
| A | 0 | 152 | 0 |
| B | 0 | 152 | 0 |
| C | 0 | 152 | 0 |
| D | 0 | 152 | 0 |
| Quadrant | Total seconds | Saturated seconds | Saturation percentage |
|---|---|---|---|
| A | 7362 | 114 | 1.548492% |
| B | 7362 | 386 | 5.243140% |
| C | 7362 | 64 | 0.869329% |
| D | 7362 | 92 | 1.249660% |
Noise dominated data is calculated using 1-second bins in cleaned event files. If a bin has >2000 counts, and if more than 50% of those come from <1% of pixels, then it is considered to be noise-dominated and hence unusable.
| Quadrant | # 1 sec bins | Bins with >0 counts | Bins with >2000 counts | High rate bins dominated by noise | Noise dominated (total time) | Noise dominated (detector-on time) | Marked lightcurve |
|---|---|---|---|---|---|---|---|
| A | 8882 | 7363 | 0 | 0 | 0.00% | 0.00% | 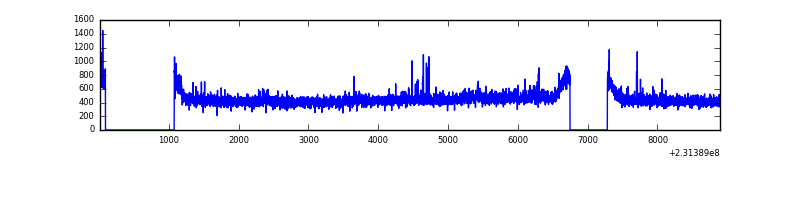 |
| B | 8882 | 7363 | 200 | 200 | 2.25% | 2.72% | 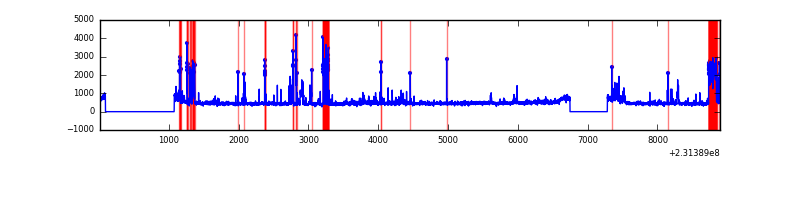 |
| C | 8882 | 7364 | 0 | 0 | 0.00% | 0.00% | 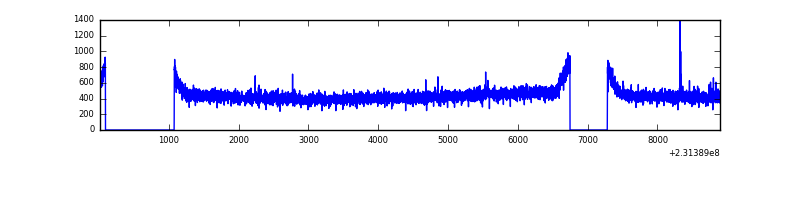 |
| D | 8882 | 7364 | 13 | 13 | 0.15% | 0.18% | 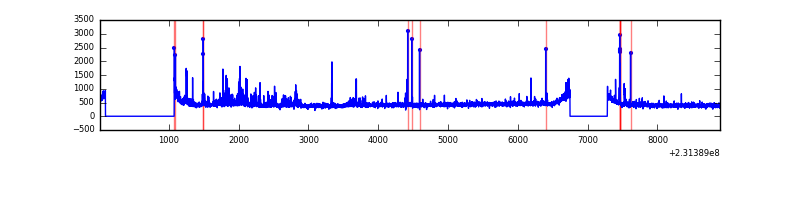 |
Top three noisy pixels from each quadrant. If the there are fewer than three noisy pixels in the level2.evt file, extra rows are filled as -1
| Pixel properties | Quadrant properties | ||||||
|---|---|---|---|---|---|---|---|
| Quadrant | DetID | PixID | Counts | Sigma | Mean | Median | Sigma |
| A | 8 | 5 | 77128 | 446.08 | 839 | 816 | 171.1 |
| A | 13 | 14 | 12998 | 71.21 | 839 | 816 | 171.1 |
| A | 0 | 226 | 7900 | 41.41 | 839 | 816 | 171.1 |
| B | 10 | 16 | 705081 | 4400.56 | 839 | 817 | 160.0 |
| B | 0 | 214 | 85748 | 530.69 | 839 | 817 | 160.0 |
| B | 10 | 246 | 45753 | 280.78 | 839 | 817 | 160.0 |
| C | 14 | 64 | 8381 | 39.83 | 823 | 825 | 189.7 |
| C | 13 | 61 | 6332 | 29.03 | 823 | 825 | 189.7 |
| C | 8 | 222 | 5153 | 22.81 | 823 | 825 | 189.7 |
| D | 2 | 136 | 124179 | 565.02 | 809 | 787 | 218.4 |
| D | 1 | 52 | 63281 | 286.16 | 809 | 787 | 218.4 |
| D | 2 | 14 | 41183 | 184.97 | 809 | 787 | 218.4 |
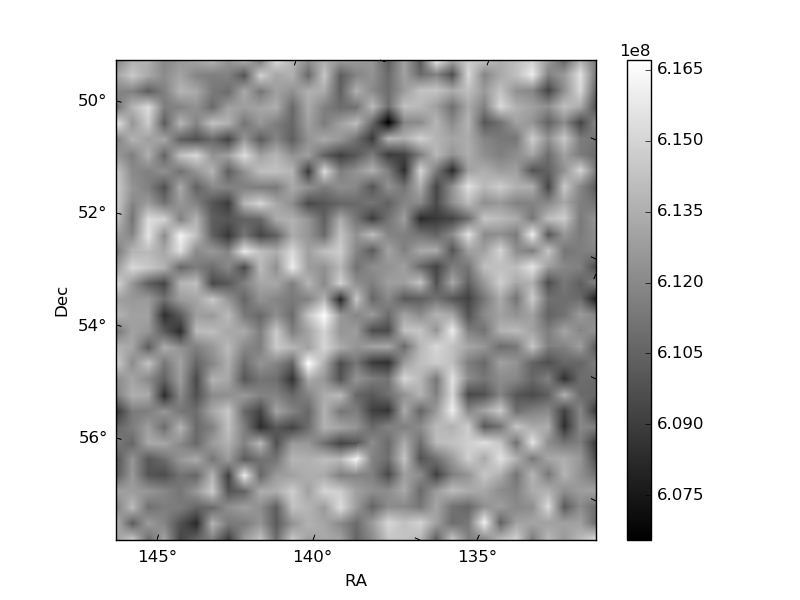
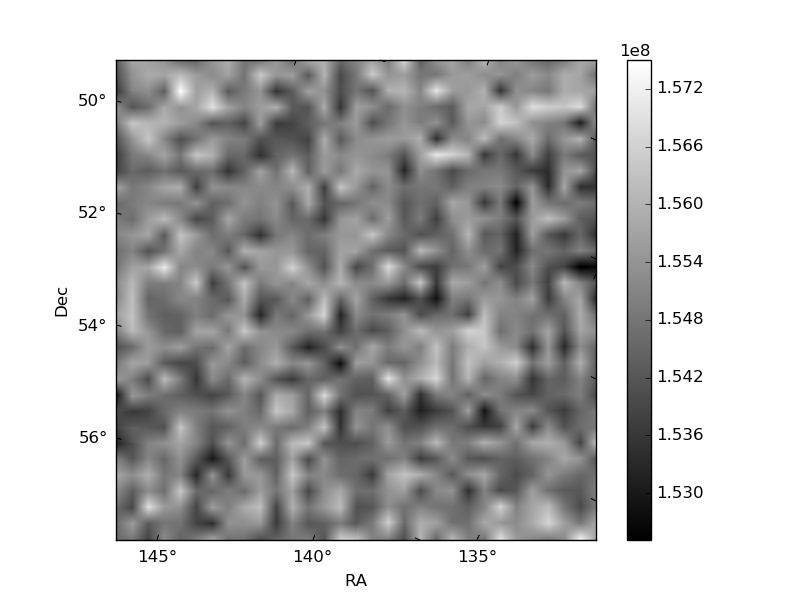
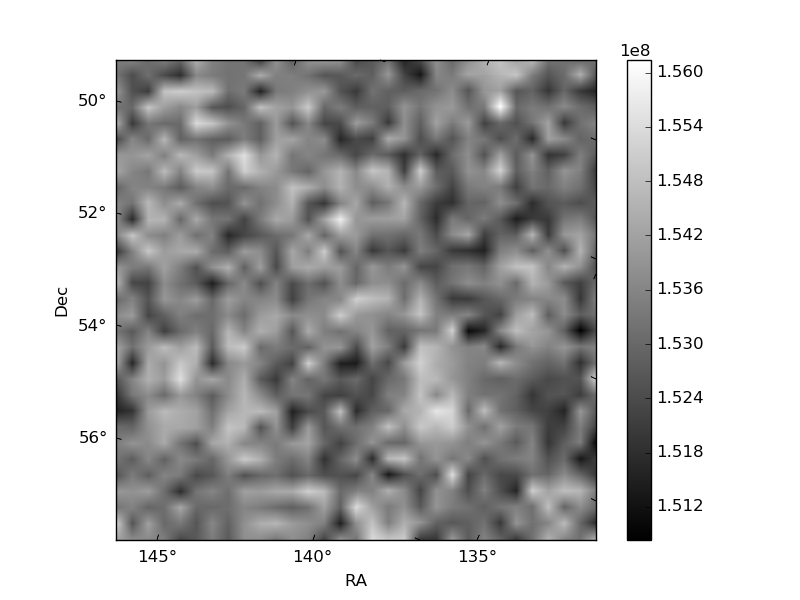
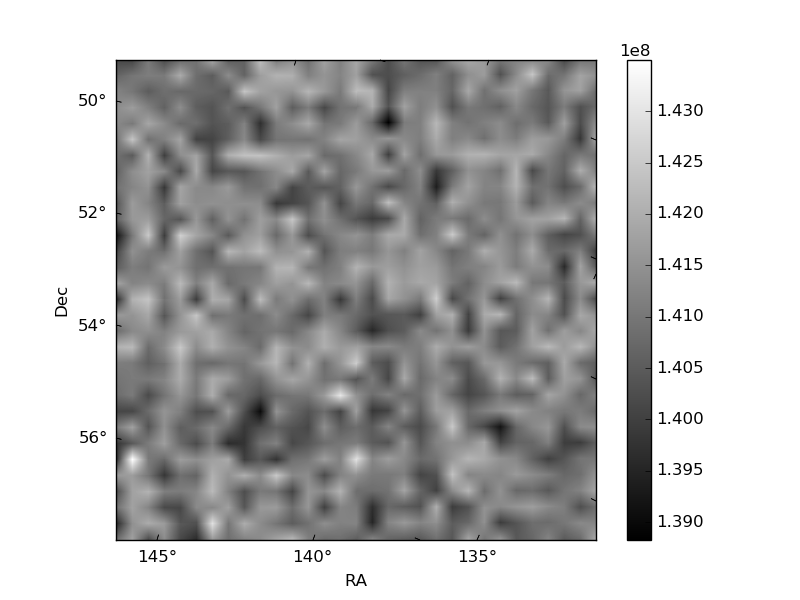
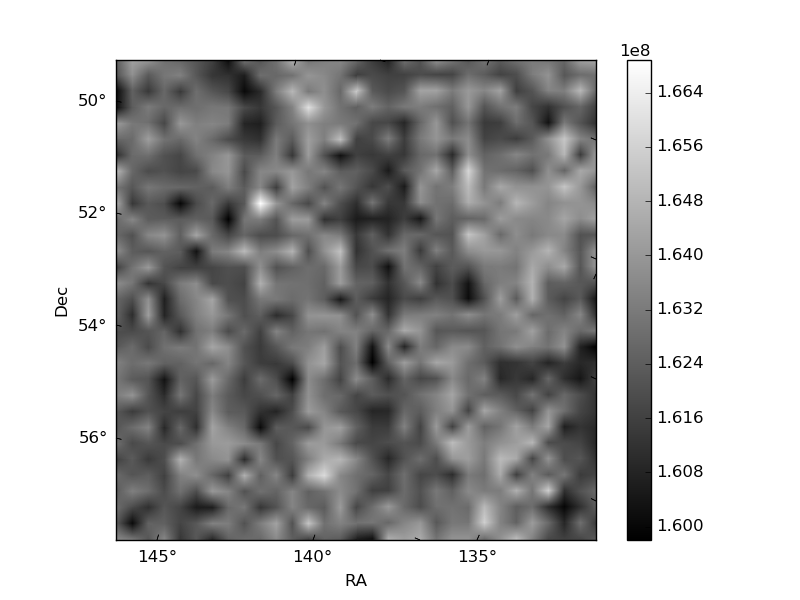
Histogram calculated using DETX and DETY for each event in the final _common_clean file
| Quadrant A | 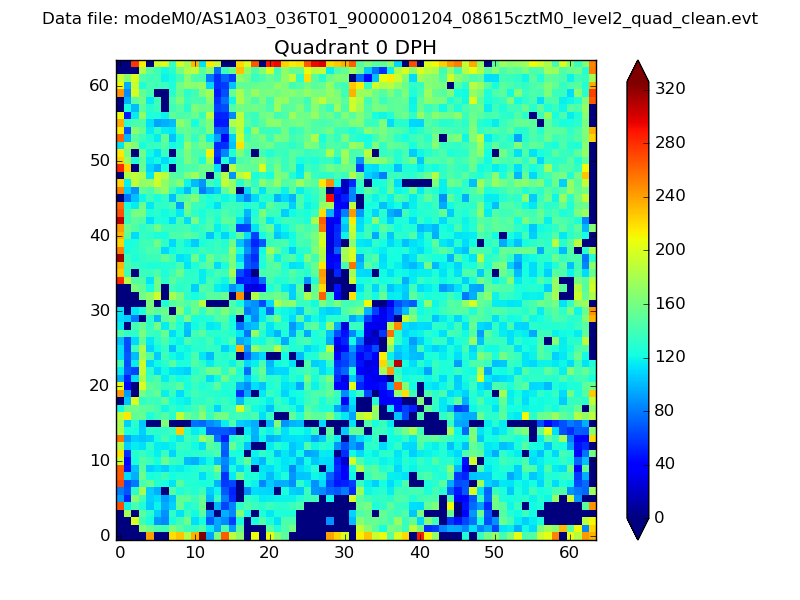 |
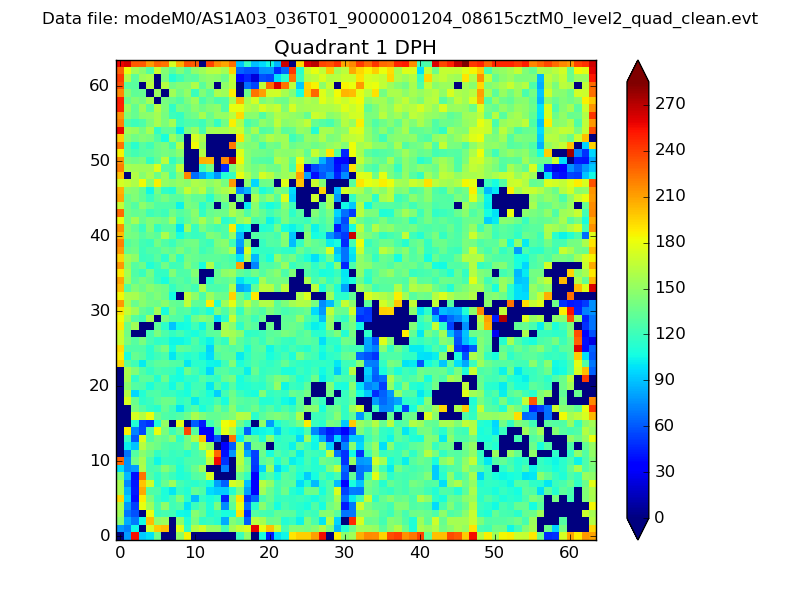 |
Quadrant B |
|---|---|---|---|
| Quadrant D | 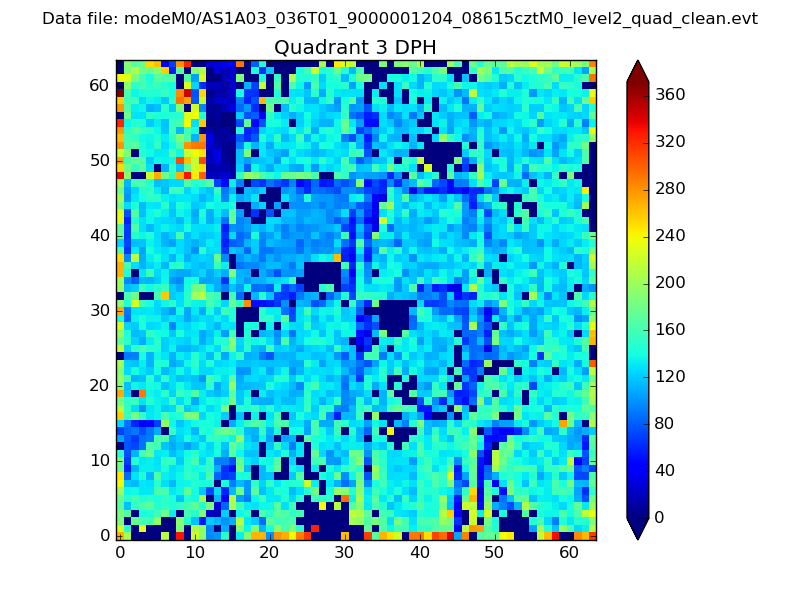 |
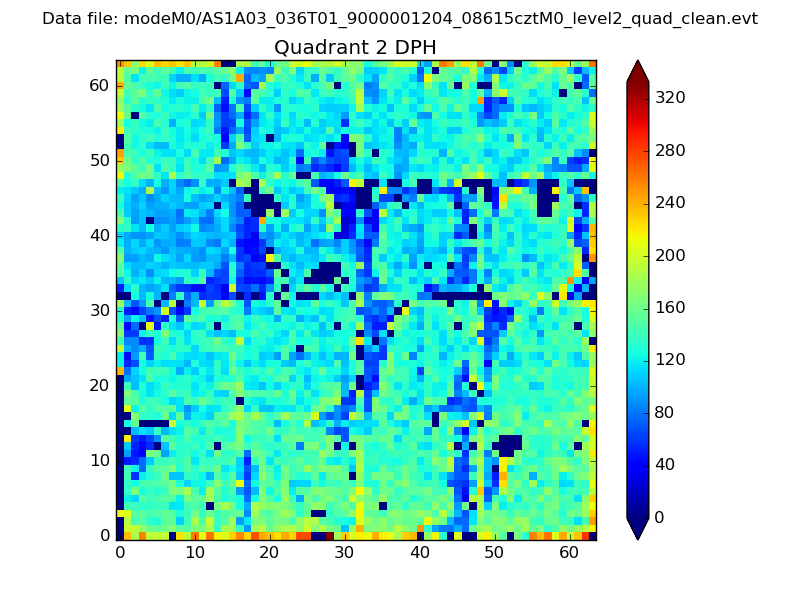 |
Quadrant C |
| Plot type | Count rate plots | Images |
|---|---|---|
| Comparison with Poisson distribution Blue bars denote a histogram of data divided into 1 sec bins. Red curve is a Poisson curve with rate = median count rate of data. |
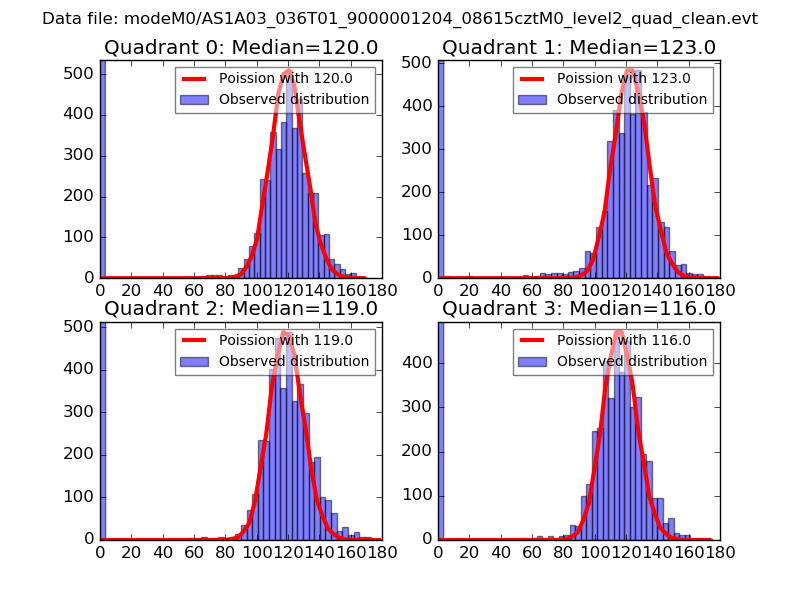 |
 |
| Quadrant-wise count rates Data is divided into 100 sec bins |
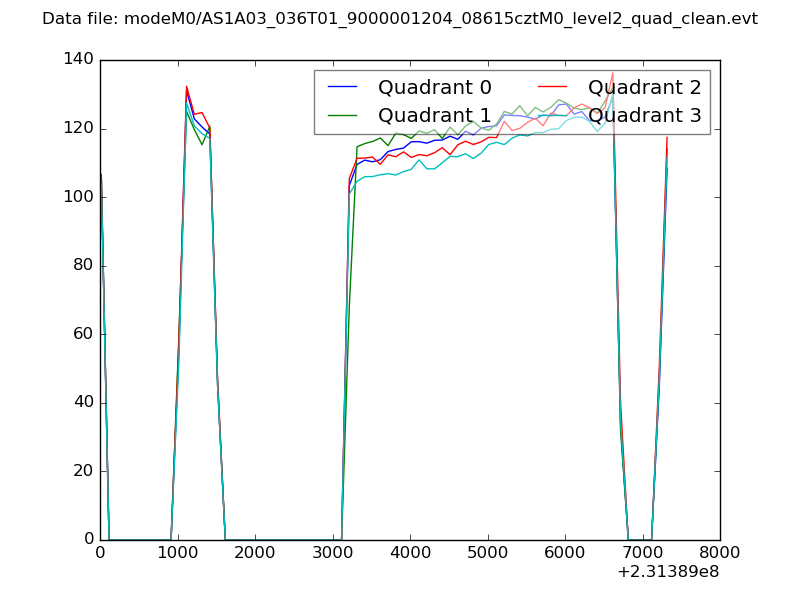 |
|
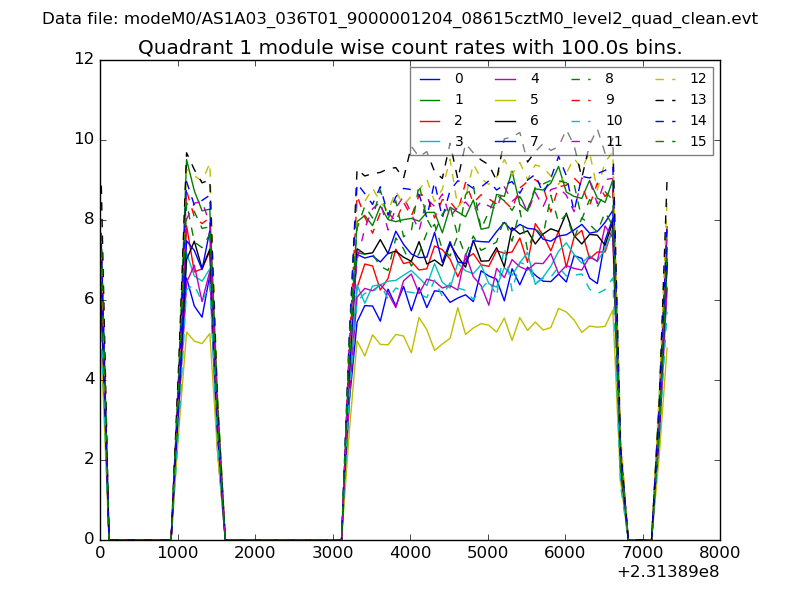
| Module-wise count rates for Quadrant A Data is divided into 100 sec bins |
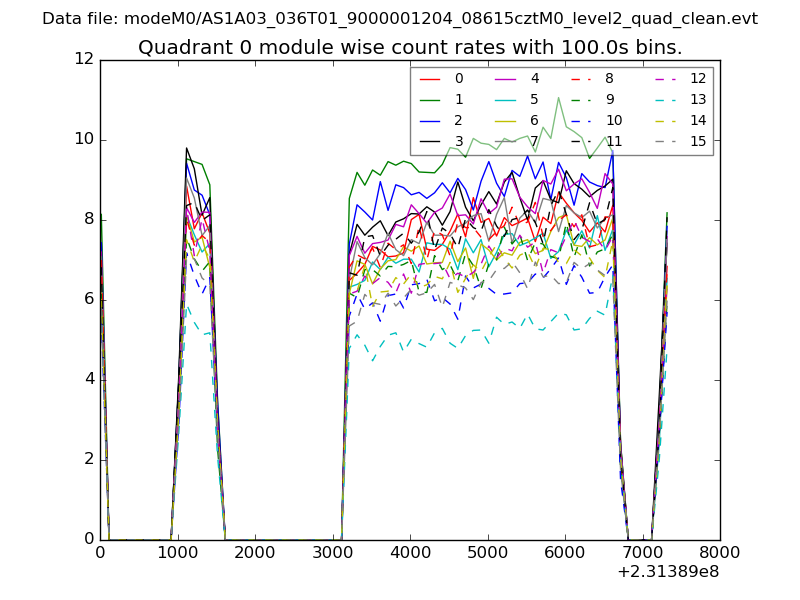 |
 |
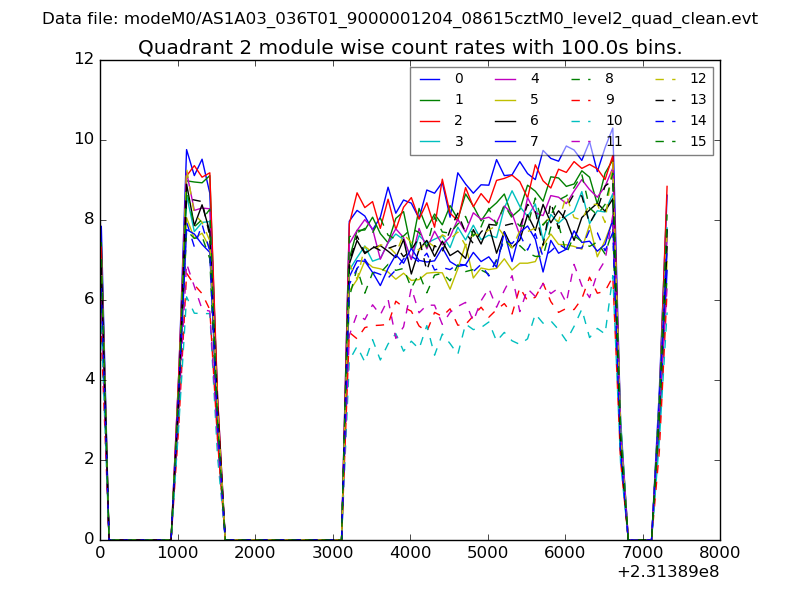
| Module-wise count rates for Quadrant B Data is divided into 100 sec bins |
 |
 |
| Module-wise count rates for Quadrant C Data is divided into 100 sec bins |
 |
 |
| Module-wise count rates for Quadrant D Data is divided into 100 sec bins |
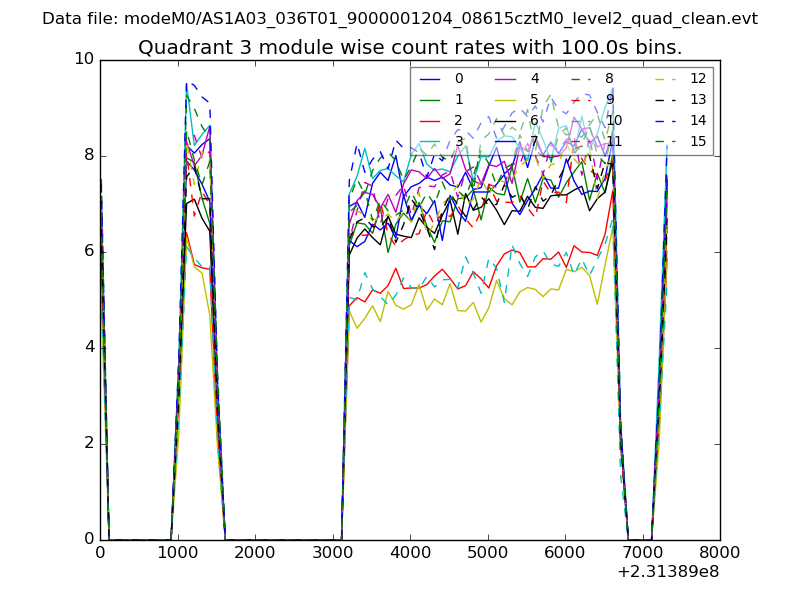 |
 |
| Parameter | Plot |
|---|---|
| CZT HV Monitor | 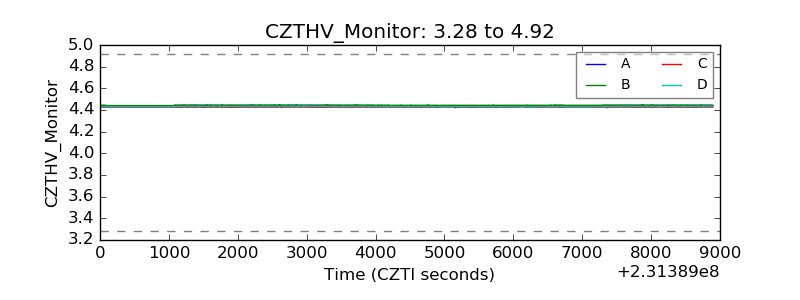 |
| D_VDD | 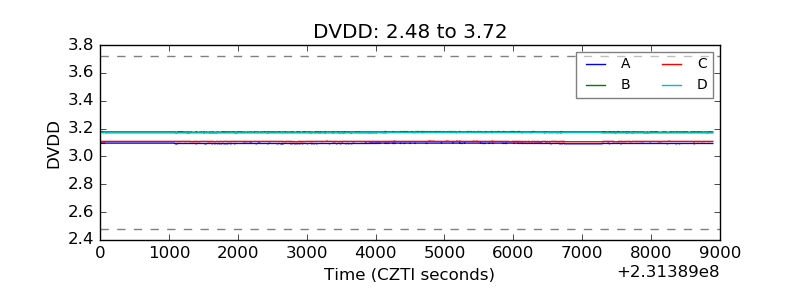 |
| Temperature 1 | 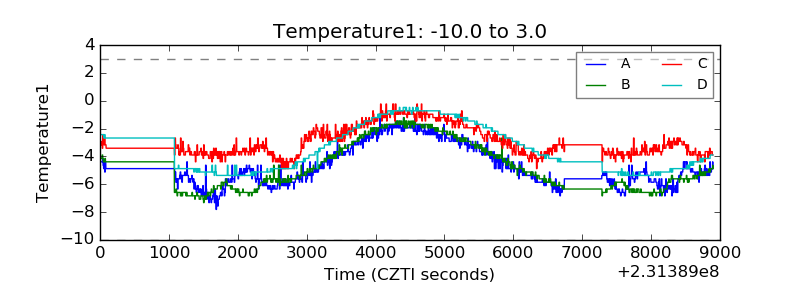 |
| Veto HV Monitor | 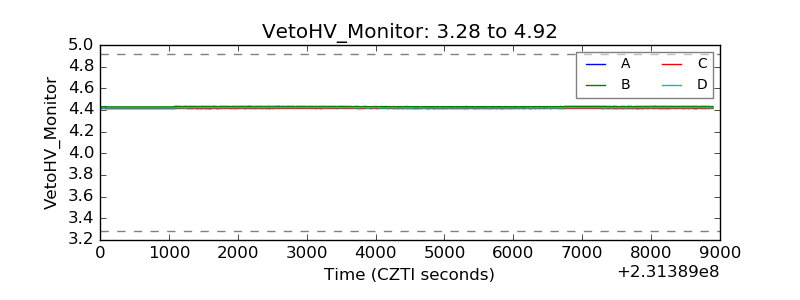 |
| Veto LLD | 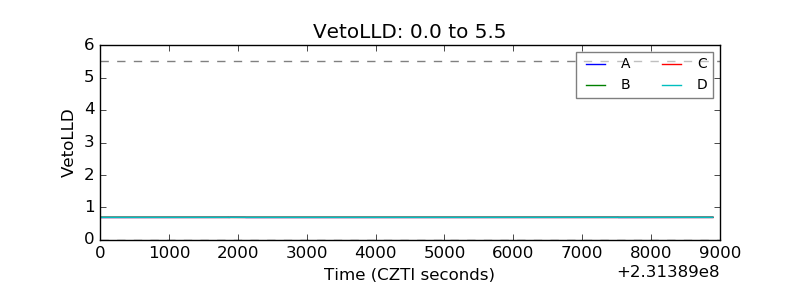 |
| Alpha Counter | 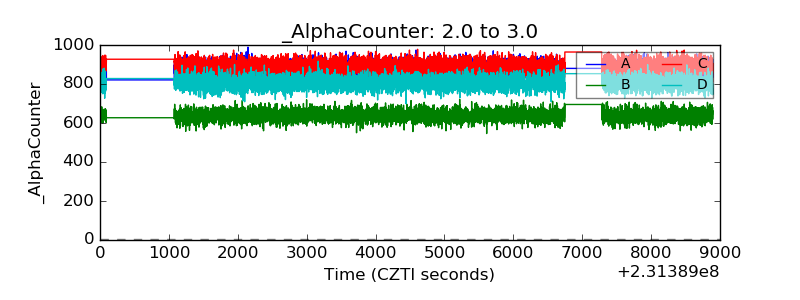 |
| _CPM_Rate | 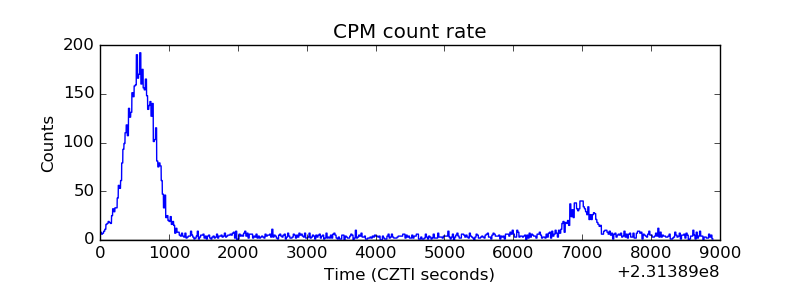 |
| CZT Counter | 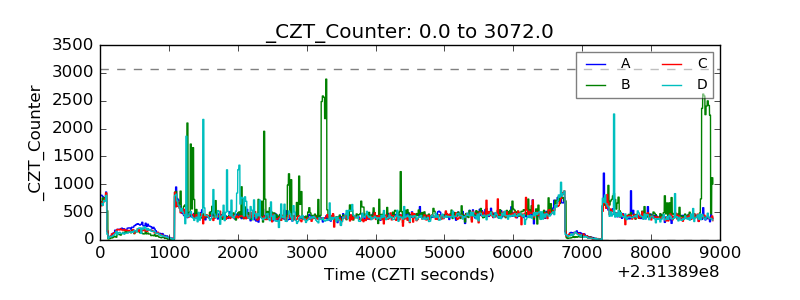 |
| +2.5 Volts monitor |  |
| +5 Volts monitor |  |
| _ROLL_ROT | 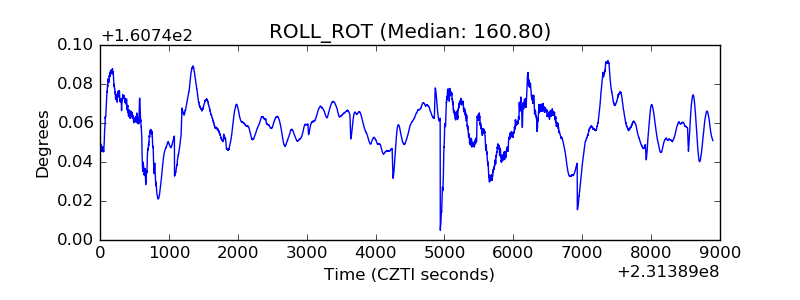 |
| _Roll_DEC | 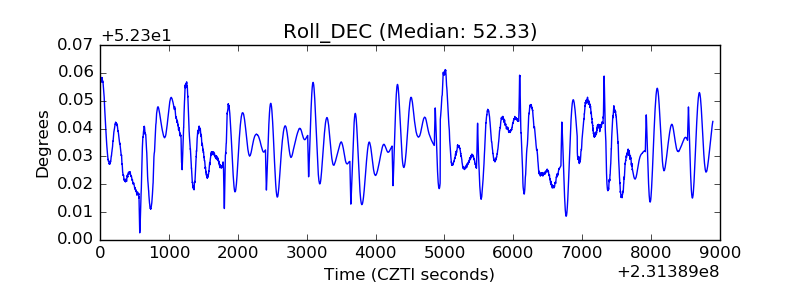 |
| _Roll_RA | 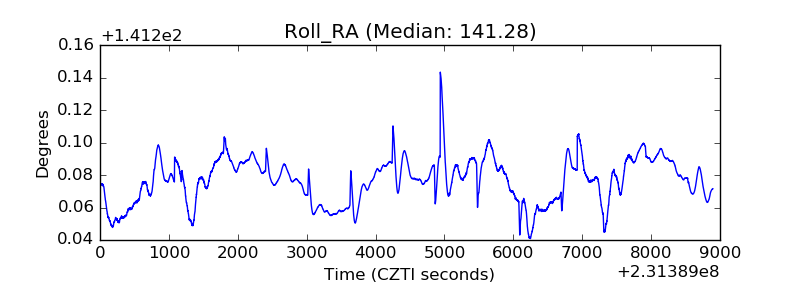 |
| Veto Counter | 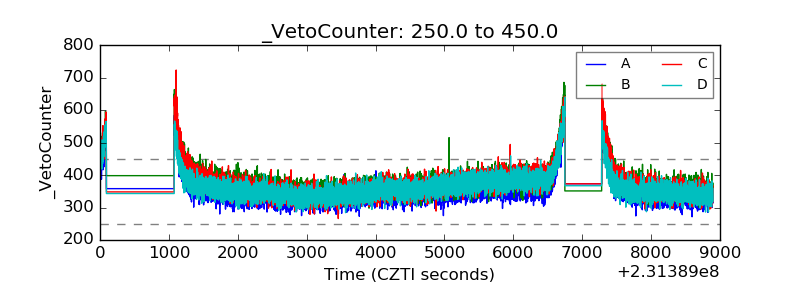 |