| Param | Original file | Final file |
|---|---|---|
| Filename | modeM0/AS1A03_036T01_9000001204_08616cztM0_level2.evt | modeM0/AS1A03_036T01_9000001204_08616cztM0_level2_quad_clean.evt |
| Size (bytes) | 557,346,240 | 100,235,520 |
| Size | 531.5 MB | 95.6 MB |
| Events in quadrant A | 3,836,962 | 614,494 |
| Events in quadrant B | 4,567,644 | 626,208 |
| Events in quadrant C | 3,870,664 | 616,313 |
| Events in quadrant D | 4,030,367 | 591,999 |
| Mode M0 | |||
|---|---|---|---|
| Quadrant | BADHDUFLAG | Total packets | Discarded packets |
| A | 0 | 17539 | 5 |
| B | 0 | 19204 | 4 |
| C | 0 | 17573 | 4 |
| D | 0 | 18239 | 4 |
| Mode M9 | |||
|---|---|---|---|
| Quadrant | BADHDUFLAG | Total packets | Discarded packets |
| A | 0 | 5 | 0 |
| B | 0 | 5 | 0 |
| C | 0 | 5 | 0 |
| D | 0 | 5 | 0 |
| Mode SS | |||
|---|---|---|---|
| Quadrant | BADHDUFLAG | Total packets | Discarded packets |
| A | 0 | 174 | 0 |
| B | 0 | 174 | 0 |
| C | 0 | 174 | 0 |
| D | 0 | 174 | 0 |
| Quadrant | Total seconds | Saturated seconds | Saturation percentage |
|---|---|---|---|
| A | 8429 | 298 | 3.535413% |
| B | 8429 | 468 | 5.552260% |
| C | 8429 | 182 | 2.159212% |
| D | 8429 | 245 | 2.906632% |
Noise dominated data is calculated using 1-second bins in cleaned event files. If a bin has >2000 counts, and if more than 50% of those come from <1% of pixels, then it is considered to be noise-dominated and hence unusable.
| Quadrant | # 1 sec bins | Bins with >0 counts | Bins with >2000 counts | High rate bins dominated by noise | Noise dominated (total time) | Noise dominated (detector-on time) | Marked lightcurve |
|---|---|---|---|---|---|---|---|
| A | 9094 | 8429 | 6 | 6 | 0.07% | 0.07% | 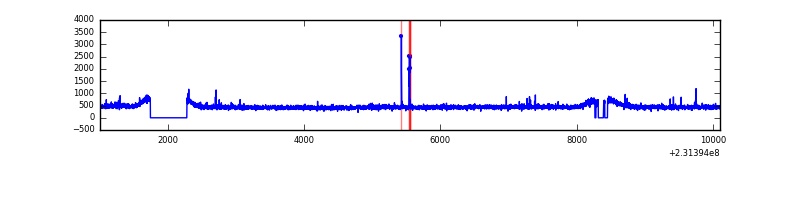 |
| B | 9094 | 8429 | 111 | 111 | 1.22% | 1.32% | 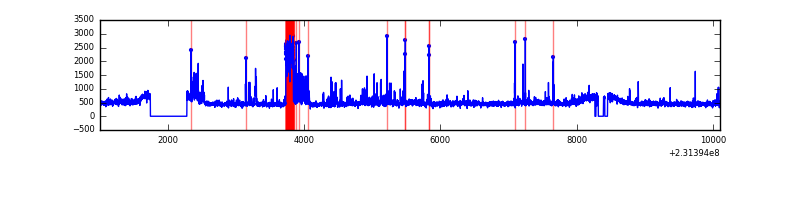 |
| C | 9094 | 8433 | 0 | 0 | 0.00% | 0.00% | 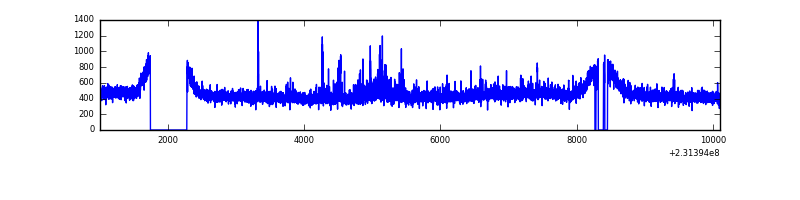 |
| D | 9094 | 8433 | 27 | 27 | 0.30% | 0.32% | 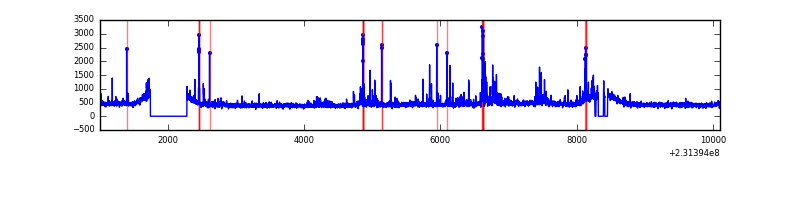 |
Top three noisy pixels from each quadrant. If the there are fewer than three noisy pixels in the level2.evt file, extra rows are filled as -1
| Pixel properties | Quadrant properties | ||||||
|---|---|---|---|---|---|---|---|
| Quadrant | DetID | PixID | Counts | Sigma | Mean | Median | Sigma |
| A | 15 | 174 | 36341 | 176.24 | 977 | 950 | 200.8 |
| A | 8 | 5 | 23141 | 110.51 | 977 | 950 | 200.8 |
| A | 13 | 14 | 9467 | 42.41 | 977 | 950 | 200.8 |
| B | 10 | 16 | 431647 | 2292.34 | 983 | 956 | 187.9 |
| B | 0 | 214 | 115395 | 609.1 | 983 | 956 | 187.9 |
| B | 0 | 219 | 79039 | 415.59 | 983 | 956 | 187.9 |
| C | 14 | 64 | 109328 | 488.75 | 961 | 962 | 221.7 |
| C | 13 | 61 | 7238 | 28.31 | 961 | 962 | 221.7 |
| C | 8 | 222 | 6177 | 23.52 | 961 | 962 | 221.7 |
| D | 10 | 253 | 121489 | 473.86 | 943 | 922 | 254.4 |
| D | 2 | 136 | 114740 | 447.33 | 943 | 922 | 254.4 |
| D | 2 | 14 | 71647 | 277.97 | 943 | 922 | 254.4 |
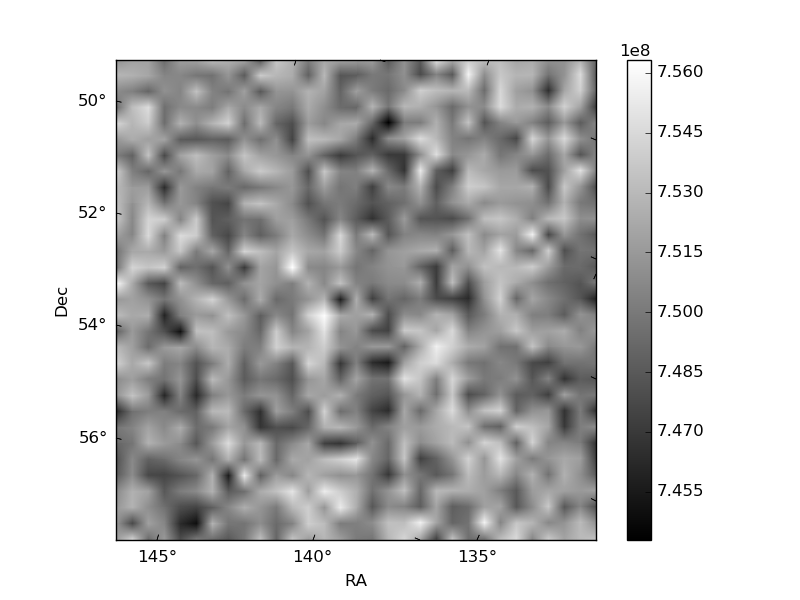
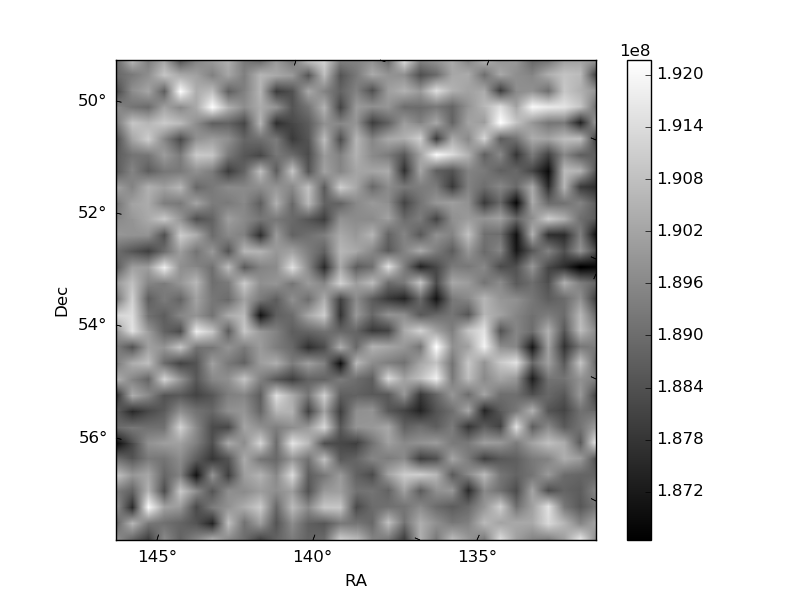
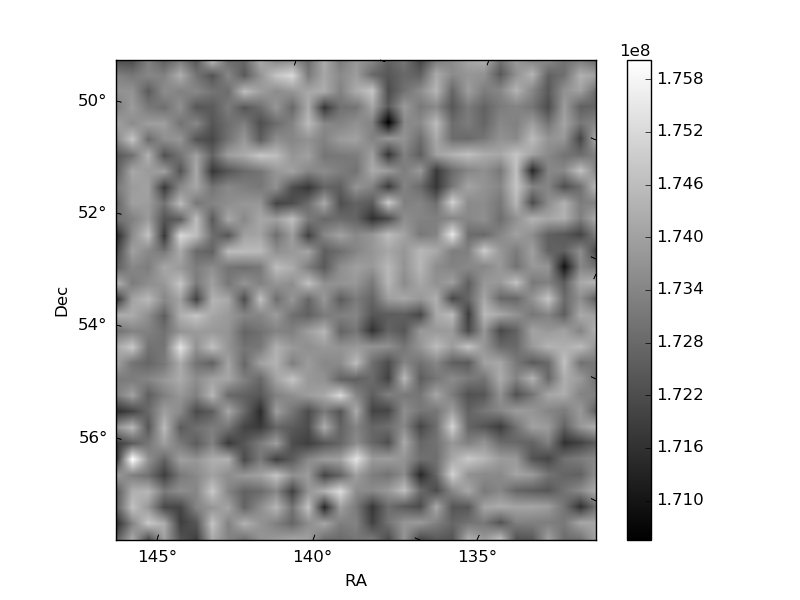
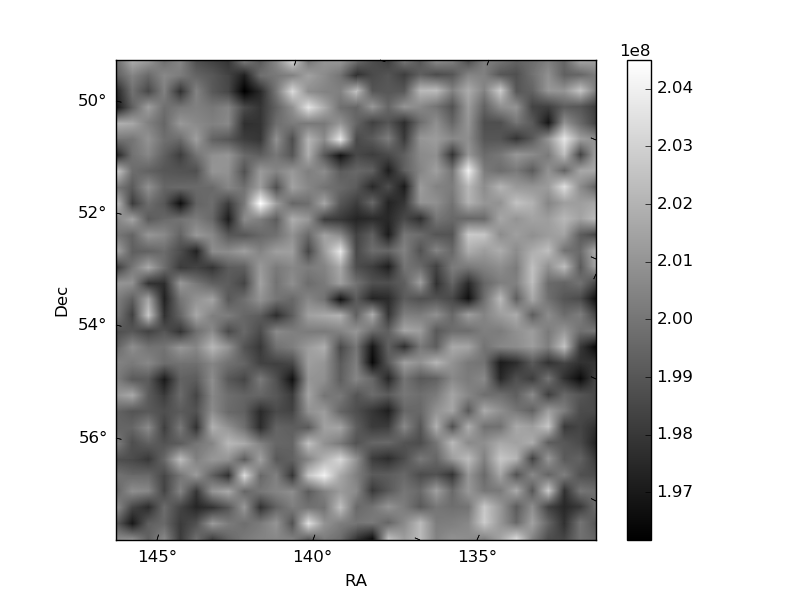
Histogram calculated using DETX and DETY for each event in the final _common_clean file
| Quadrant A | 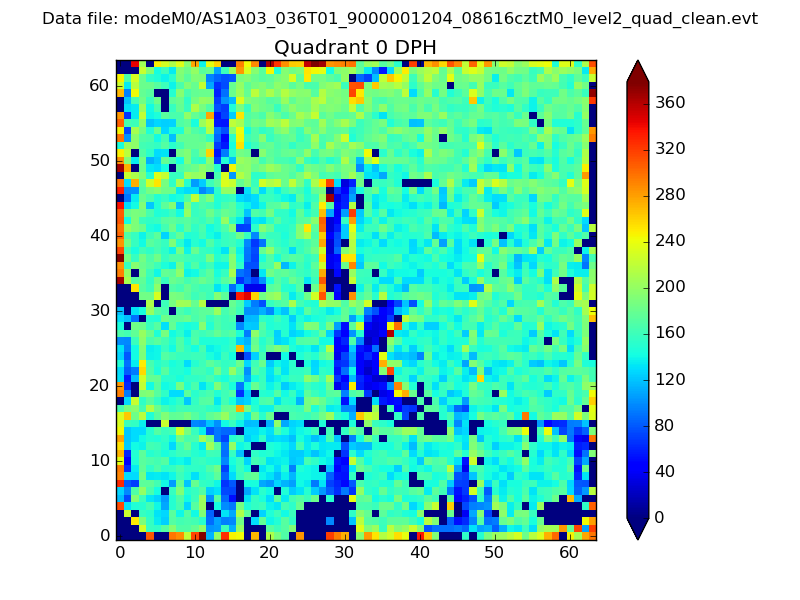 |
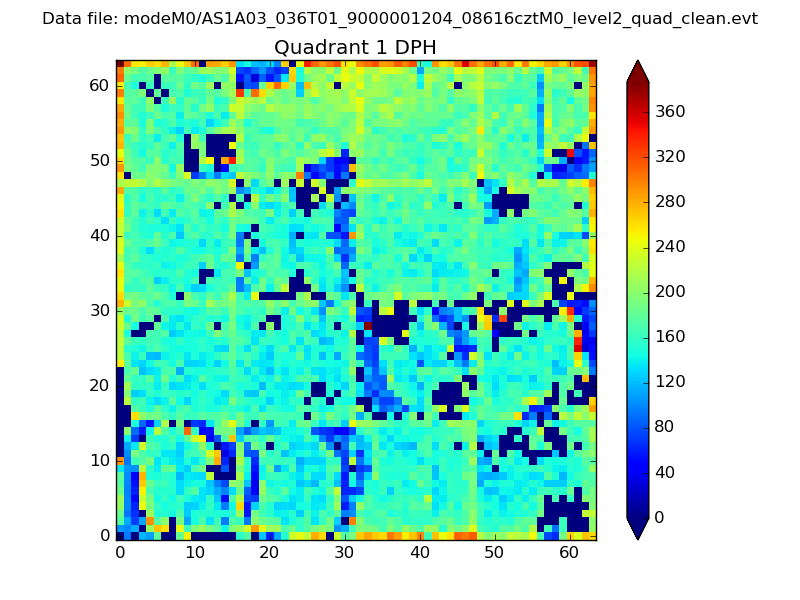 |
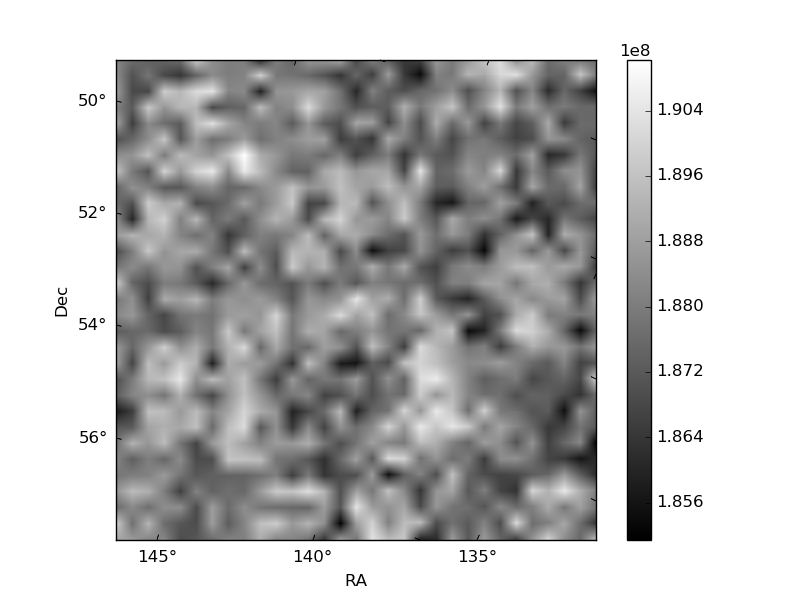
Quadrant B |
|---|---|---|---|
| Quadrant D | 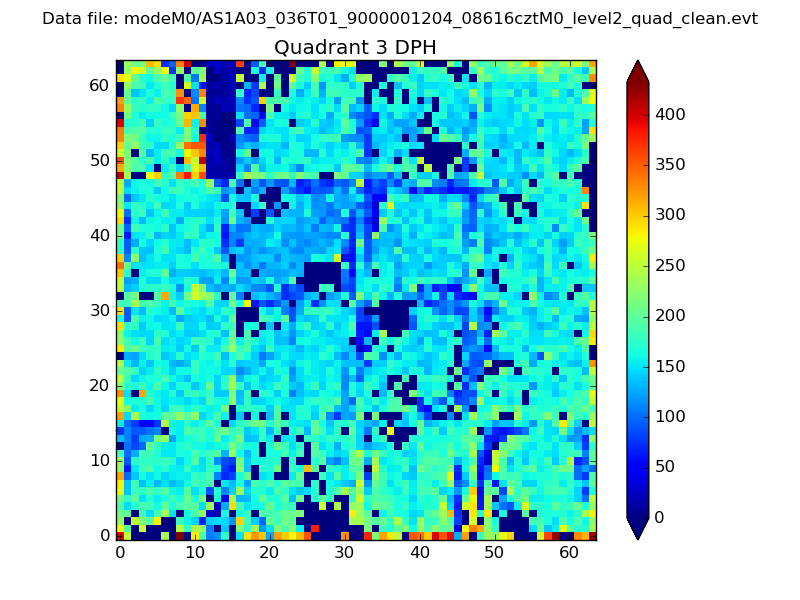 |
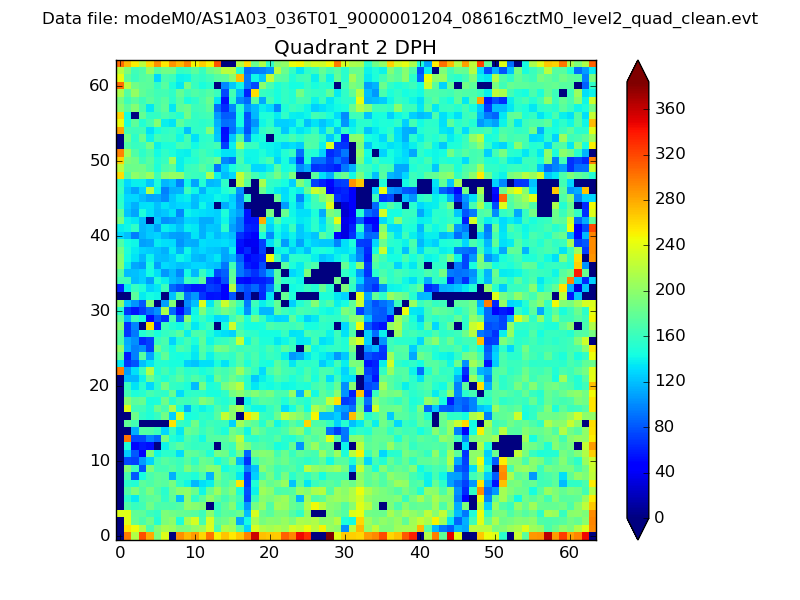 |
Quadrant C |
| Plot type | Count rate plots | Images |
|---|---|---|
| Comparison with Poisson distribution Blue bars denote a histogram of data divided into 1 sec bins. Red curve is a Poisson curve with rate = median count rate of data. |
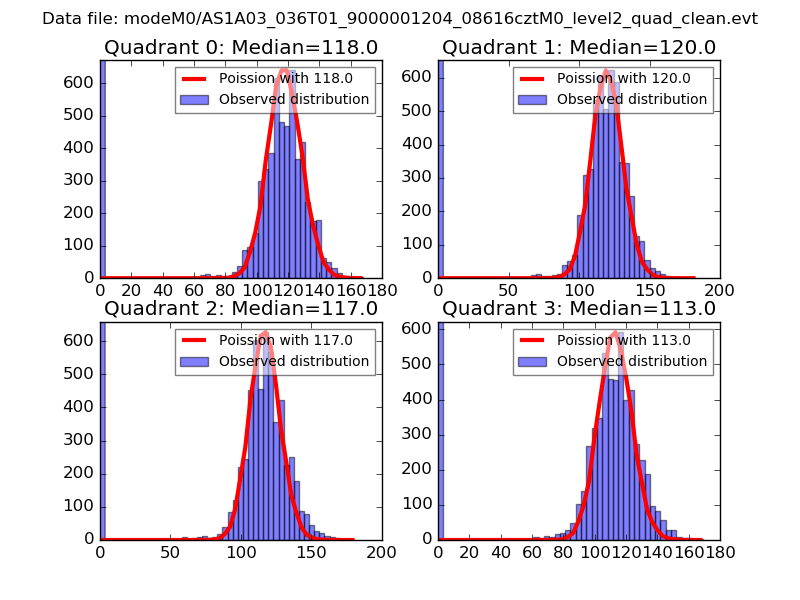 |
 |
| Quadrant-wise count rates Data is divided into 100 sec bins |
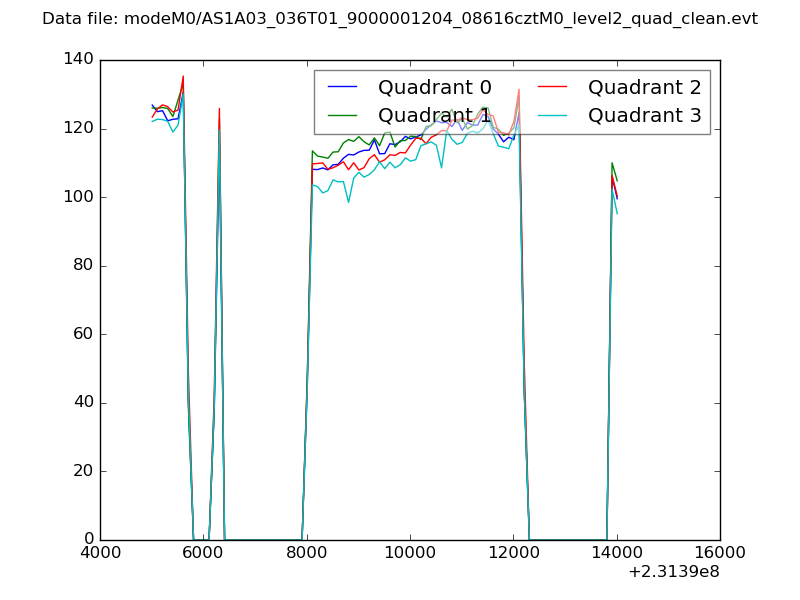 |
|
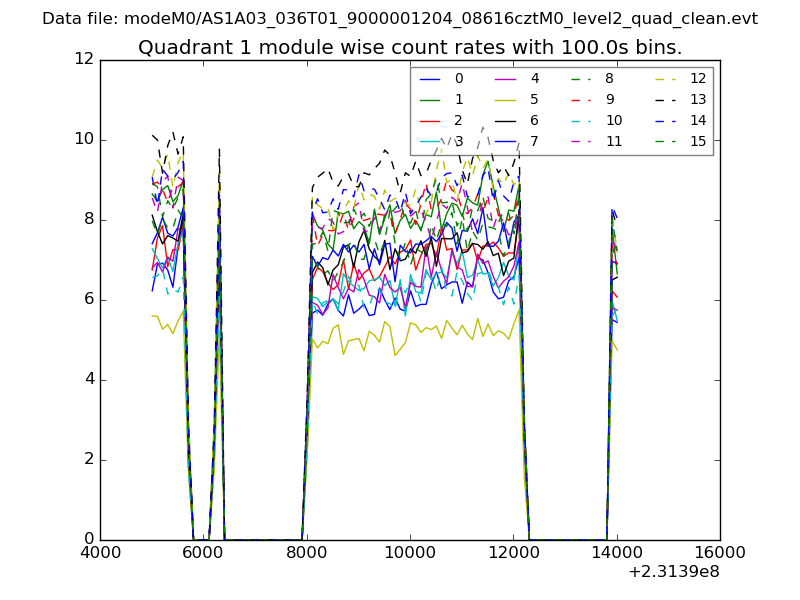
| Module-wise count rates for Quadrant A Data is divided into 100 sec bins |
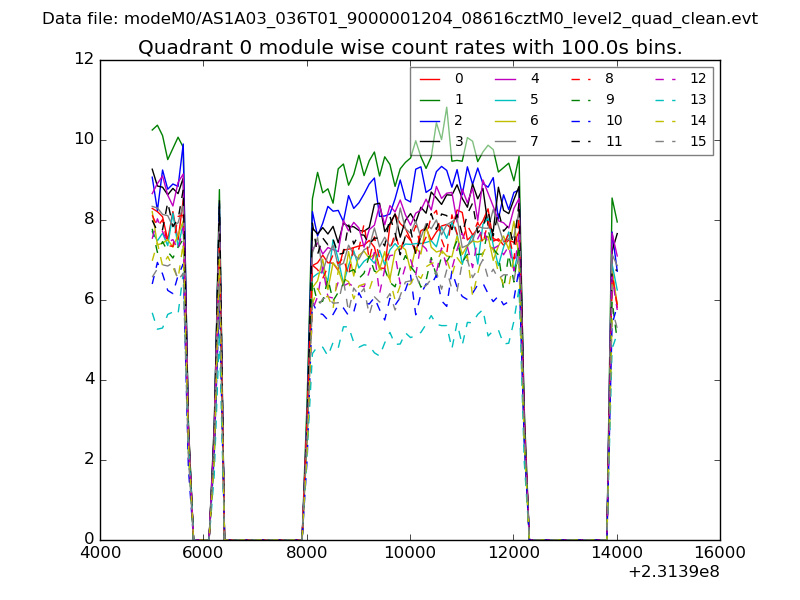 |
 |
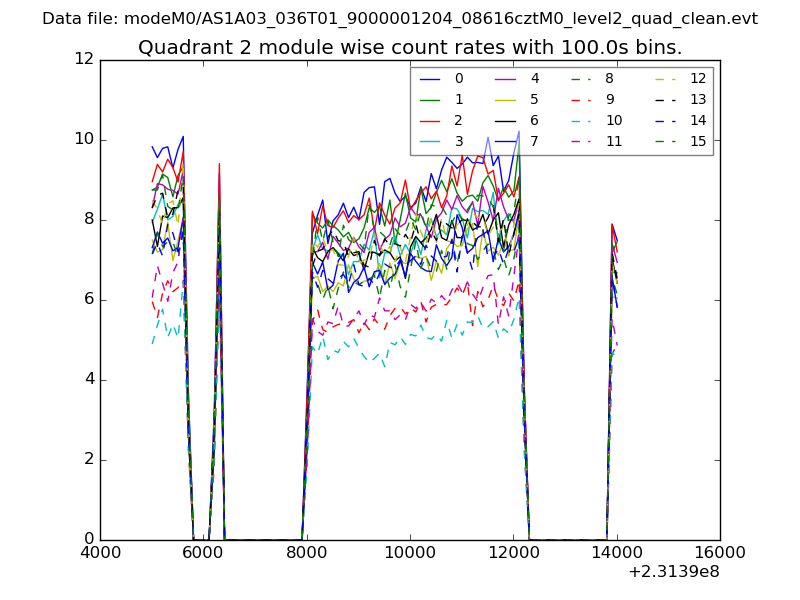
| Module-wise count rates for Quadrant B Data is divided into 100 sec bins |
 |
 |
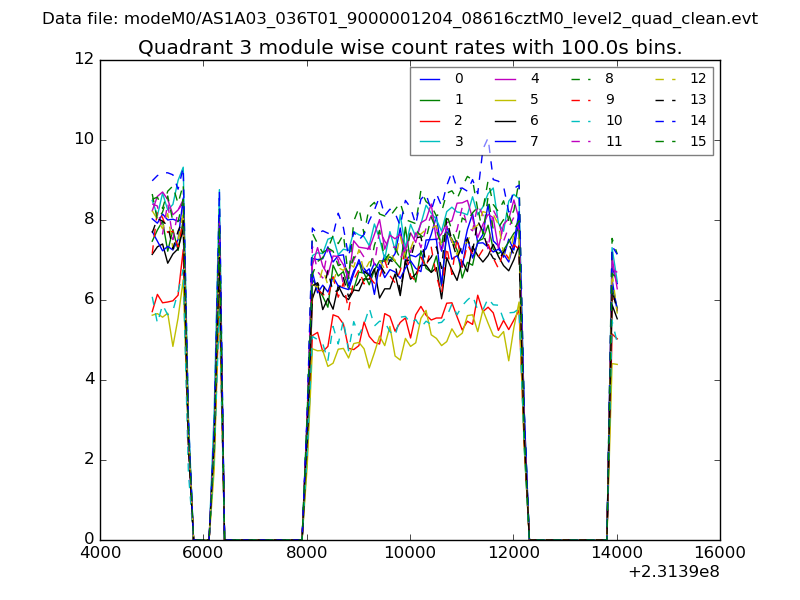
| Module-wise count rates for Quadrant C Data is divided into 100 sec bins |
 |
 |
| Module-wise count rates for Quadrant D Data is divided into 100 sec bins |
 |
 |
| Parameter | Plot |
|---|---|
| CZT HV Monitor | 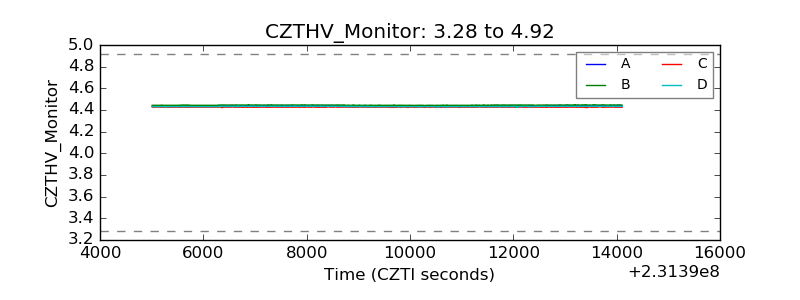 |
| D_VDD | 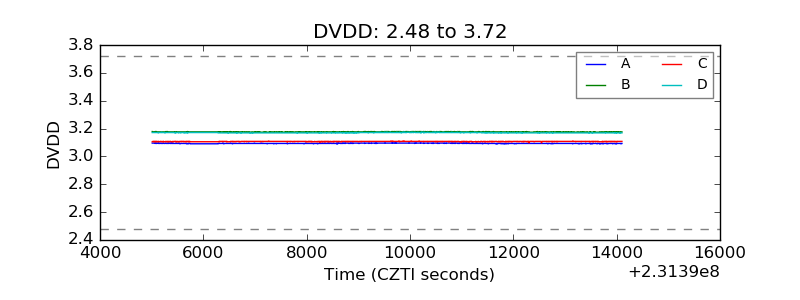 |
| Temperature 1 | 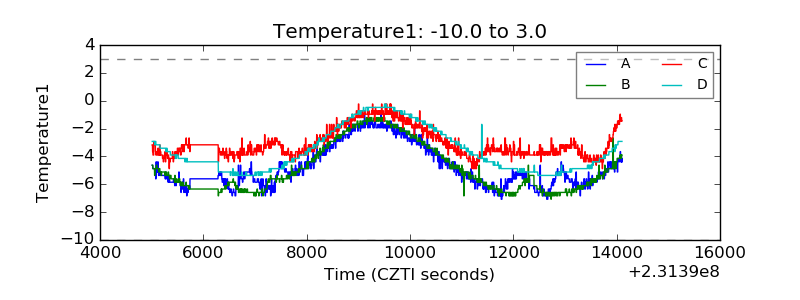 |
| Veto HV Monitor | 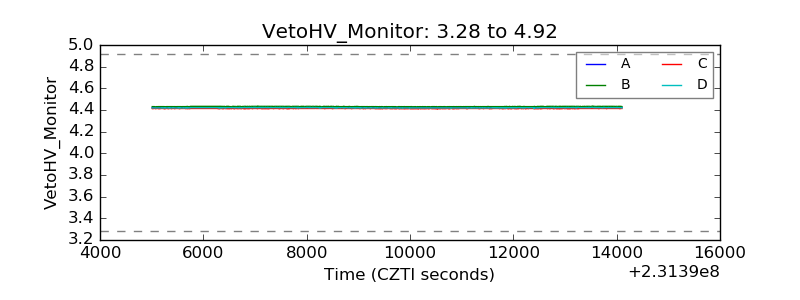 |
| Veto LLD | 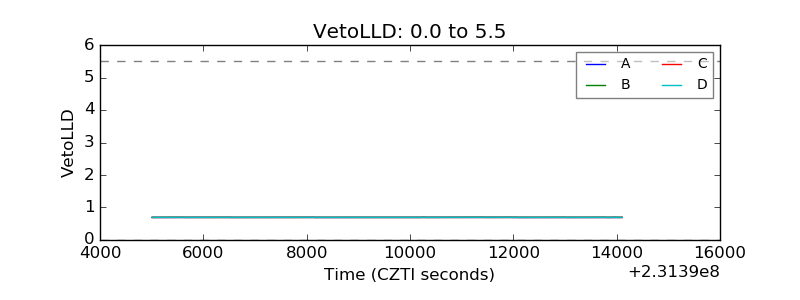 |
| Alpha Counter | 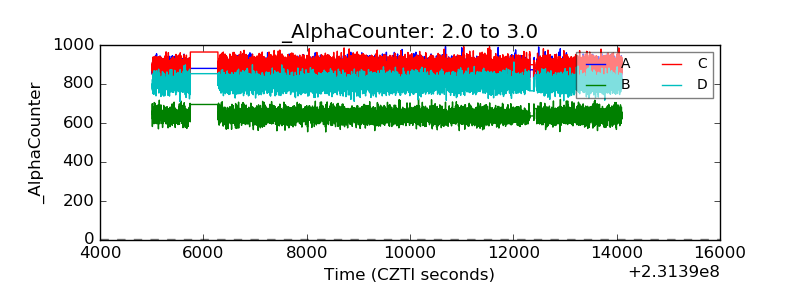 |
| _CPM_Rate |  |
| CZT Counter | 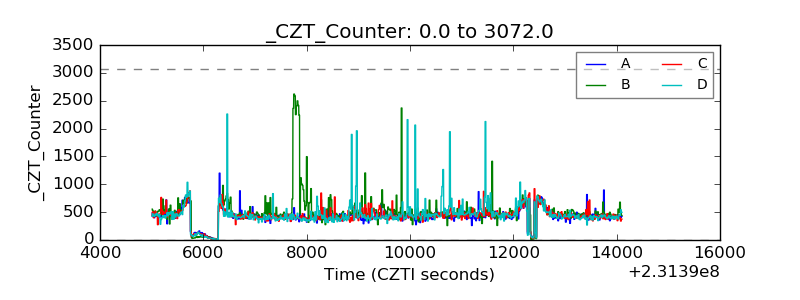 |
| +2.5 Volts monitor |  |
| +5 Volts monitor |  |
| _ROLL_ROT | 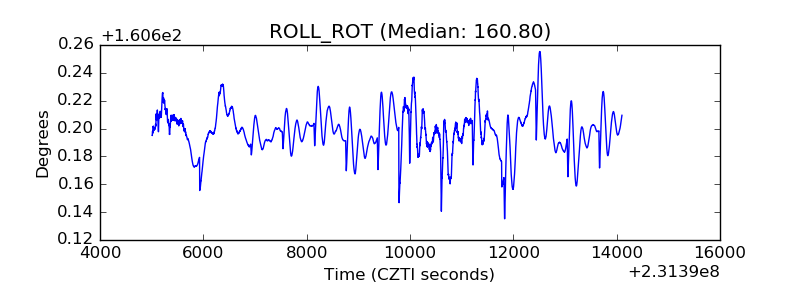 |
| _Roll_DEC |  |
| _Roll_RA | 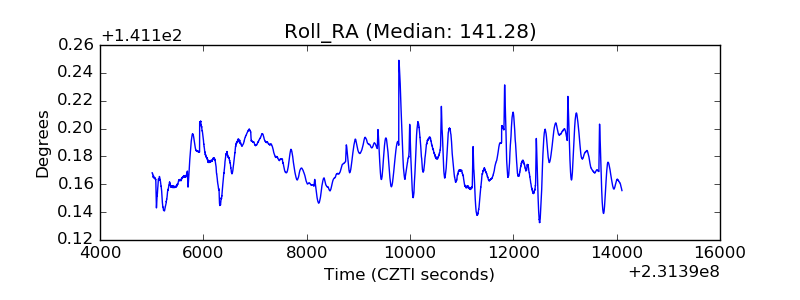 |
| Veto Counter | 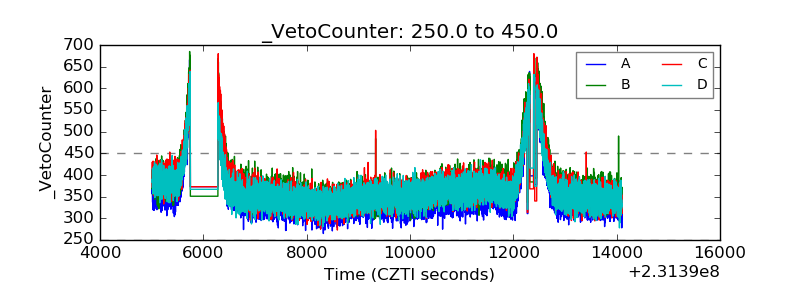 |