| Param | Original file | Final file |
|---|---|---|
| Filename | modeM0/AS1A03_036T01_9000001204_08617cztM0_level2.evt | modeM0/AS1A03_036T01_9000001204_08617cztM0_level2_quad_clean.evt |
| Size (bytes) | 503,576,640 | 90,273,600 |
| Size | 480.2 MB | 86.1 MB |
| Events in quadrant A | 3,600,159 | 553,352 |
| Events in quadrant B | 3,878,721 | 563,836 |
| Events in quadrant C | 3,434,244 | 551,011 |
| Events in quadrant D | 3,812,080 | 527,783 |
| Mode M0 | |||
|---|---|---|---|
| Quadrant | BADHDUFLAG | Total packets | Discarded packets |
| A | 0 | 16187 | 5 |
| B | 0 | 16663 | 1 |
| C | 0 | 15929 | 1 |
| D | 0 | 17011 | 1 |
| Mode M9 | |||
|---|---|---|---|
| Quadrant | BADHDUFLAG | Total packets | Discarded packets |
| A | 0 | 2 | 0 |
| B | 0 | 2 | 0 |
| C | 0 | 2 | 0 |
| D | 0 | 2 | 0 |
| Mode SS | |||
|---|---|---|---|
| Quadrant | BADHDUFLAG | Total packets | Discarded packets |
| A | 0 | 156 | 0 |
| B | 0 | 156 | 0 |
| C | 0 | 156 | 0 |
| D | 0 | 156 | 0 |
| Quadrant | Total seconds | Saturated seconds | Saturation percentage |
|---|---|---|---|
| A | 7734 | 201 | 2.598914% |
| B | 7735 | 263 | 3.400129% |
| C | 7735 | 134 | 1.732385% |
| D | 7735 | 203 | 2.624434% |
Noise dominated data is calculated using 1-second bins in cleaned event files. If a bin has >2000 counts, and if more than 50% of those come from <1% of pixels, then it is considered to be noise-dominated and hence unusable.
| Quadrant | # 1 sec bins | Bins with >0 counts | Bins with >2000 counts | High rate bins dominated by noise | Noise dominated (total time) | Noise dominated (detector-on time) | Marked lightcurve |
|---|---|---|---|---|---|---|---|
| A | 7885 | 7736 | 0 | 0 | 0.00% | 0.00% | 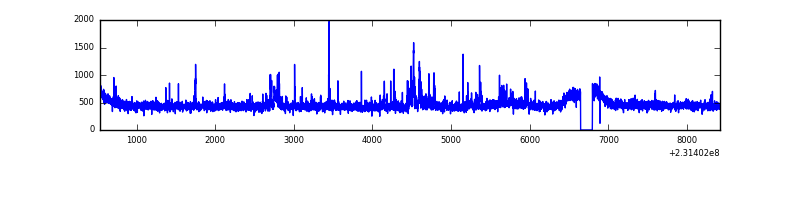 |
| B | 7885 | 7736 | 29 | 29 | 0.37% | 0.37% | 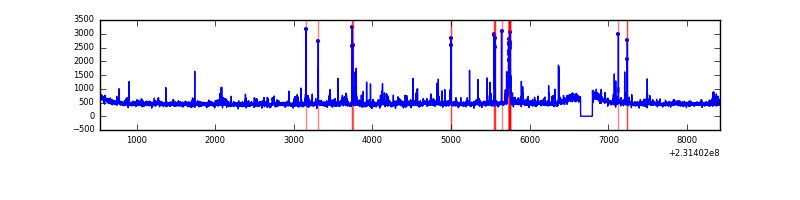 |
| C | 7885 | 7736 | 0 | 0 | 0.00% | 0.00% | 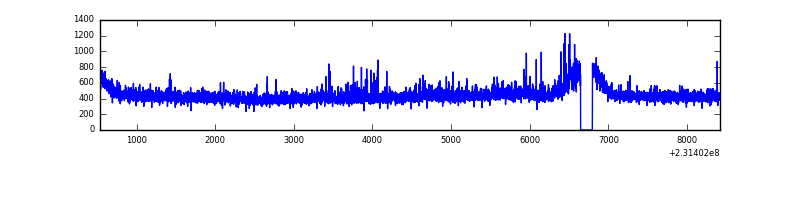 |
| D | 7885 | 7735 | 45 | 45 | 0.57% | 0.58% |  |
Top three noisy pixels from each quadrant. If the there are fewer than three noisy pixels in the level2.evt file, extra rows are filled as -1
| Pixel properties | Quadrant properties | ||||||
|---|---|---|---|---|---|---|---|
| Quadrant | DetID | PixID | Counts | Sigma | Mean | Median | Sigma |
| A | 5 | 112 | 142837 | 780.43 | 884 | 862 | 181.9 |
| A | 8 | 5 | 32246 | 172.52 | 884 | 862 | 181.9 |
| A | 15 | 174 | 17999 | 94.2 | 884 | 862 | 181.9 |
| B | 0 | 214 | 93124 | 543.4 | 893 | 869 | 169.8 |
| B | 10 | 252 | 62479 | 362.89 | 893 | 869 | 169.8 |
| B | 10 | 246 | 62418 | 362.53 | 893 | 869 | 169.8 |
| C | 14 | 64 | 53071 | 261.4 | 864 | 866 | 199.7 |
| C | 13 | 61 | 6438 | 27.9 | 864 | 866 | 199.7 |
| C | 8 | 222 | 5204 | 21.72 | 864 | 866 | 199.7 |
| D | 7 | 71 | 201495 | 908.85 | 854 | 827 | 220.8 |
| D | 10 | 253 | 105914 | 475.95 | 854 | 827 | 220.8 |
| D | 1 | 52 | 77015 | 345.07 | 854 | 827 | 220.8 |
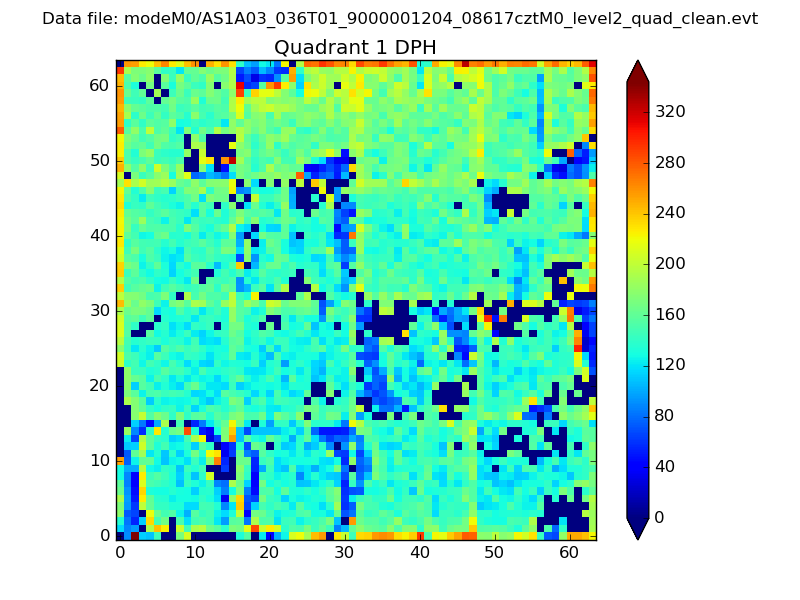
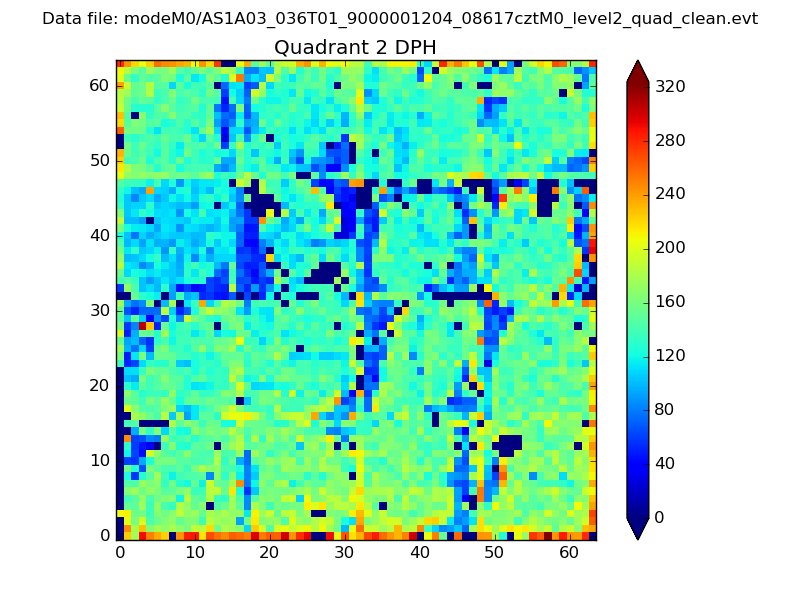
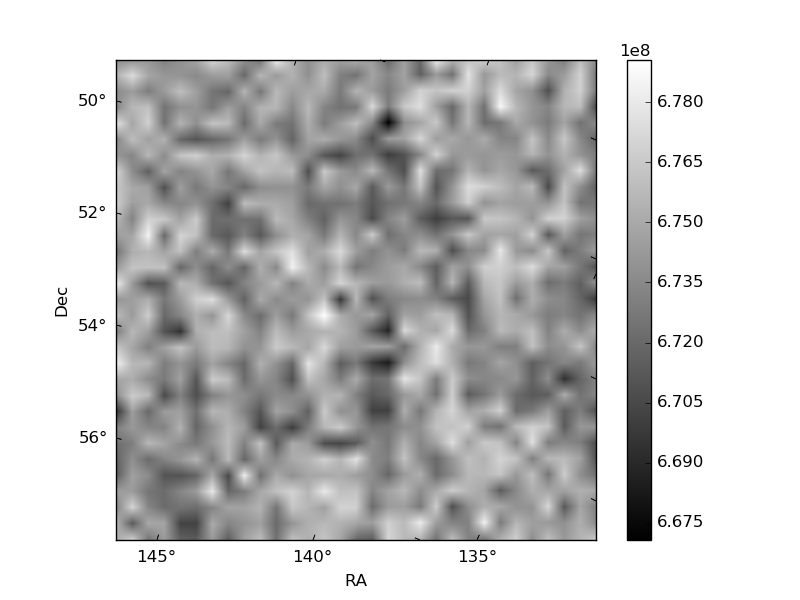
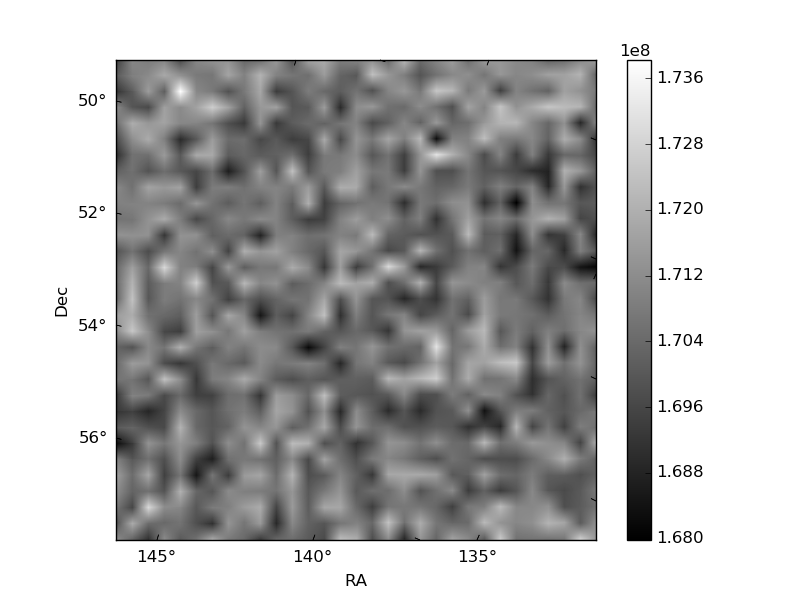
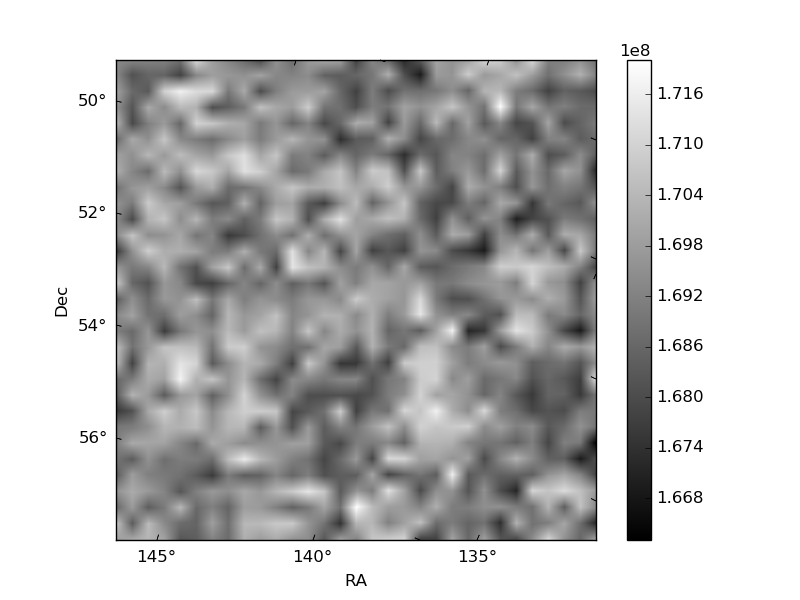
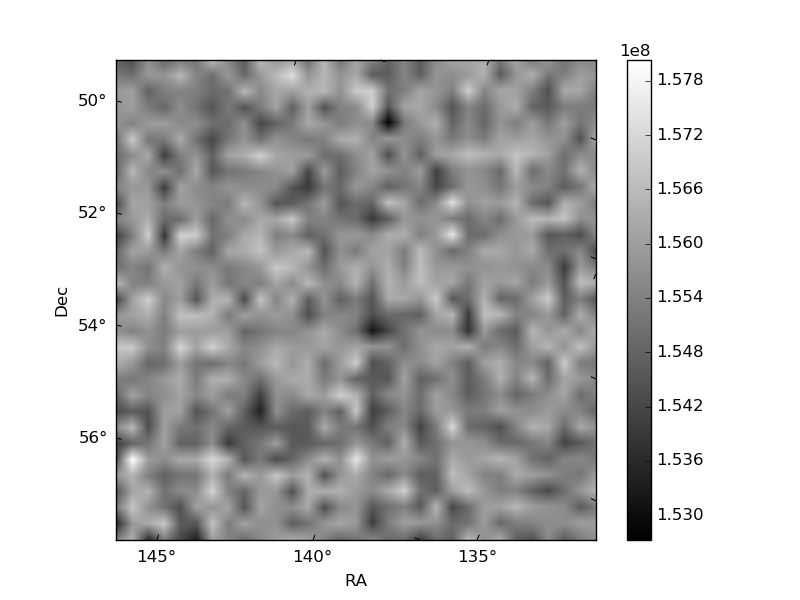
Histogram calculated using DETX and DETY for each event in the final _common_clean file
| Quadrant A | 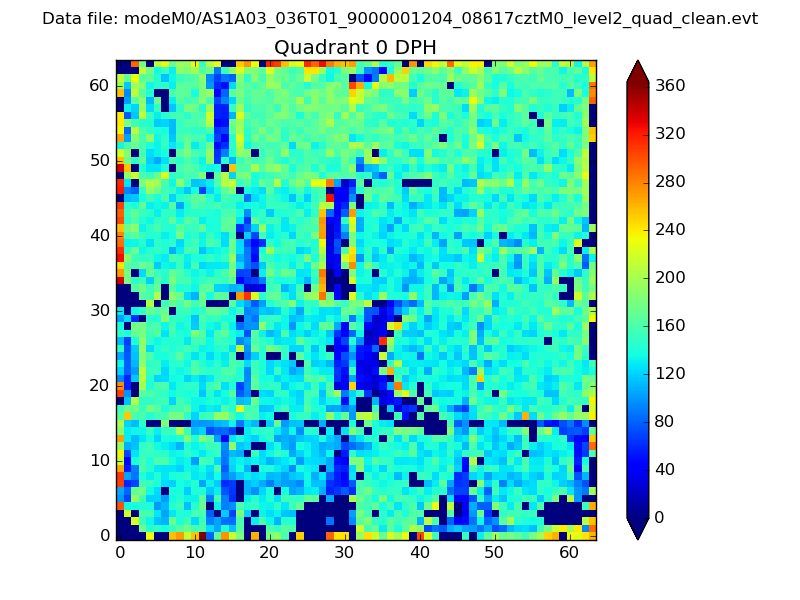 |
 |
Quadrant B |
|---|---|---|---|
| Quadrant D | 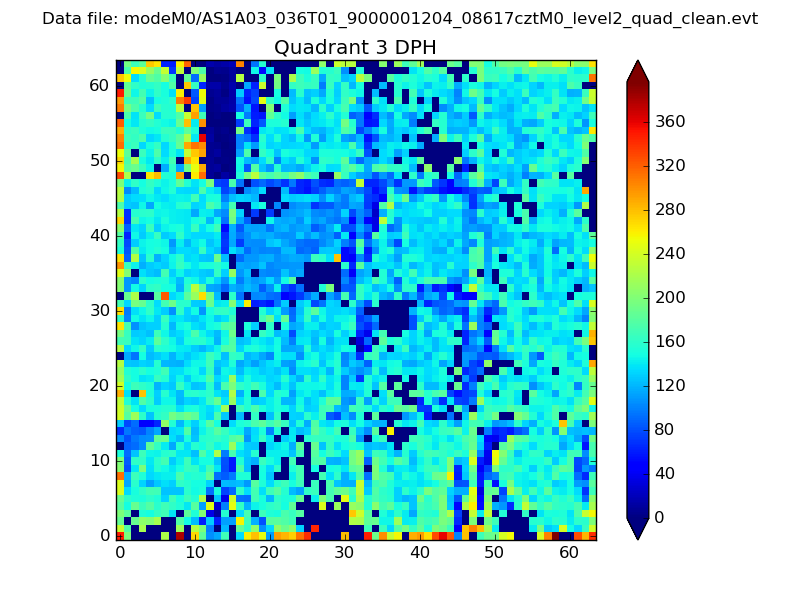 |
 |
Quadrant C |
| Plot type | Count rate plots | Images |
|---|---|---|
| Comparison with Poisson distribution Blue bars denote a histogram of data divided into 1 sec bins. Red curve is a Poisson curve with rate = median count rate of data. |
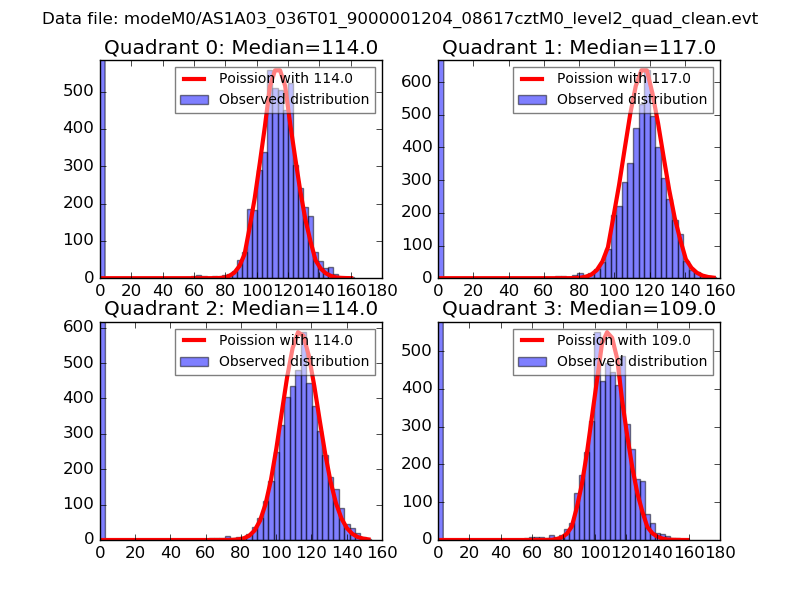 |
 |
| Quadrant-wise count rates Data is divided into 100 sec bins |
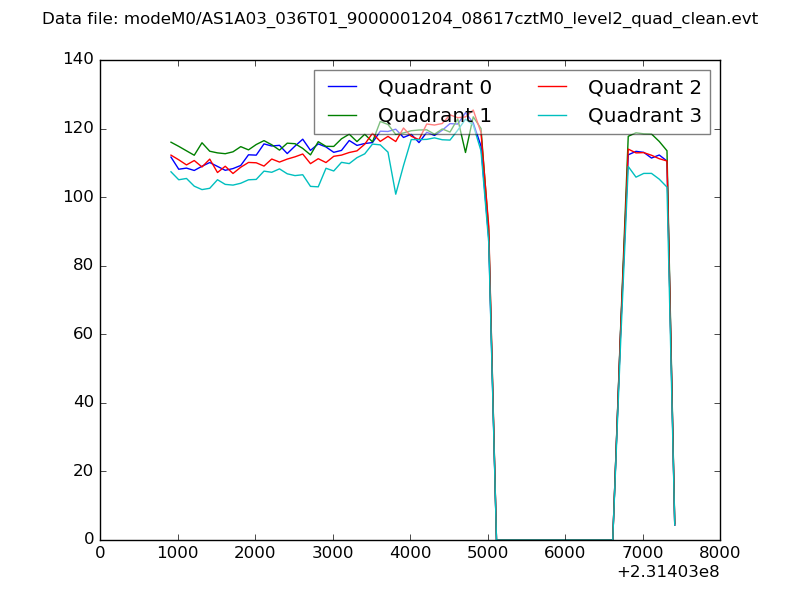 |
|
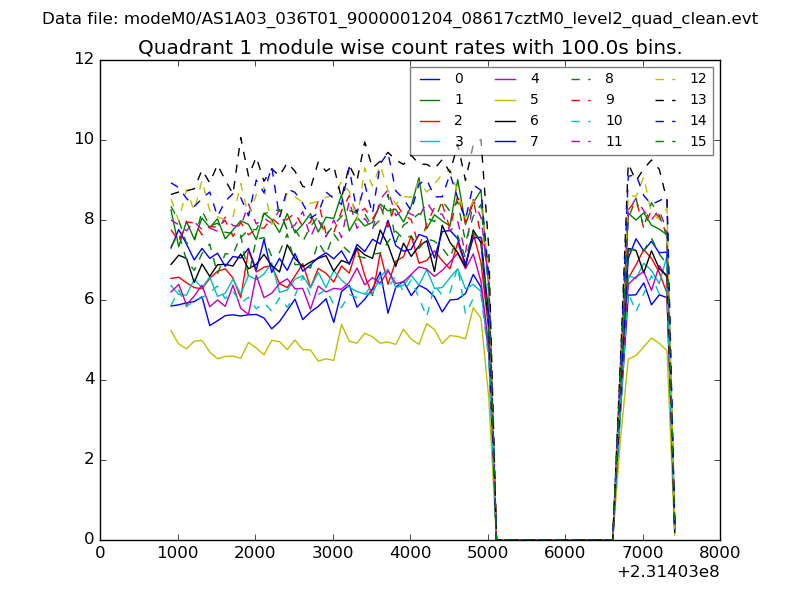
| Module-wise count rates for Quadrant A Data is divided into 100 sec bins |
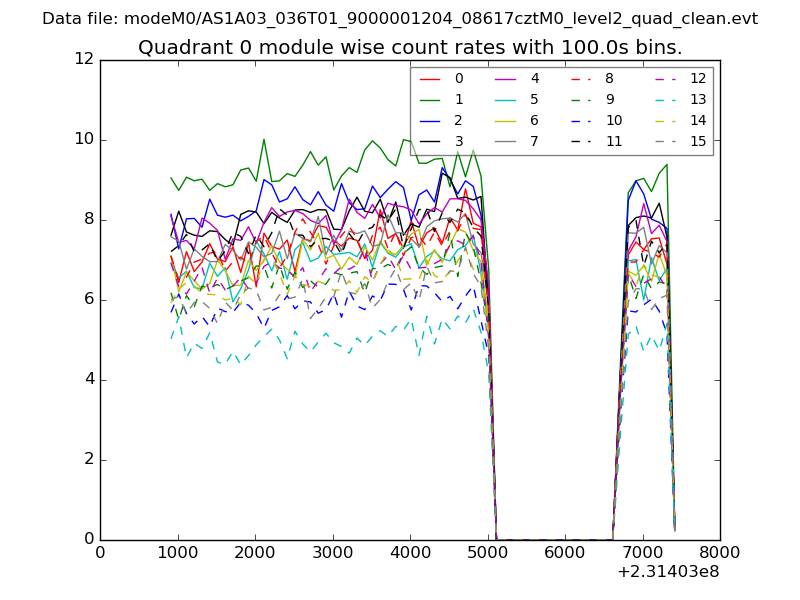 |
 |
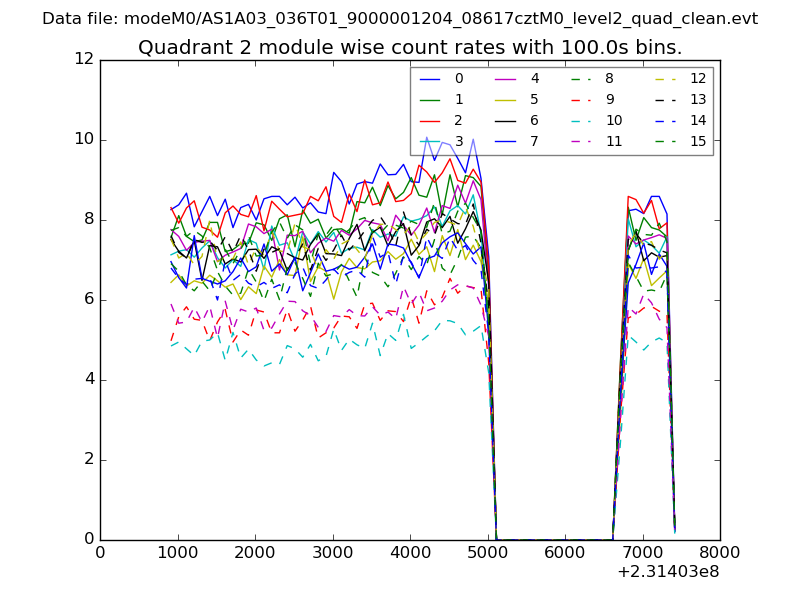
| Module-wise count rates for Quadrant B Data is divided into 100 sec bins |
 |
 |
| Module-wise count rates for Quadrant C Data is divided into 100 sec bins |
 |
 |
| Module-wise count rates for Quadrant D Data is divided into 100 sec bins |
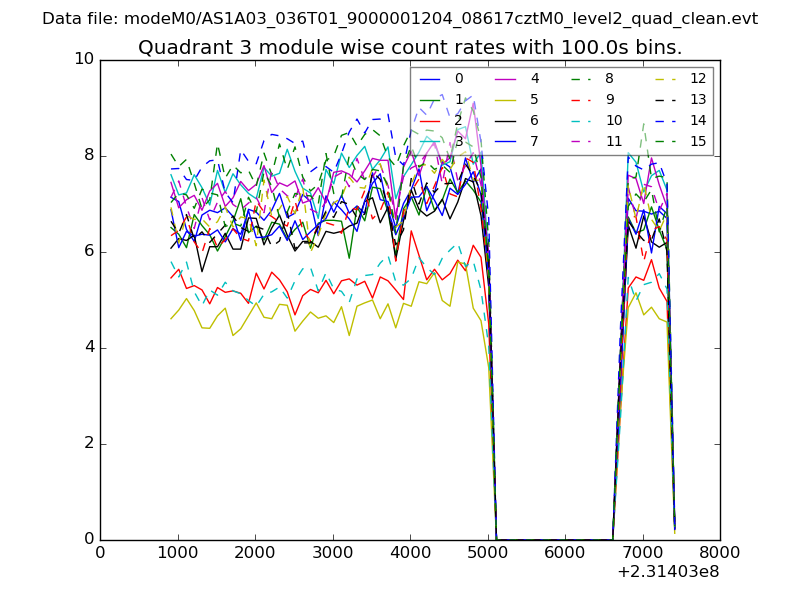 |
 |
| Parameter | Plot |
|---|---|
| CZT HV Monitor | 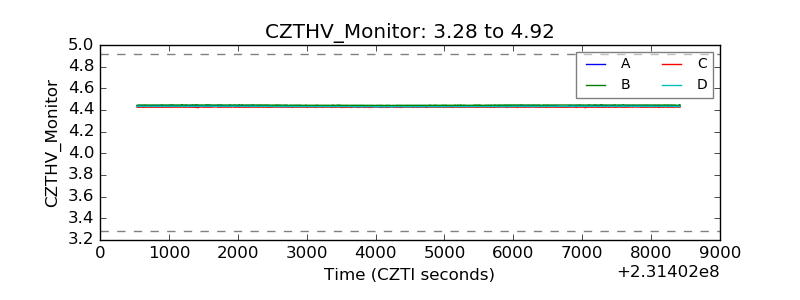 |
| D_VDD | 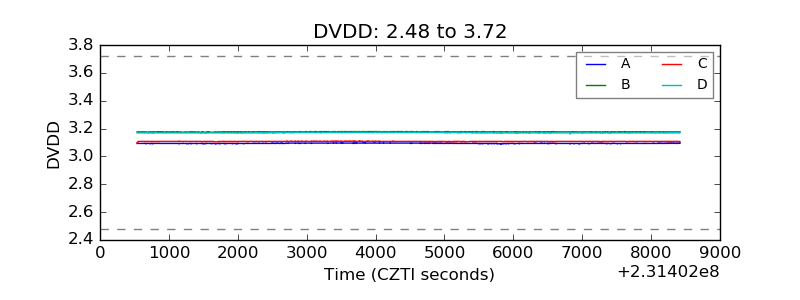 |
| Temperature 1 | 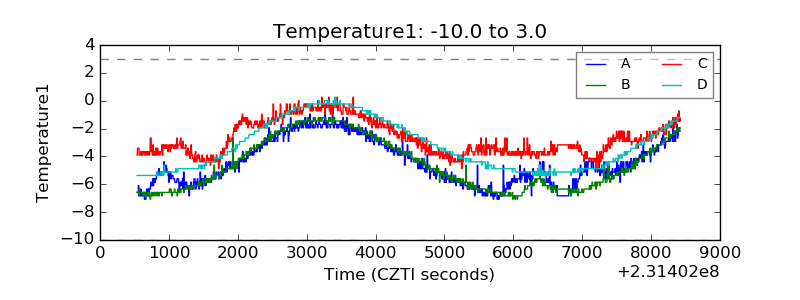 |
| Veto HV Monitor | 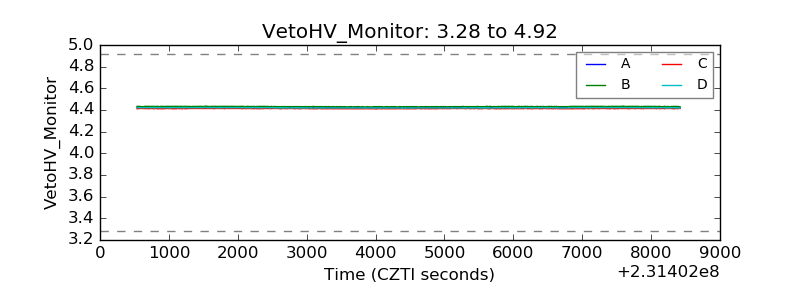 |
| Veto LLD | 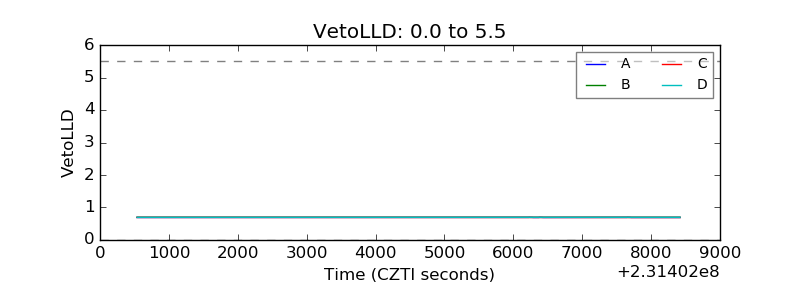 |
| Alpha Counter | 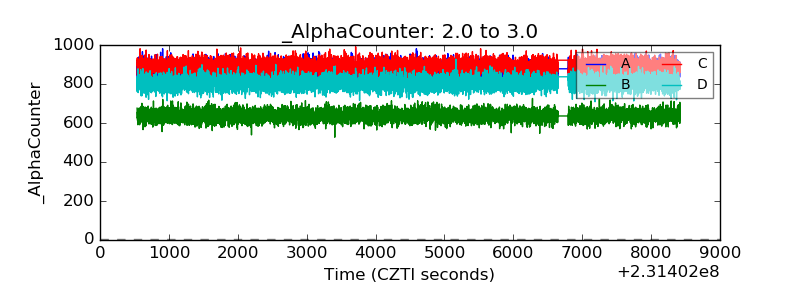 |
| _CPM_Rate | 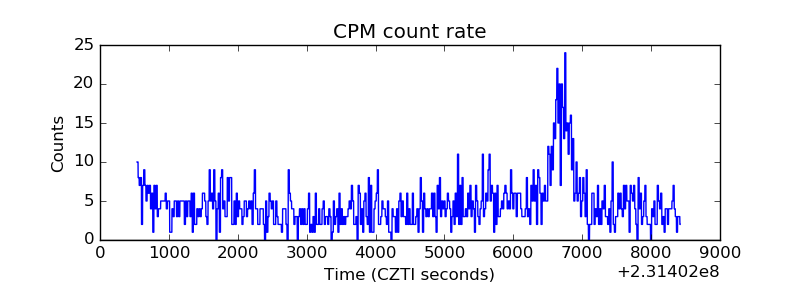 |
| CZT Counter | 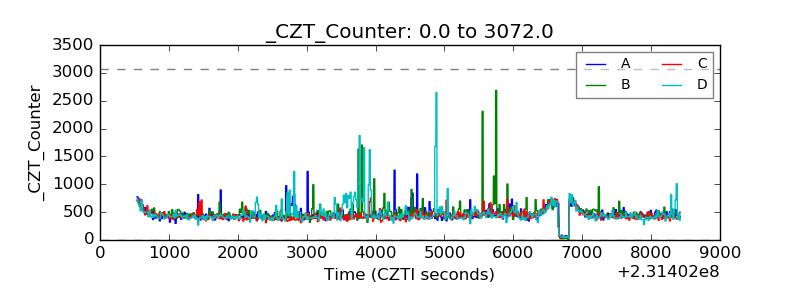 |
| +2.5 Volts monitor |  |
| +5 Volts monitor |  |
| _ROLL_ROT | 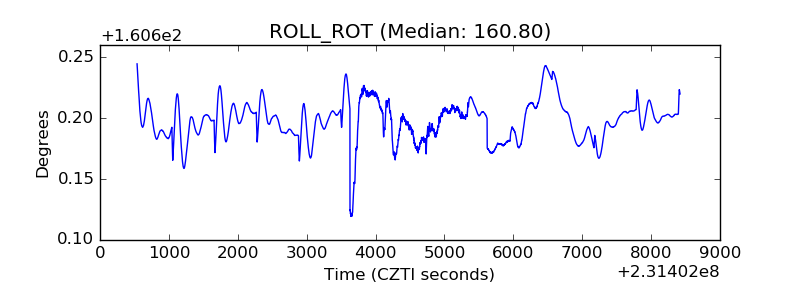 |
| _Roll_DEC | 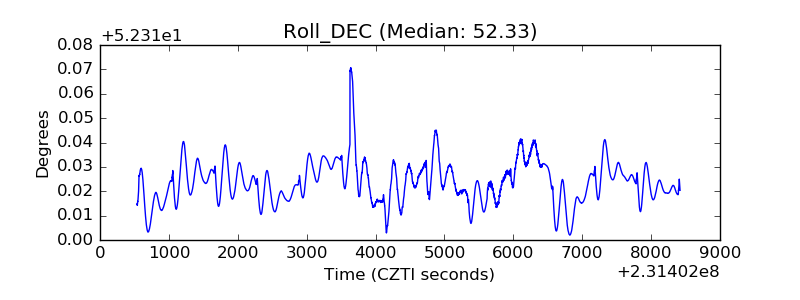 |
| _Roll_RA | 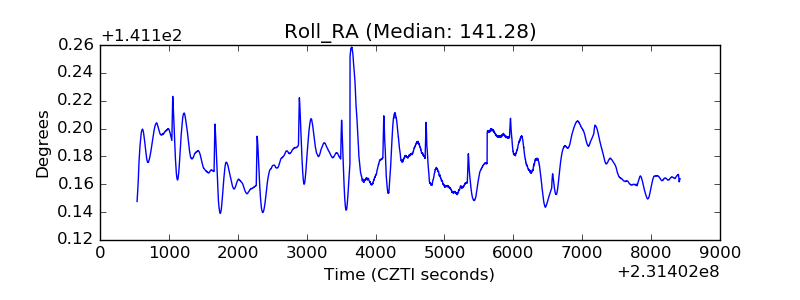 |
| Veto Counter | 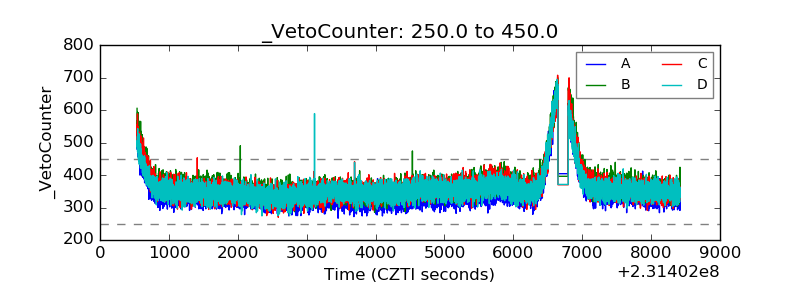 |