| Param | Original file | Final file |
|---|---|---|
| Filename | modeM0/AS1A03_036T01_9000001204_08620cztM0_level2.evt | modeM0/AS1A03_036T01_9000001204_08620cztM0_level2_quad_clean.evt |
| Size (bytes) | 943,508,160 | 206,712,000 |
| Size | 899.8 MB | 197.1 MB |
| Events in quadrant A | 6,295,447 | 1,342,660 |
| Events in quadrant B | 7,118,988 | 1,354,260 |
| Events in quadrant C | 6,147,351 | 1,325,713 |
| Events in quadrant D | 8,046,557 | 1,253,855 |
| Mode M0 | |||
|---|---|---|---|
| Quadrant | BADHDUFLAG | Total packets | Discarded packets |
| A | 0 | 29121 | 97 |
| B | 0 | 30772 | 98 |
| C | 0 | 28974 | 64 |
| D | 0 | 34414 | 85 |
| Mode M9 | |||
|---|---|---|---|
| Quadrant | BADHDUFLAG | Total packets | Discarded packets |
| A | 0 | 9 | 0 |
| B | 0 | 9 | 0 |
| C | 0 | 9 | 0 |
| D | 0 | 9 | 0 |
| Mode SS | |||
|---|---|---|---|
| Quadrant | BADHDUFLAG | Total packets | Discarded packets |
| A | 0 | 290 | 0 |
| B | 0 | 290 | 0 |
| C | 0 | 290 | 0 |
| D | 0 | 290 | 0 |
| Quadrant | Total seconds | Saturated seconds | Saturation percentage |
|---|---|---|---|
| A | 14241 | 174 | 1.221824% |
| B | 14247 | 187 | 1.312557% |
| C | 14258 | 104 | 0.729415% |
| D | 14261 | 592 | 4.151182% |
Noise dominated data is calculated using 1-second bins in cleaned event files. If a bin has >2000 counts, and if more than 50% of those come from <1% of pixels, then it is considered to be noise-dominated and hence unusable.
| Quadrant | # 1 sec bins | Bins with >0 counts | Bins with >2000 counts | High rate bins dominated by noise | Noise dominated (total time) | Noise dominated (detector-on time) | Marked lightcurve |
|---|---|---|---|---|---|---|---|
| A | 15269 | 14287 | 2 | 2 | 0.01% | 0.01% |  |
| B | 15269 | 14290 | 21 | 21 | 0.14% | 0.15% |  |
| C | 15269 | 14290 | 0 | 0 | 0.00% | 0.00% | 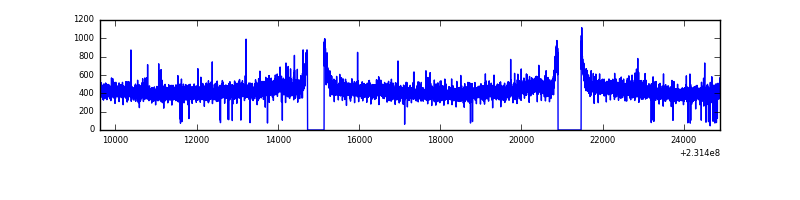 |
| D | 15269 | 14286 | 459 | 459 | 3.01% | 3.21% | 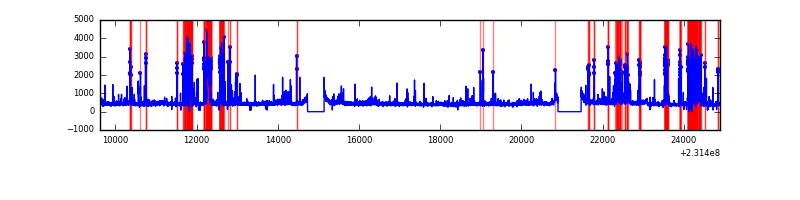 |
Top three noisy pixels from each quadrant. If the there are fewer than three noisy pixels in the level2.evt file, extra rows are filled as -1
| Pixel properties | Quadrant properties | ||||||
|---|---|---|---|---|---|---|---|
| Quadrant | DetID | PixID | Counts | Sigma | Mean | Median | Sigma |
| A | 8 | 5 | 111212 | 335.98 | 1596 | 1555 | 326.4 |
| A | 15 | 174 | 22893 | 65.38 | 1596 | 1555 | 326.4 |
| A | 0 | 226 | 15004 | 41.21 | 1596 | 1555 | 326.4 |
| B | 0 | 214 | 231398 | 744.67 | 1605 | 1563 | 308.6 |
| B | 0 | 219 | 190272 | 611.42 | 1605 | 1563 | 308.6 |
| B | 10 | 246 | 180232 | 578.89 | 1605 | 1563 | 308.6 |
| C | 14 | 64 | 52012 | 140.01 | 1556 | 1555 | 360.4 |
| C | 13 | 61 | 11701 | 28.15 | 1556 | 1555 | 360.4 |
| C | 8 | 222 | 10674 | 25.3 | 1556 | 1555 | 360.4 |
| D | 10 | 253 | 1262289 | 3107.82 | 1520 | 1483 | 405.7 |
| D | 13 | 105 | 331658 | 813.86 | 1520 | 1483 | 405.7 |
| D | 13 | 122 | 124729 | 303.79 | 1520 | 1483 | 405.7 |
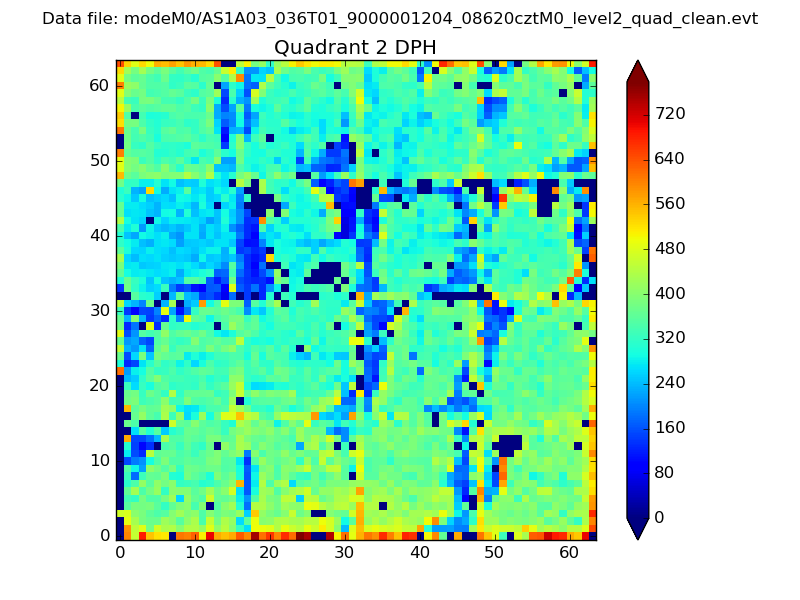
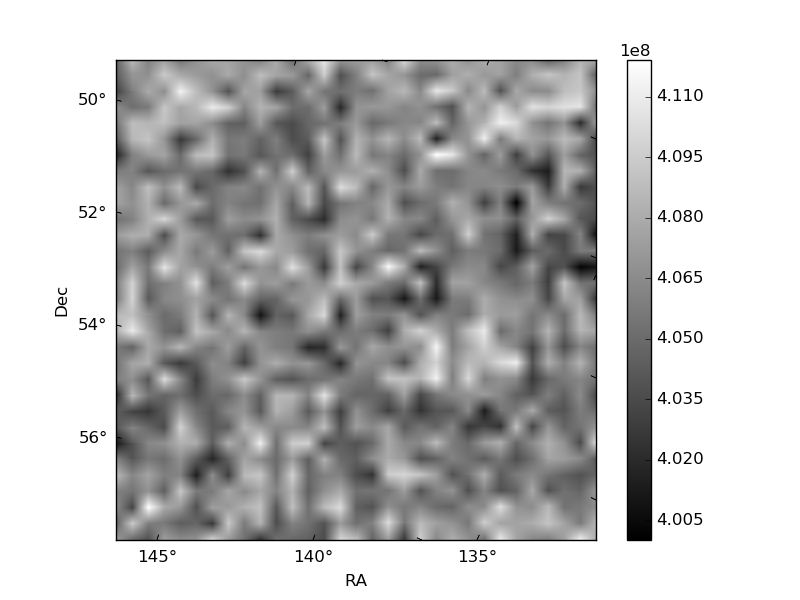
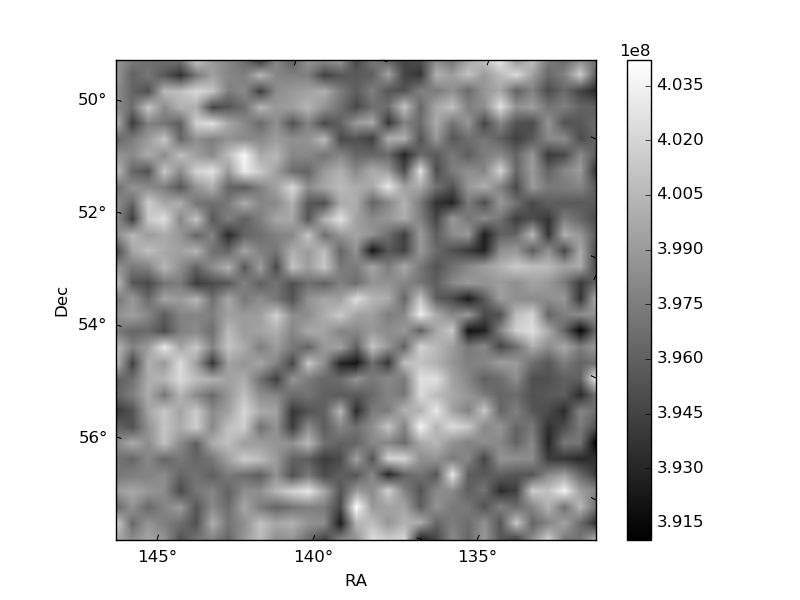
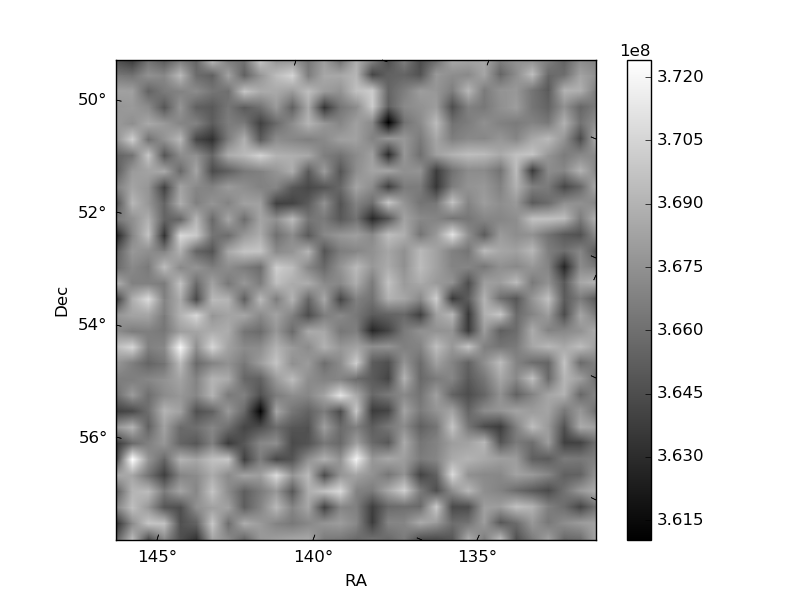
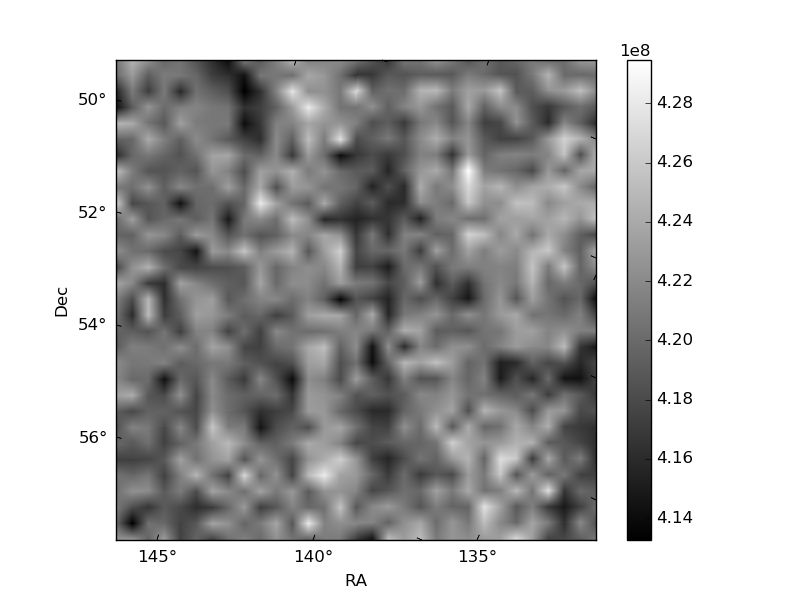
Histogram calculated using DETX and DETY for each event in the final _common_clean file
| Quadrant A | 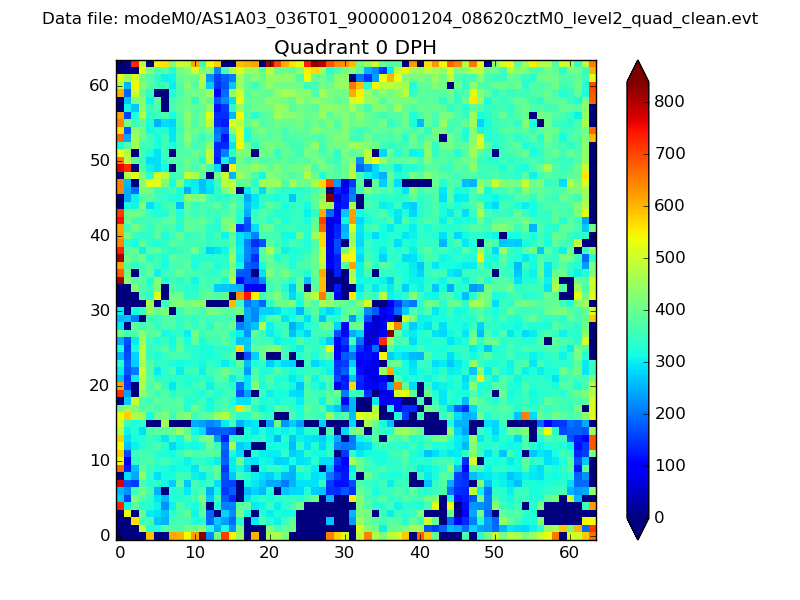 |
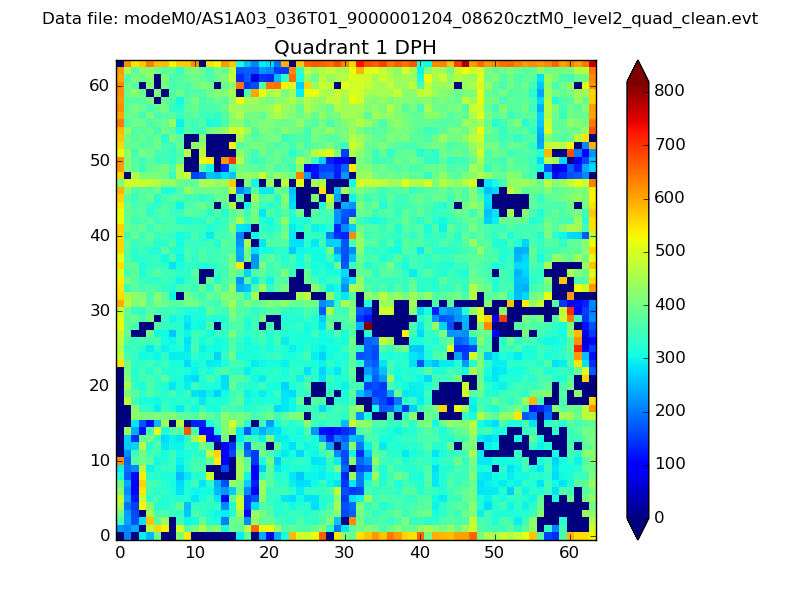 |
Quadrant B |
|---|---|---|---|
| Quadrant D |  |
 |
Quadrant C |
| Plot type | Count rate plots | Images |
|---|---|---|
| Comparison with Poisson distribution Blue bars denote a histogram of data divided into 1 sec bins. Red curve is a Poisson curve with rate = median count rate of data. |
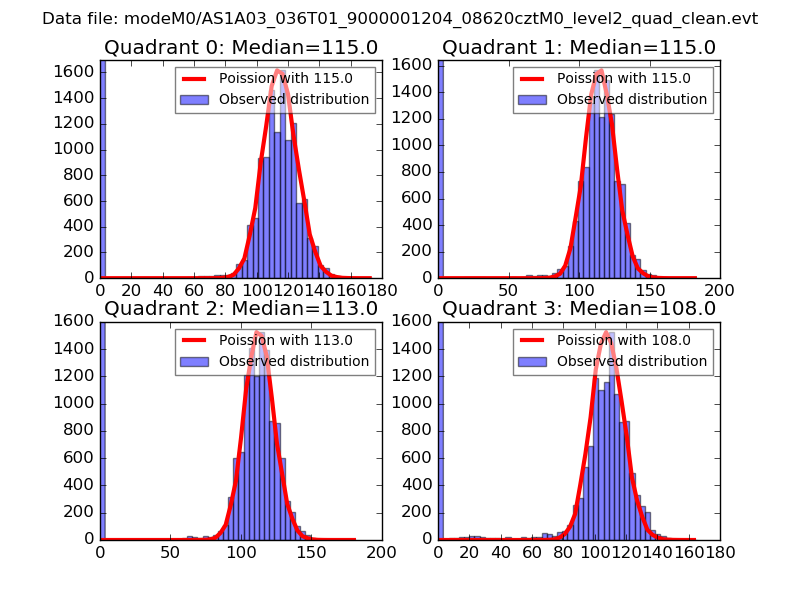 |
 |
| Quadrant-wise count rates Data is divided into 100 sec bins |
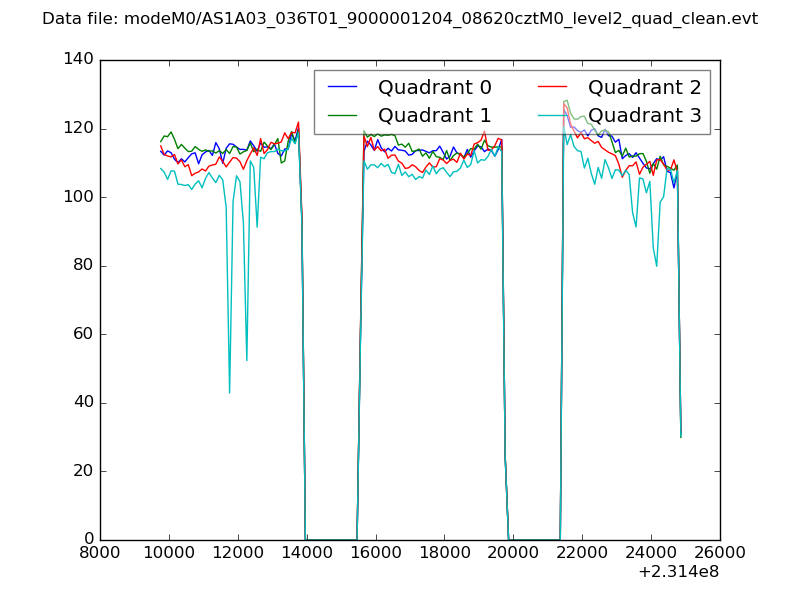 |
|
| Module-wise count rates for Quadrant A Data is divided into 100 sec bins |
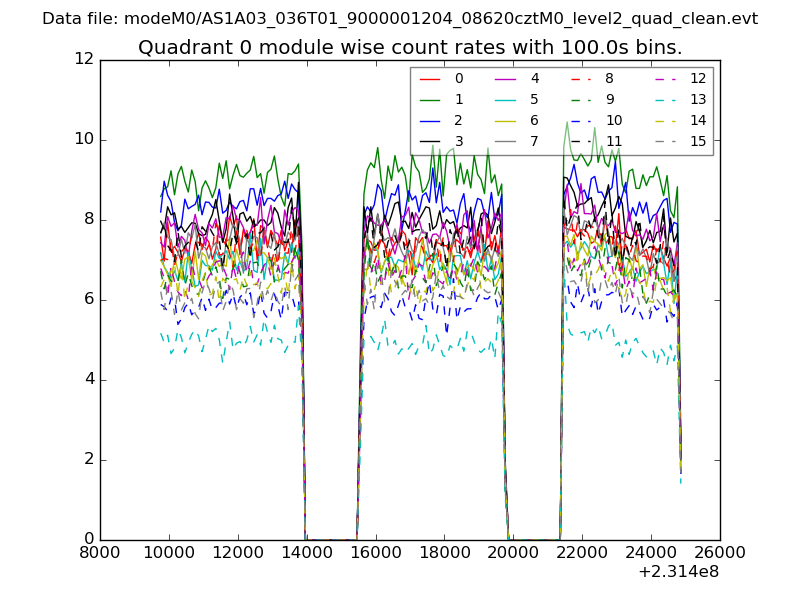 |
 |
| Module-wise count rates for Quadrant B Data is divided into 100 sec bins |
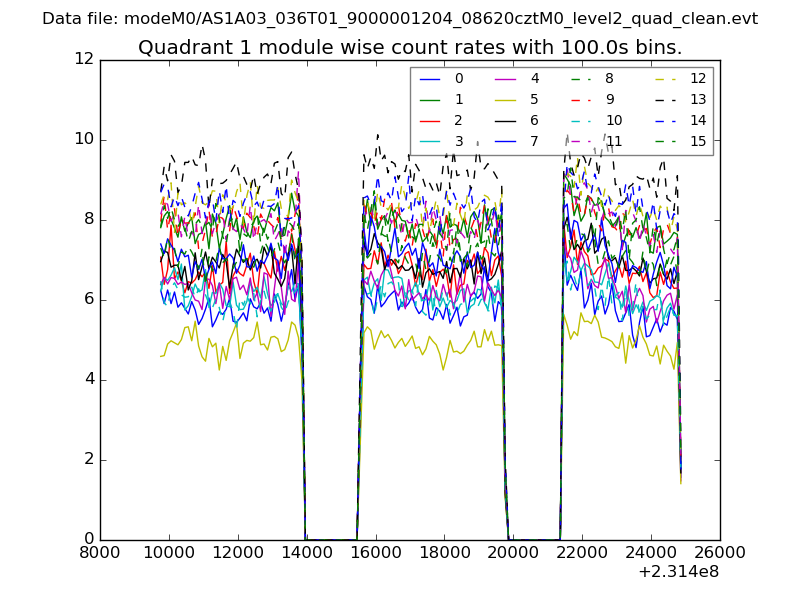 |
 |
| Module-wise count rates for Quadrant C Data is divided into 100 sec bins |
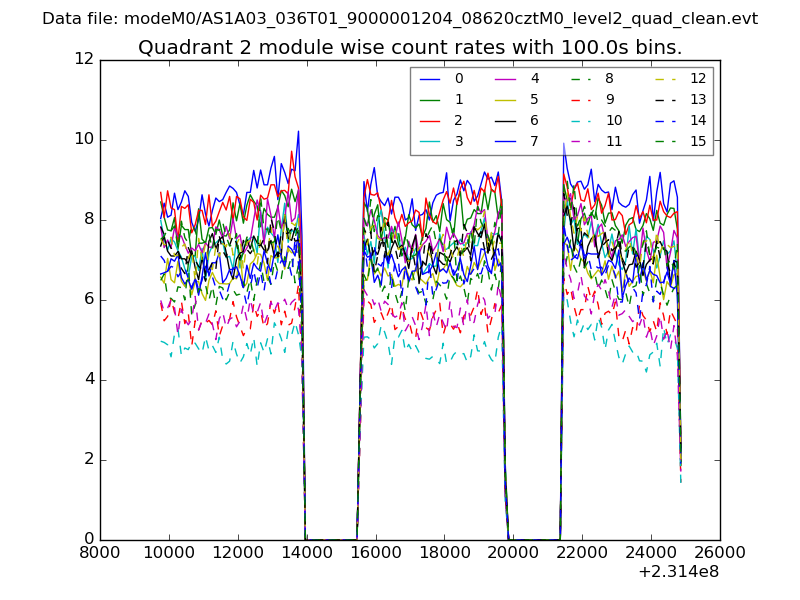 |
 |
| Module-wise count rates for Quadrant D Data is divided into 100 sec bins |
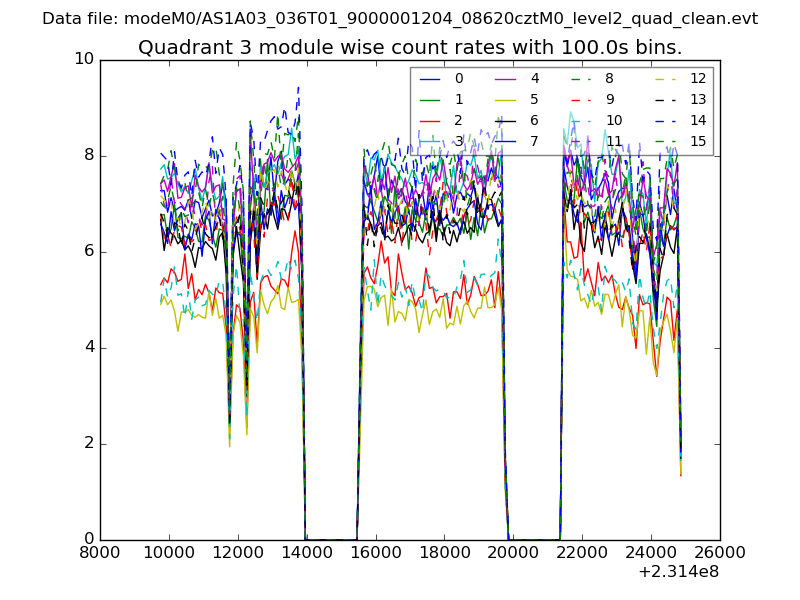 |
 |
| Parameter | Plot |
|---|---|
| CZT HV Monitor | 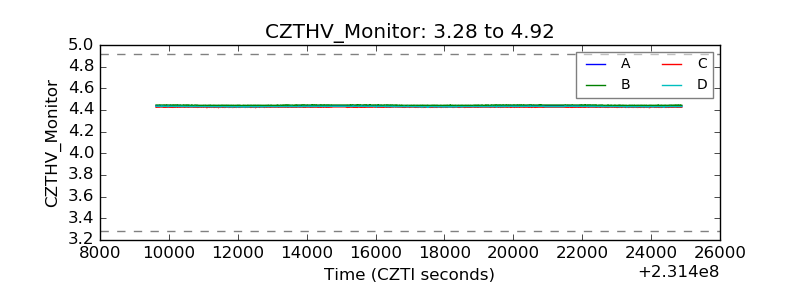 |
| D_VDD | 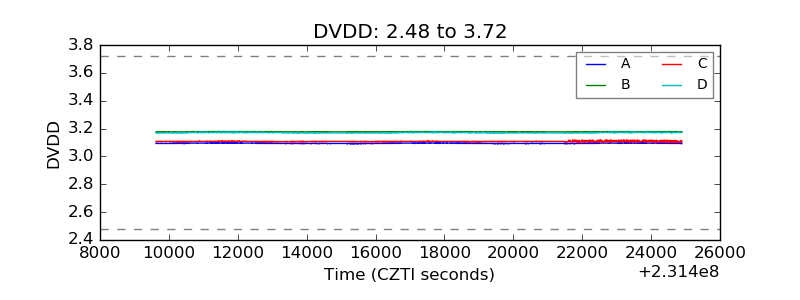 |
| Temperature 1 | 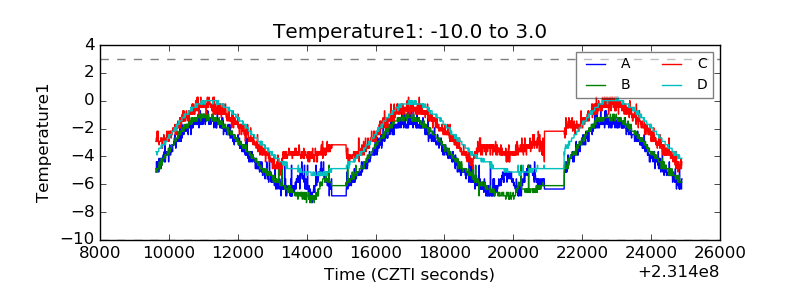 |
| Veto HV Monitor | 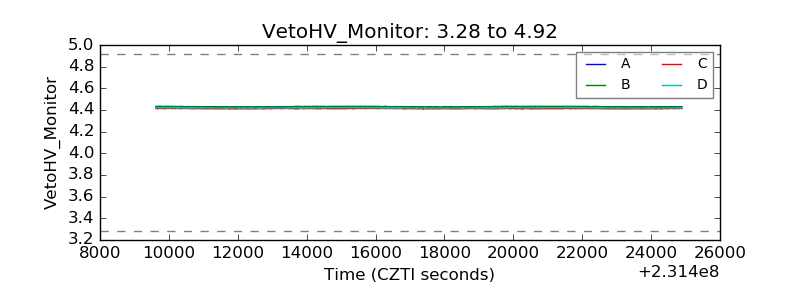 |
| Veto LLD | 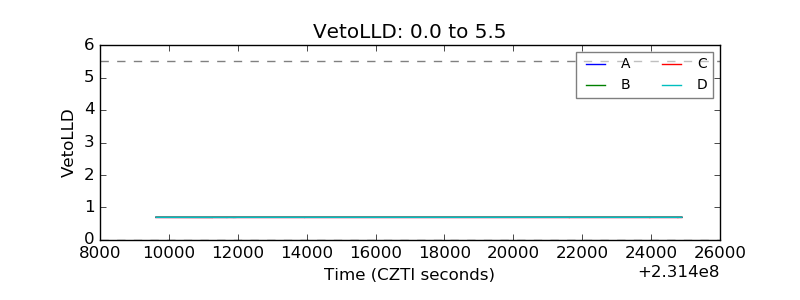 |
| Alpha Counter | 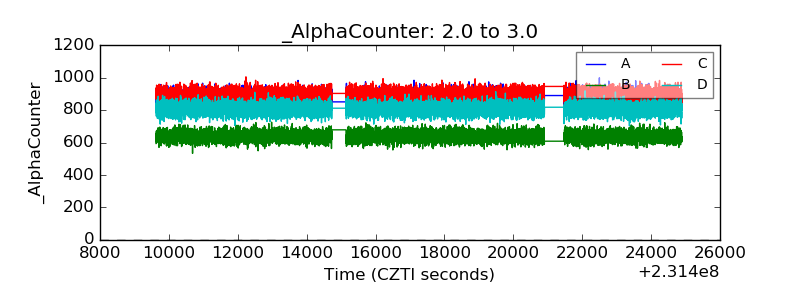 |
| _CPM_Rate | 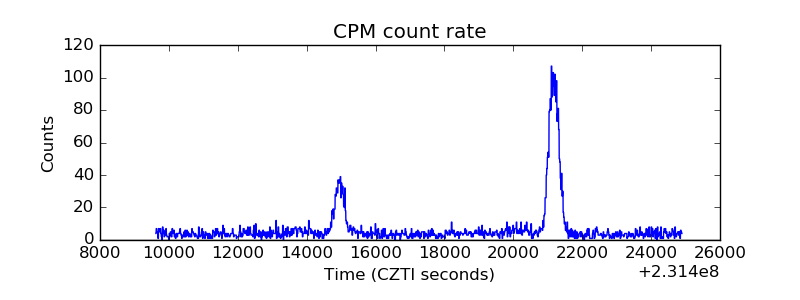 |
| CZT Counter | 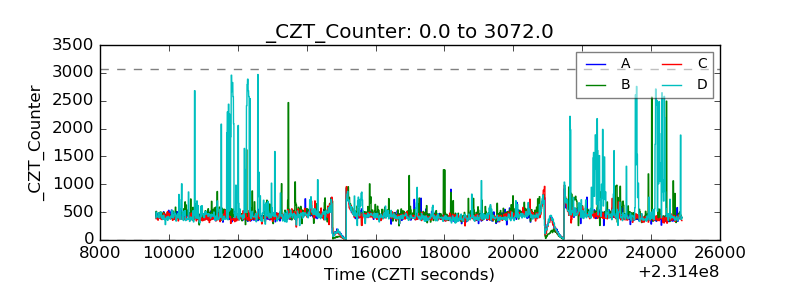 |
| +2.5 Volts monitor | 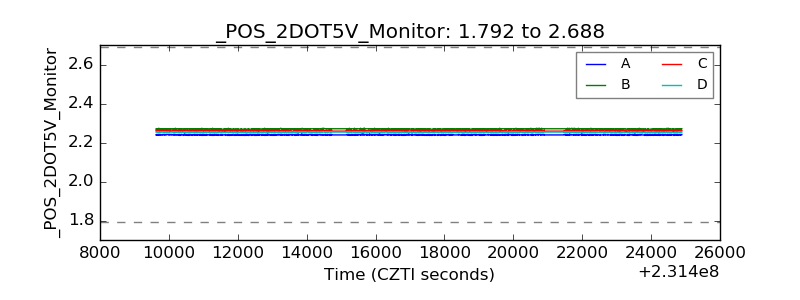 |
| +5 Volts monitor |  |
| _ROLL_ROT | 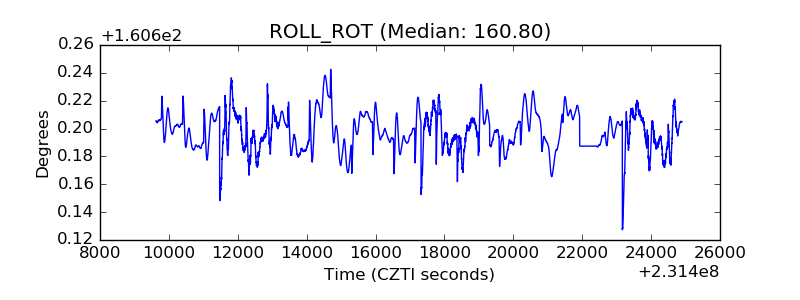 |
| _Roll_DEC | 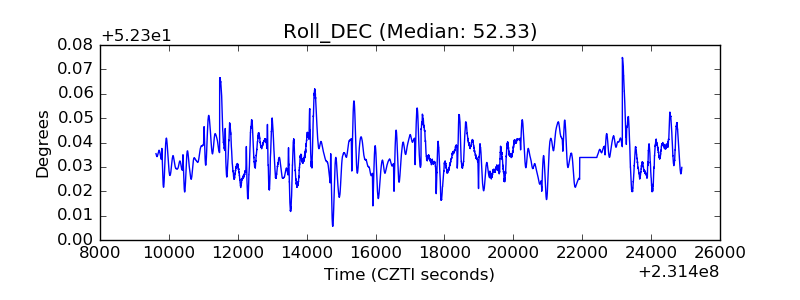 |
| _Roll_RA | 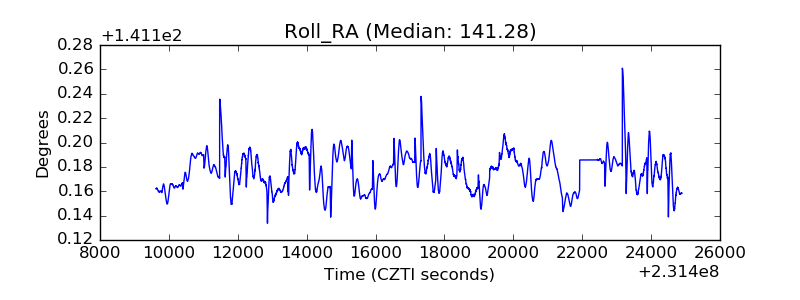 |
| Veto Counter | 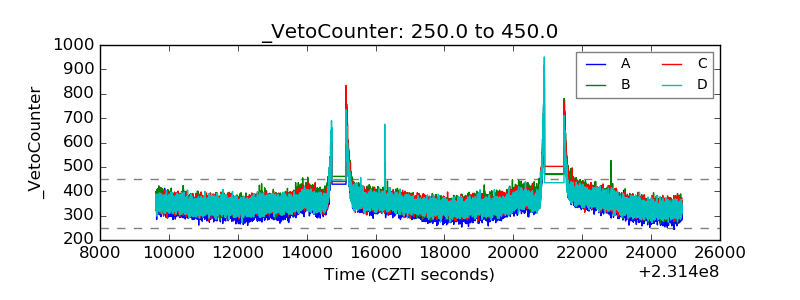 |