| Param | Original file | Final file |
|---|---|---|
| Filename | modeM0/AS1G07_024T01_9000001206cztM0_level2.fits | modeM0/AS1G07_024T01_9000001206cztM0_level2_quad_clean.evt |
| Size (bytes) | 3,018,386,880 | 4,788,446,400 |
| Size | 2.8 GB | 4.5 GB |
| Events in quadrant A | 17,268,508 | 30,795,719 |
| Events in quadrant B | 16,834,896 | 31,411,359 |
| Events in quadrant C | 17,227,310 | 30,096,887 |
| Events in quadrant D | 14,713,684 | 27,384,988 |
| Mode M0 | |||
|---|---|---|---|
| Quadrant | BADHDUFLAG | Total packets | Discarded packets |
| A | 0 | 765735 | 0 |
| B | 0 | 804643 | 0 |
| C | 0 | 794596 | 0 |
| D | 0 | 835678 | 0 |
| Mode M9 | |||
|---|---|---|---|
| Quadrant | BADHDUFLAG | Total packets | Discarded packets |
| A | 0 | 578 | 0 |
| B | 0 | 577 | 0 |
| C | 0 | 576 | 0 |
| D | 0 | 578 | 0 |
| Mode SS | |||
|---|---|---|---|
| Quadrant | BADHDUFLAG | Total packets | Discarded packets |
| A | 0 | 7604 | 0 |
| B | 0 | 7606 | 0 |
| C | 0 | 7604 | 0 |
| D | 0 | 7612 | 0 |
| Quadrant | Total seconds | Saturated seconds | Saturation percentage |
|---|---|---|---|
| A | 370101 | 3973 | 1.073491% |
| B | 370083 | 5950 | 1.607747% |
| C | 370052 | 5838 | 1.577616% |
| D | 370026 | 7798 | 2.107419% |
Noise dominated data is calculated using 1-second bins in cleaned event files. If a bin has >2000 counts, and if more than 50% of those come from <1% of pixels, then it is considered to be noise-dominated and hence unusable.
| Quadrant | # 1 sec bins | Bins with >0 counts | Bins with >2000 counts | High rate bins dominated by noise | Noise dominated (total time) | Noise dominated (detector-on time) | Marked lightcurve |
|---|---|---|---|---|---|---|---|
| A | 379980 | 322318 | 0 | 0 | 0.00% | 0.00% |  |
| B | 379996 | 322300 | 0 | 0 | 0.00% | 0.00% | 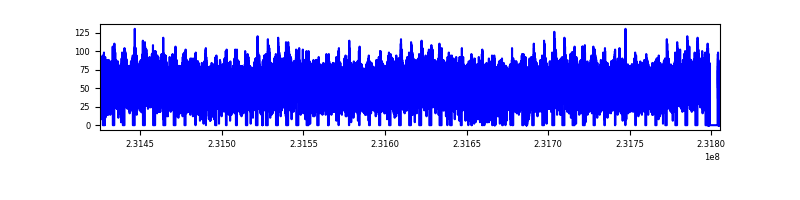 |
| C | 379995 | 322042 | 0 | 0 | 0.00% | 0.00% | 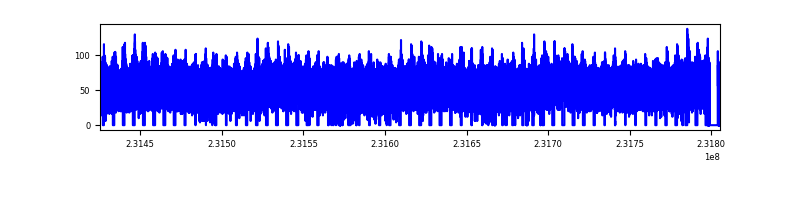 |
| D | 379996 | 322233 | 0 | 0 | 0.00% | 0.00% | 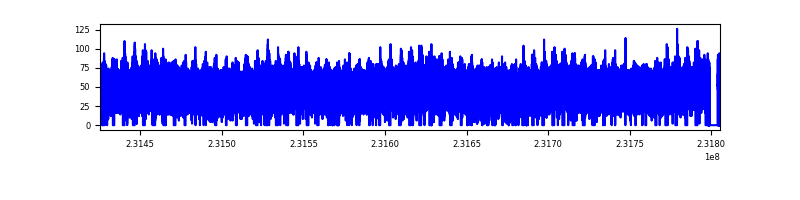 |
Top three noisy pixels from each quadrant. If the there are fewer than three noisy pixels in the level2.evt file, extra rows are filled as -1
| Pixel properties | Quadrant properties | ||||||
|---|---|---|---|---|---|---|---|
| Quadrant | DetID | PixID | Counts | Sigma | Mean | Median | Sigma |
| A | 0 | 29 | 16655 | 11.07 | 4497 | 4209 | 1124.6 |
| A | 7 | 110 | 14373 | 9.04 | 4497 | 4209 | 1124.6 |
| A | 0 | 30 | 13328 | 8.11 | 4497 | 4209 | 1124.6 |
| B | 2 | 9 | 14838 | 12.29 | 4456 | 4258 | 860.7 |
| B | 14 | 254 | 11485 | 8.4 | 4456 | 4258 | 860.7 |
| B | 12 | 226 | 11421 | 8.32 | 4456 | 4258 | 860.7 |
| C | 1 | 81 | 12958 | 7.41 | 4549 | 4239 | 1176.5 |
| C | 1 | 80 | 12923 | 7.38 | 4549 | 4239 | 1176.5 |
| C | 12 | 241 | 12253 | 6.81 | 4549 | 4239 | 1176.5 |
| D | 3 | 14 | 11301 | 6.77 | 4195 | 3814 | 1106.2 |
| D | 6 | 231 | 11062 | 6.55 | 4195 | 3814 | 1106.2 |
| D | 7 | 5 | 10468 | 6.02 | 4195 | 3814 | 1106.2 |
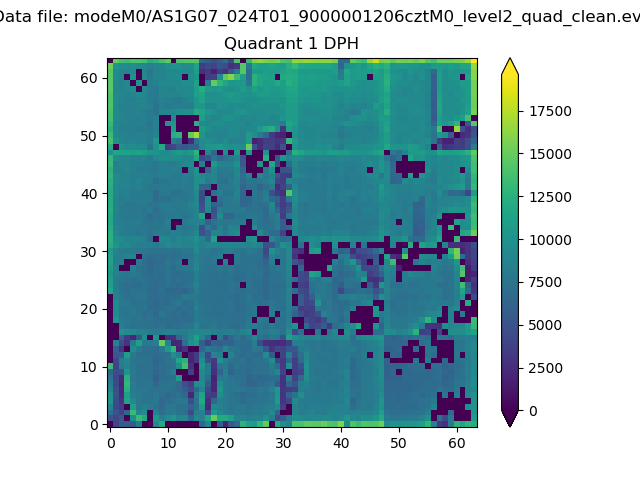
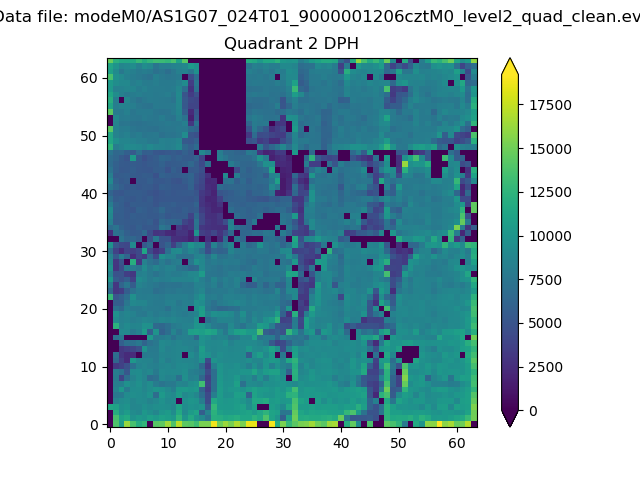
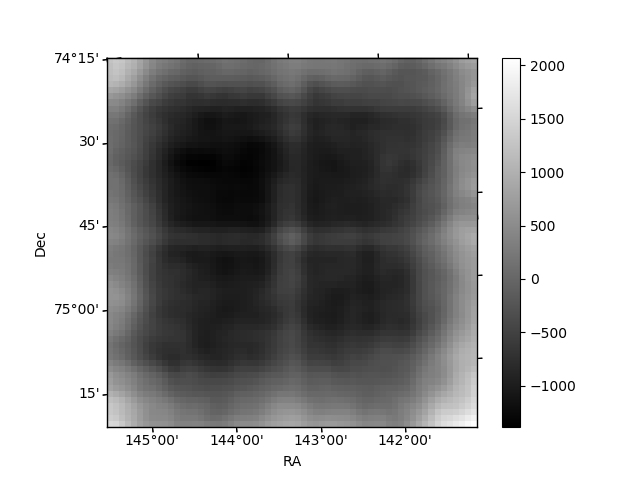
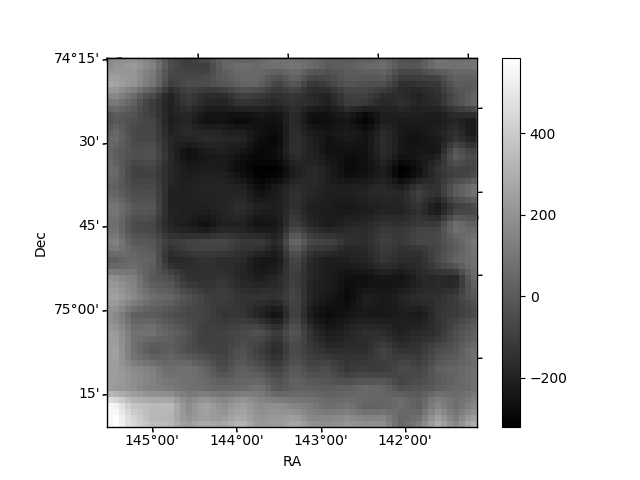
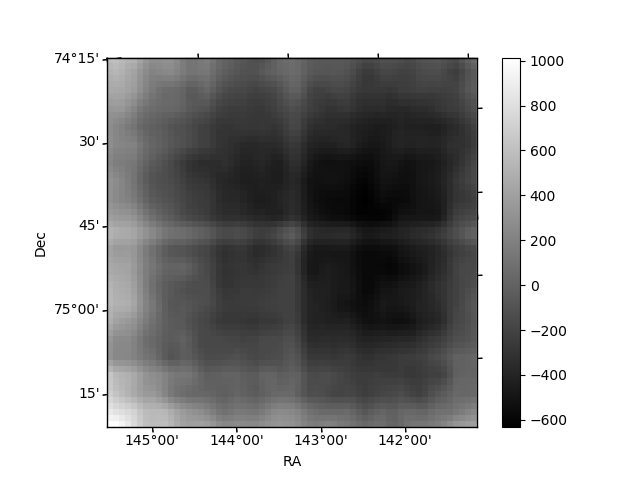
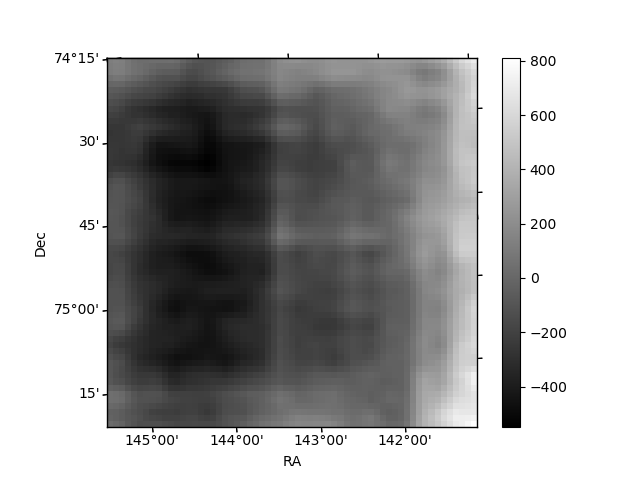
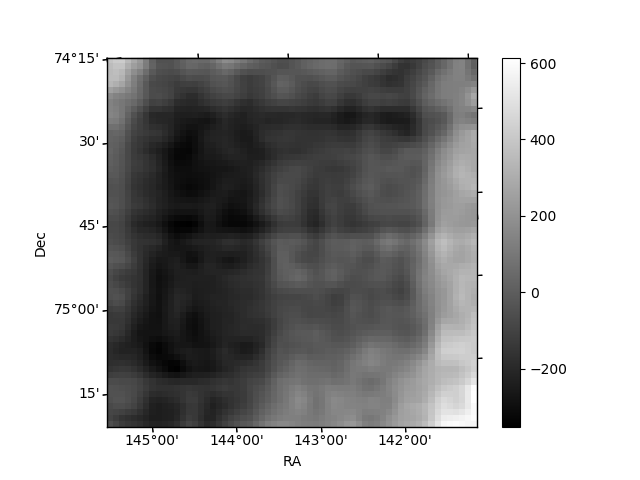
Histogram calculated using DETX and DETY for each event in the final _common_clean file
| Quadrant A | 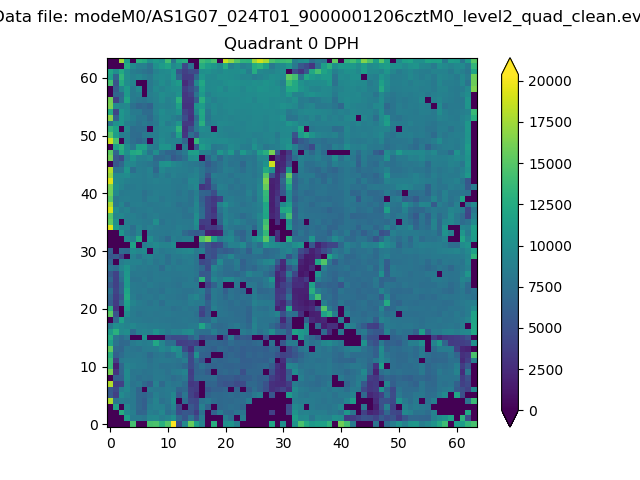 |
 |
Quadrant B |
|---|---|---|---|
| Quadrant D | 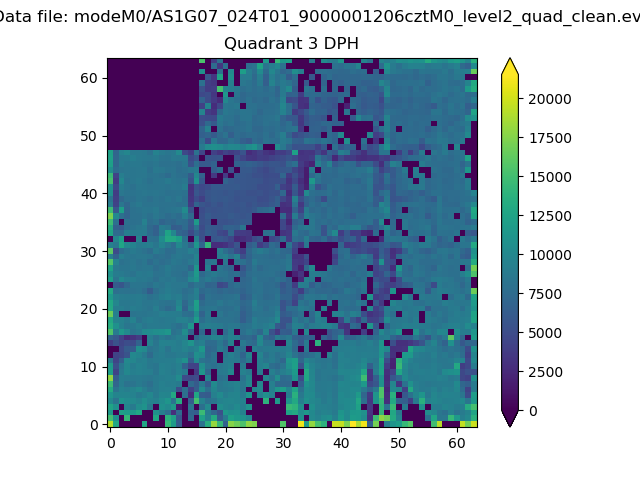 |
 |
Quadrant C |
| Plot type | Count rate plots | Images |
|---|---|---|
| Comparison with Poisson distribution Blue bars denote a histogram of data divided into 1 sec bins. Red curve is a Poisson curve with rate = median count rate of data. |
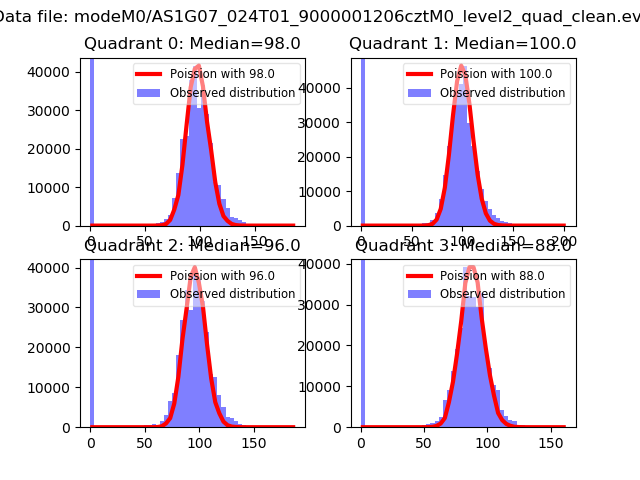 |
 |
| Quadrant-wise count rates Data is divided into 100 sec bins |
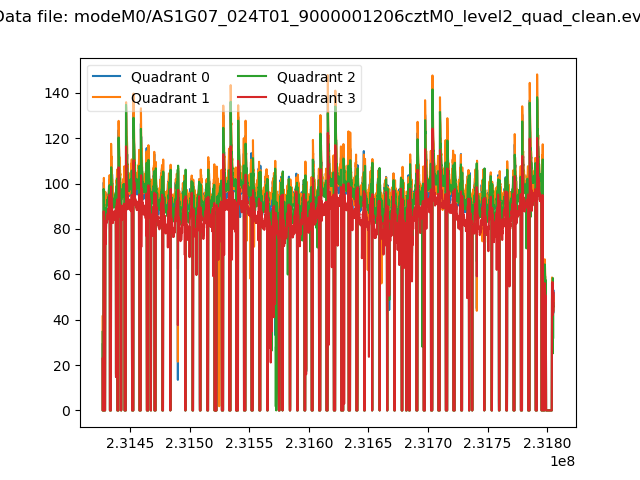 |
|
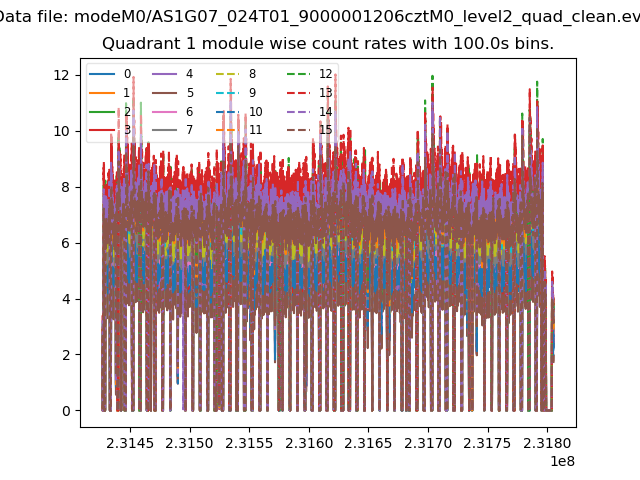
| Module-wise count rates for Quadrant A Data is divided into 100 sec bins |
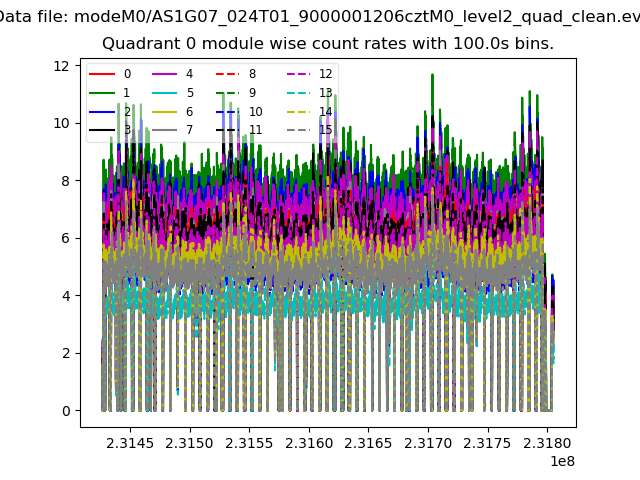 |
 |
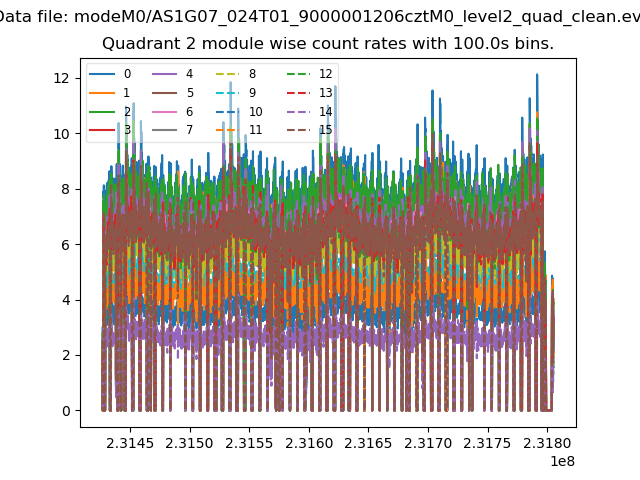
| Module-wise count rates for Quadrant B Data is divided into 100 sec bins |
 |
 |
| Module-wise count rates for Quadrant C Data is divided into 100 sec bins |
 |
 |
| Module-wise count rates for Quadrant D Data is divided into 100 sec bins |
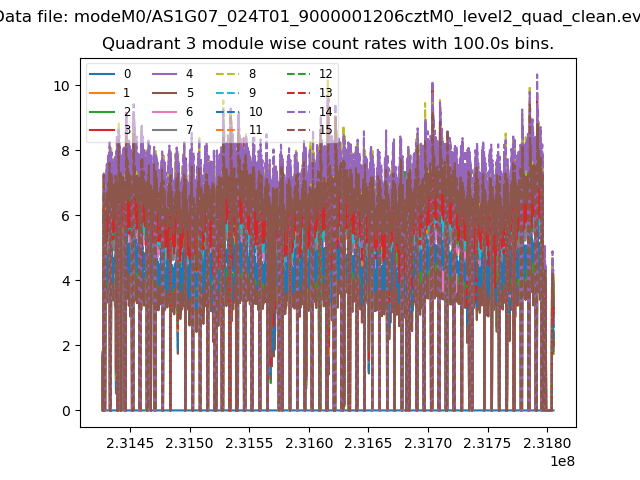 |
 |
| Parameter | Plot |
|---|---|
| CZT HV Monitor | 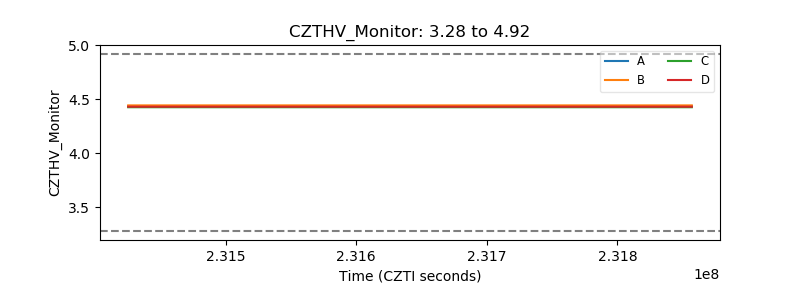 |
| D_VDD | 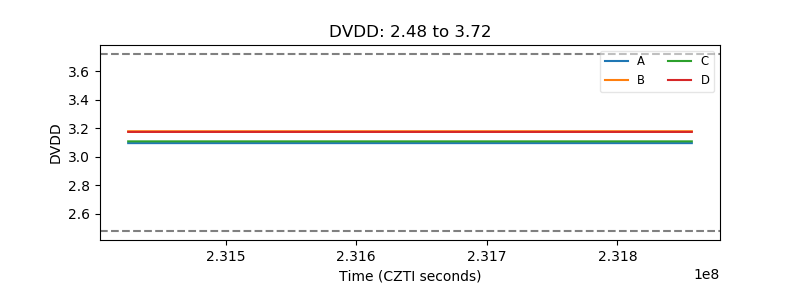 |
| Temperature 1 | 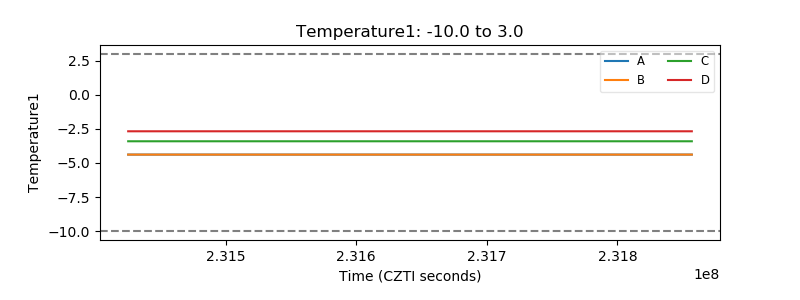 |
| Veto HV Monitor | 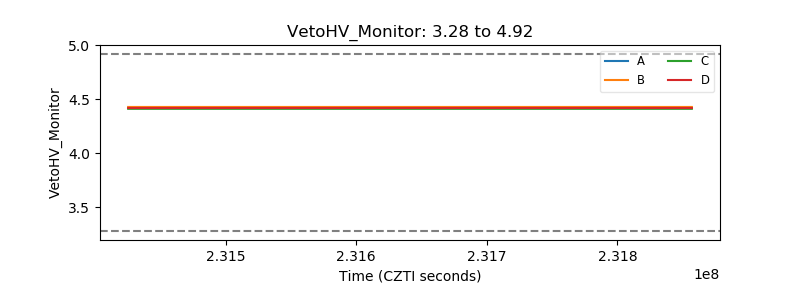 |
| Veto LLD | 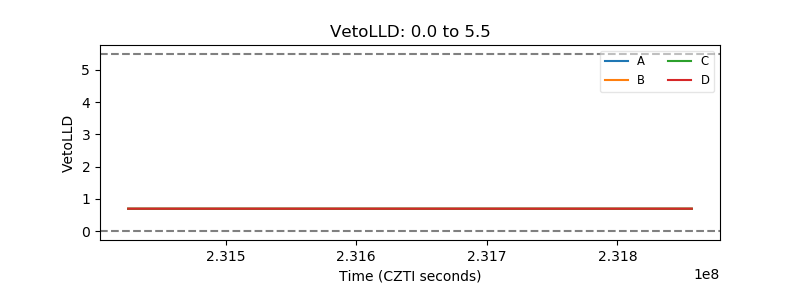 |
| Alpha Counter | 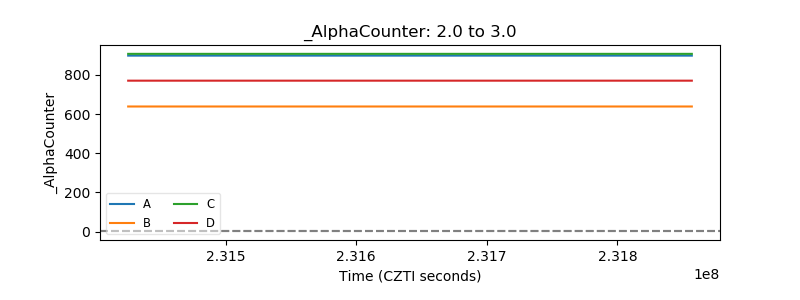 |
| _CPM_Rate | 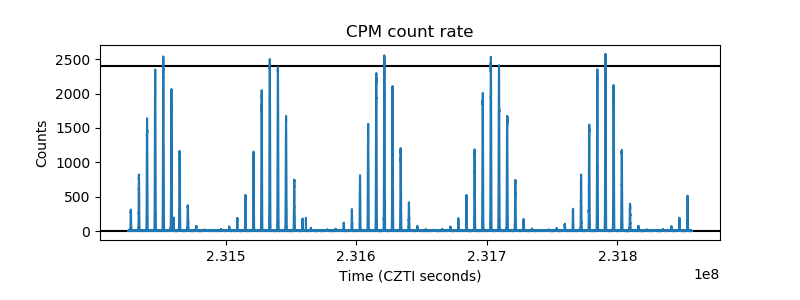 |
| CZT Counter | 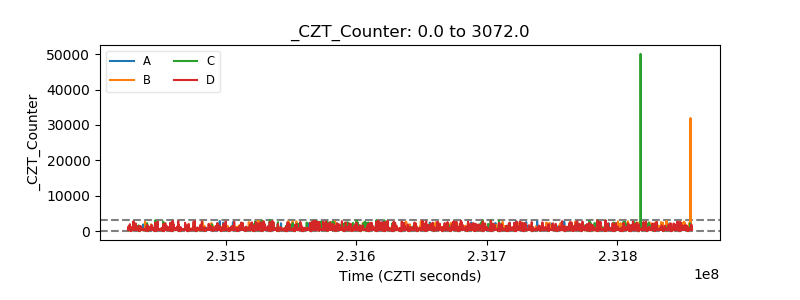 |
| +2.5 Volts monitor | 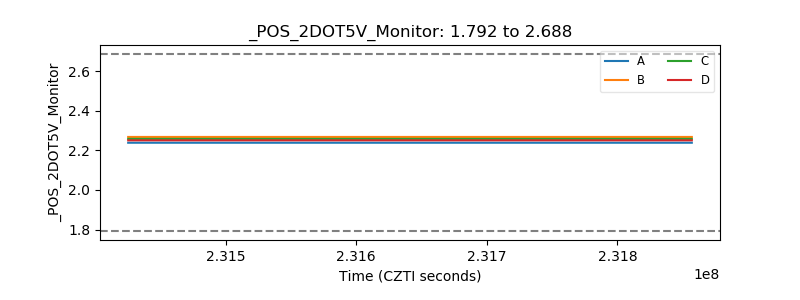 |
| +5 Volts monitor | 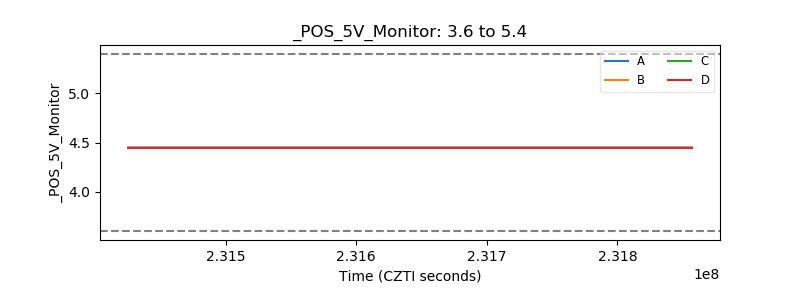 |
| _ROLL_ROT | 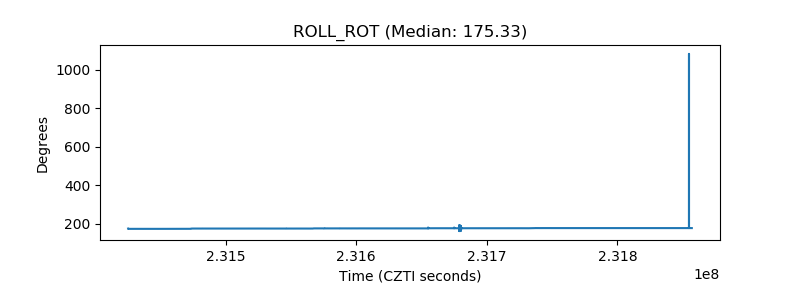 |
| _Roll_DEC | 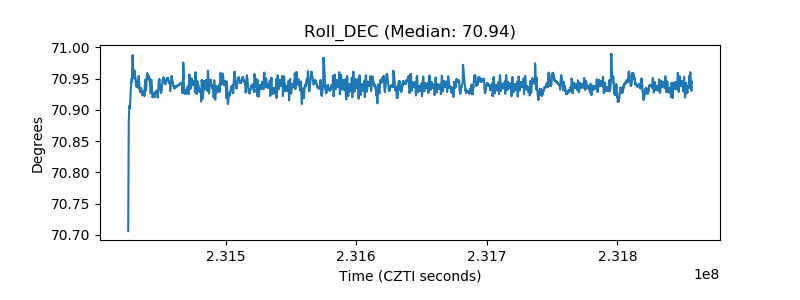 |
| _Roll_RA | 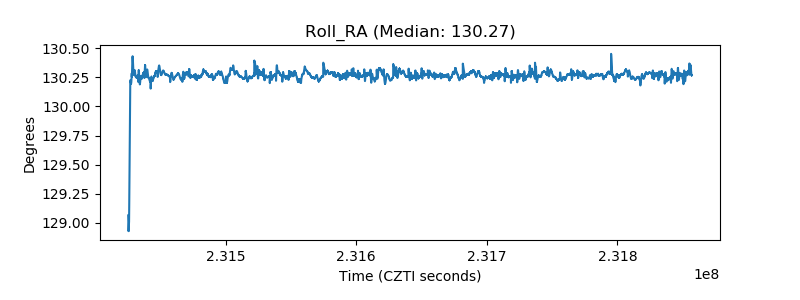 |
| Veto Counter | 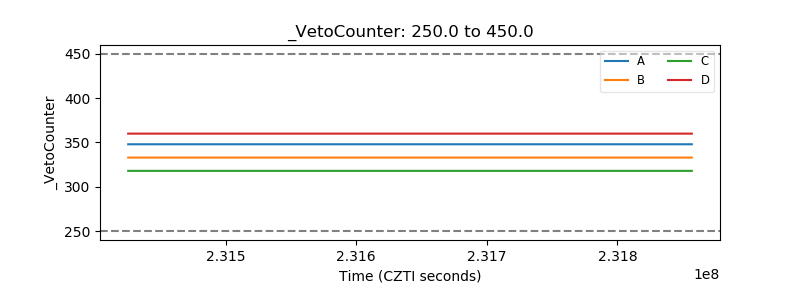 |