| Param | Original file | Final file |
|---|---|---|
| Filename | modeM0/AS1G07_024T01_9000001206_08620cztM0_level2.evt | modeM0/AS1G07_024T01_9000001206_08620cztM0_level2_quad_clean.evt |
| Size (bytes) | 217,656,000 | 58,852,800 |
| Size | 207.6 MB | 56.1 MB |
| Events in quadrant A | 1,523,823 | 388,999 |
| Events in quadrant B | 1,699,499 | 398,504 |
| Events in quadrant C | 1,490,739 | 391,327 |
| Events in quadrant D | 1,655,984 | 373,699 |
| Mode M0 | |||
|---|---|---|---|
| Quadrant | BADHDUFLAG | Total packets | Discarded packets |
| A | 0 | 6722 | 56 |
| B | 0 | 7174 | 78 |
| C | 0 | 6706 | 65 |
| D | 0 | 7217 | 103 |
| Mode M9 | |||
|---|---|---|---|
| Quadrant | BADHDUFLAG | Total packets | Discarded packets |
| A | 0 | 7 | 0 |
| B | 0 | 7 | 0 |
| C | 0 | 7 | 0 |
| D | 0 | 7 | 0 |
| Mode SS | |||
|---|---|---|---|
| Quadrant | BADHDUFLAG | Total packets | Discarded packets |
| A | 0 | 68 | 4 |
| B | 0 | 68 | 0 |
| C | 0 | 68 | 2 |
| D | 0 | 68 | 0 |
| Quadrant | Total seconds | Saturated seconds | Saturation percentage |
|---|---|---|---|
| A | 3239 | 65 | 2.006792% |
| B | 3232 | 57 | 1.763614% |
| C | 3236 | 52 | 1.606922% |
| D | 3220 | 76 | 2.360248% |
Noise dominated data is calculated using 1-second bins in cleaned event files. If a bin has >2000 counts, and if more than 50% of those come from <1% of pixels, then it is considered to be noise-dominated and hence unusable.
| Quadrant | # 1 sec bins | Bins with >0 counts | Bins with >2000 counts | High rate bins dominated by noise | Noise dominated (total time) | Noise dominated (detector-on time) | Marked lightcurve |
|---|---|---|---|---|---|---|---|
| A | 4011 | 3266 | 0 | 0 | 0.00% | 0.00% | 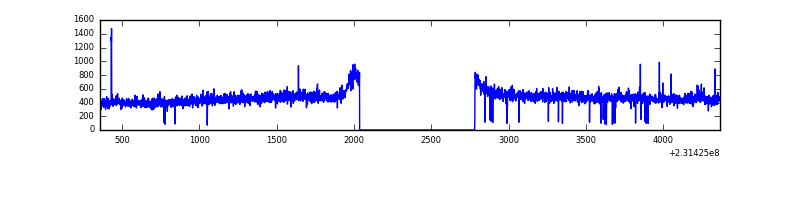 |
| B | 4011 | 3262 | 0 | 0 | 0.00% | 0.00% | 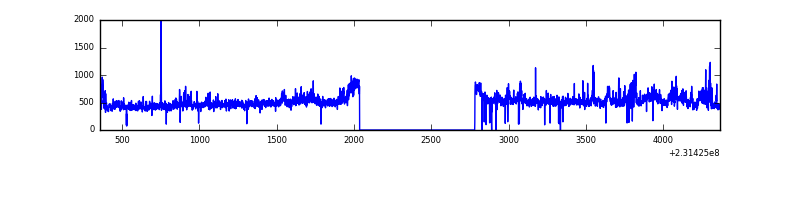 |
| C | 4011 | 3266 | 0 | 0 | 0.00% | 0.00% | 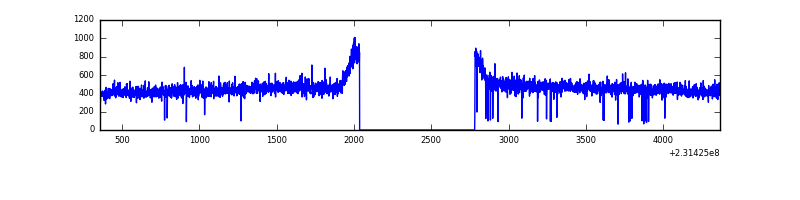 |
| D | 4011 | 3265 | 21 | 21 | 0.52% | 0.64% | 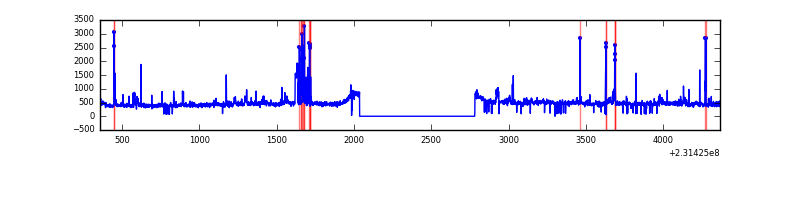 |
Top three noisy pixels from each quadrant. If the there are fewer than three noisy pixels in the level2.evt file, extra rows are filled as -1
| Pixel properties | Quadrant properties | ||||||
|---|---|---|---|---|---|---|---|
| Quadrant | DetID | PixID | Counts | Sigma | Mean | Median | Sigma |
| A | 8 | 5 | 9286 | 108.5 | 392 | 381 | 82.1 |
| A | 0 | 226 | 3718 | 40.66 | 392 | 381 | 82.1 |
| A | 13 | 248 | 3631 | 39.6 | 392 | 381 | 82.1 |
| B | 0 | 214 | 47612 | 617.19 | 391 | 382 | 76.5 |
| B | 0 | 219 | 39655 | 513.21 | 391 | 382 | 76.5 |
| B | 0 | 187 | 24887 | 320.23 | 391 | 382 | 76.5 |
| C | 8 | 128 | 3516 | 35.21 | 378 | 378 | 89.1 |
| C | 1 | 3 | 3479 | 34.79 | 378 | 378 | 89.1 |
| C | 14 | 67 | 2930 | 28.63 | 378 | 378 | 89.1 |
| D | 1 | 52 | 126191 | 1228.49 | 372 | 364 | 102.4 |
| D | 7 | 71 | 32665 | 315.37 | 372 | 364 | 102.4 |
| D | 13 | 105 | 18146 | 173.61 | 372 | 364 | 102.4 |
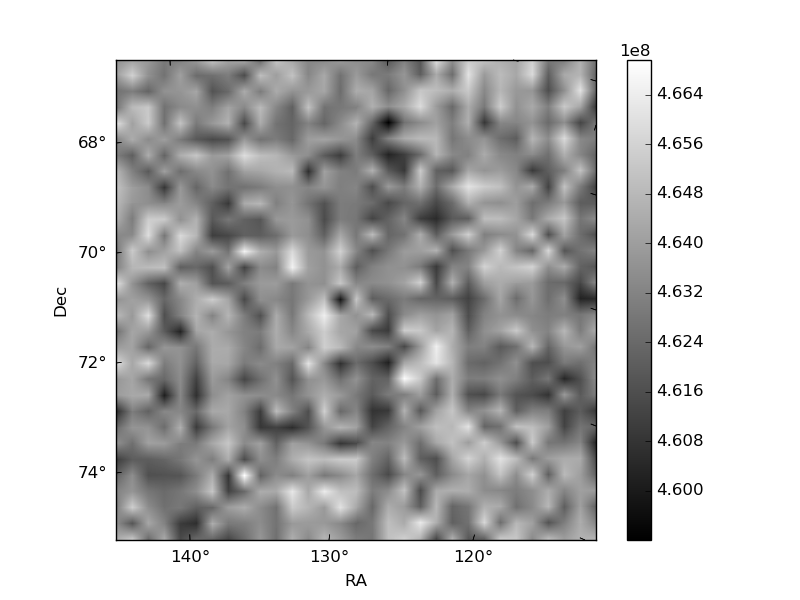
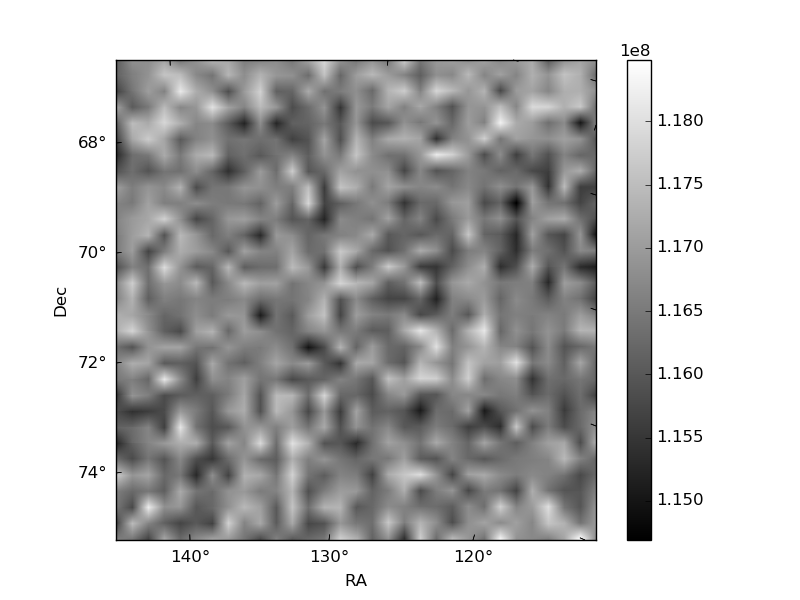
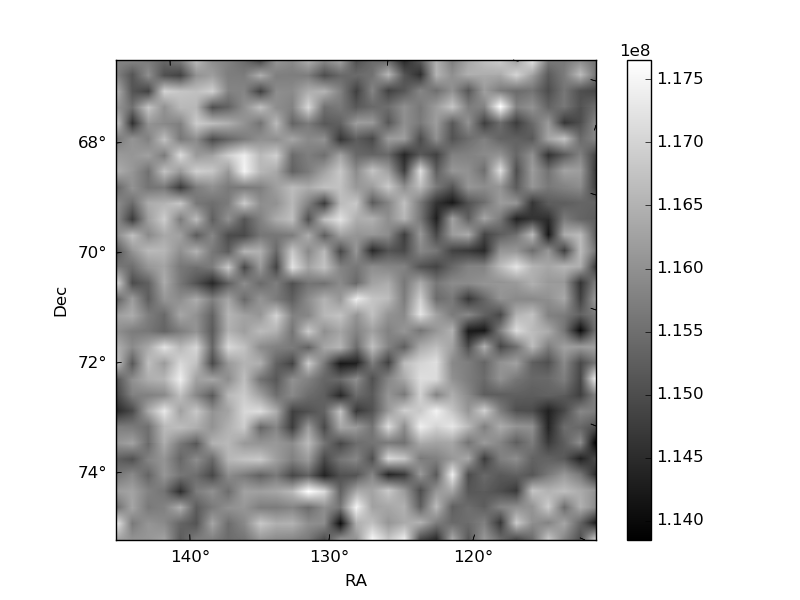
Histogram calculated using DETX and DETY for each event in the final _common_clean file
| Quadrant A | 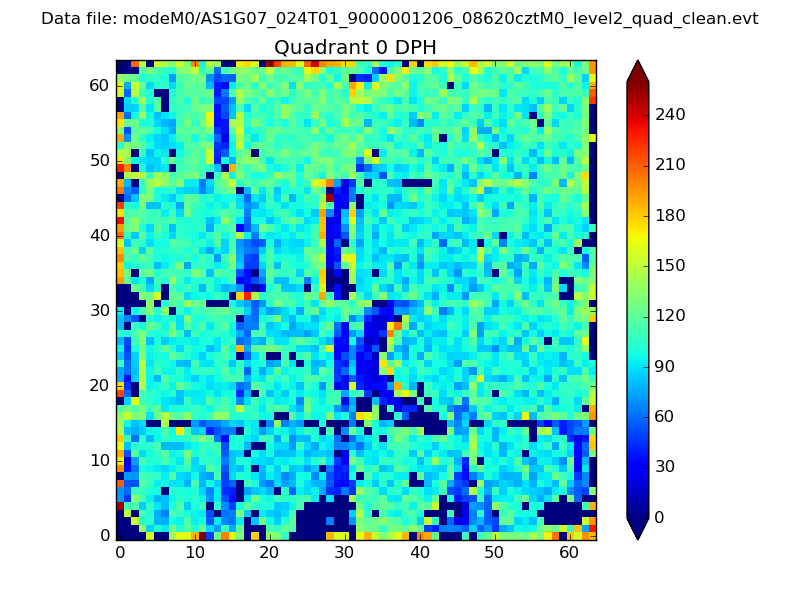 |
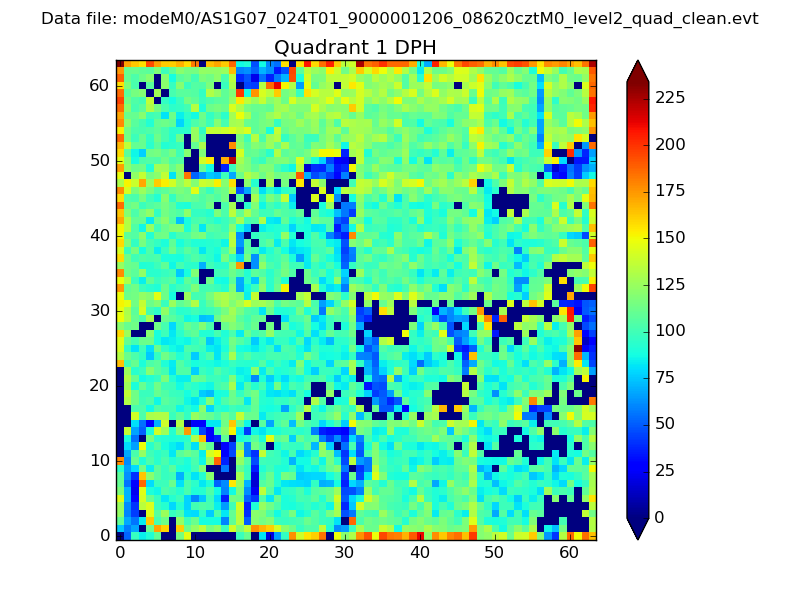 |
Quadrant B |
|---|---|---|---|
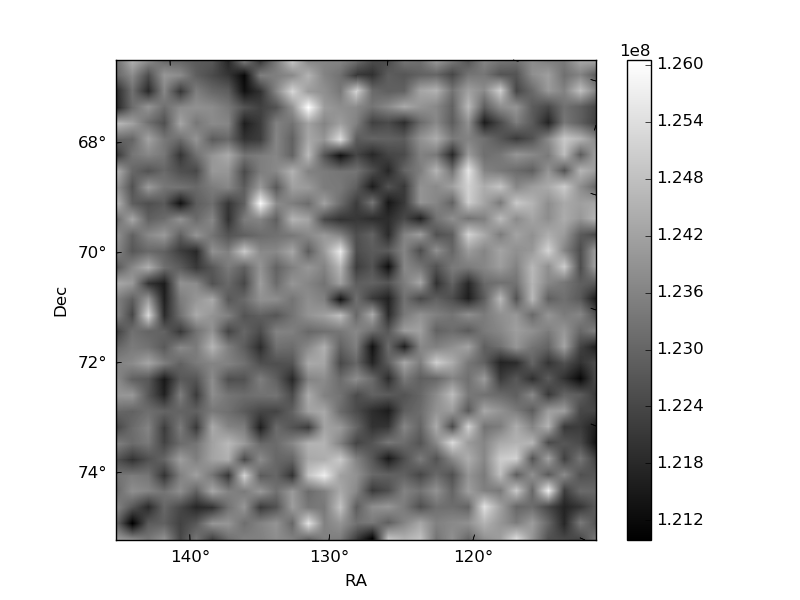
| Quadrant D | 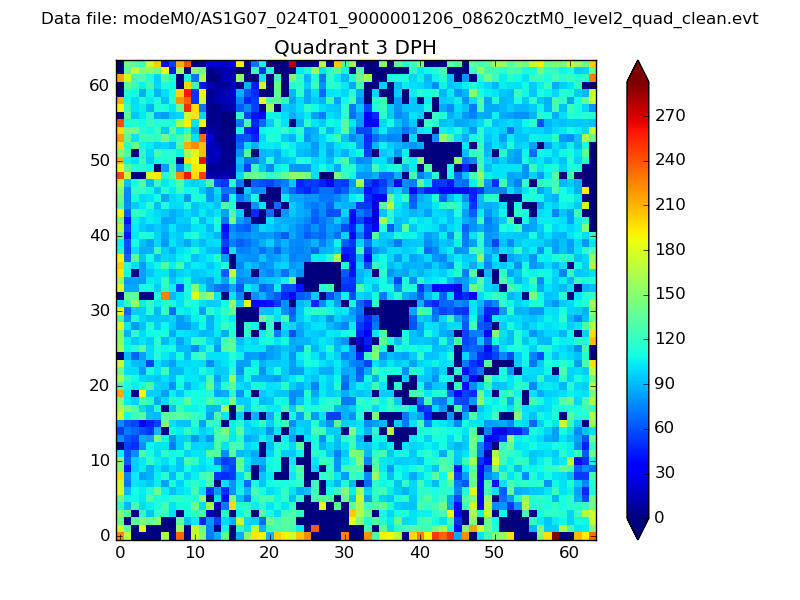 |
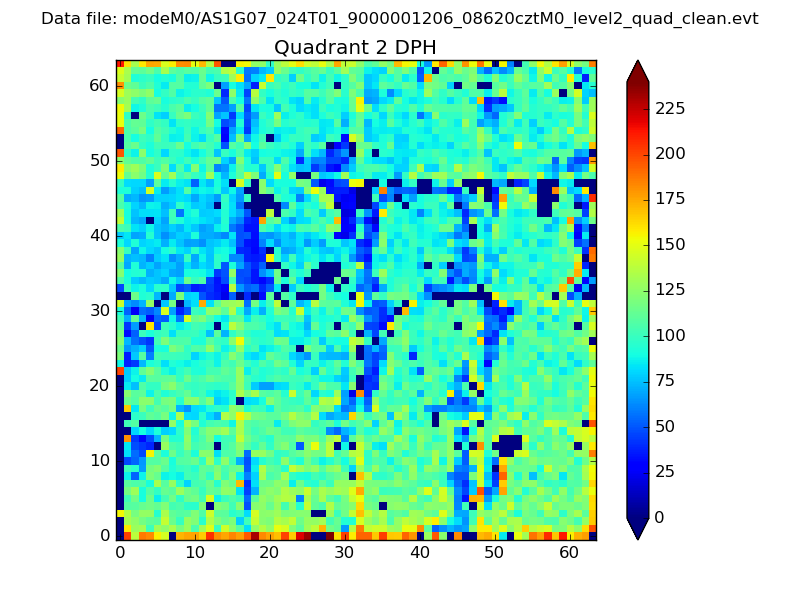 |
Quadrant C |
| Plot type | Count rate plots | Images |
|---|---|---|
| Comparison with Poisson distribution Blue bars denote a histogram of data divided into 1 sec bins. Red curve is a Poisson curve with rate = median count rate of data. |
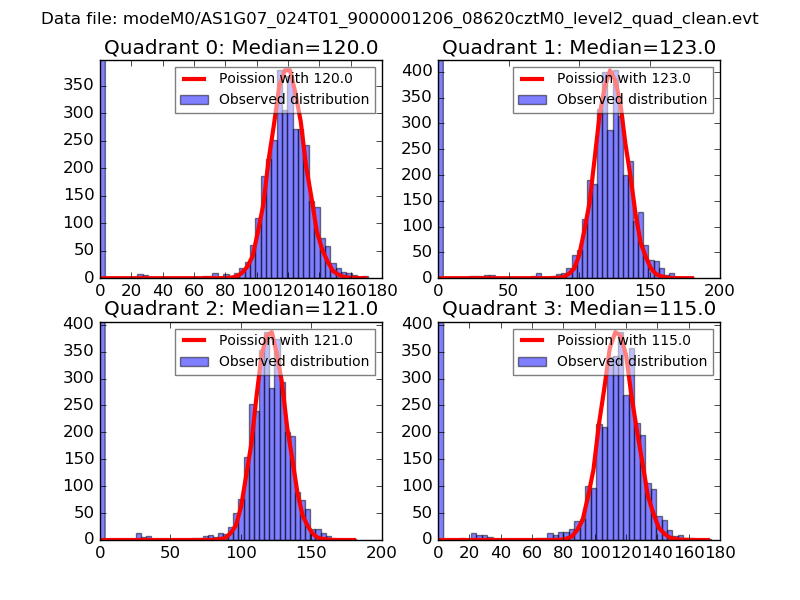 |
 |
| Quadrant-wise count rates Data is divided into 100 sec bins |
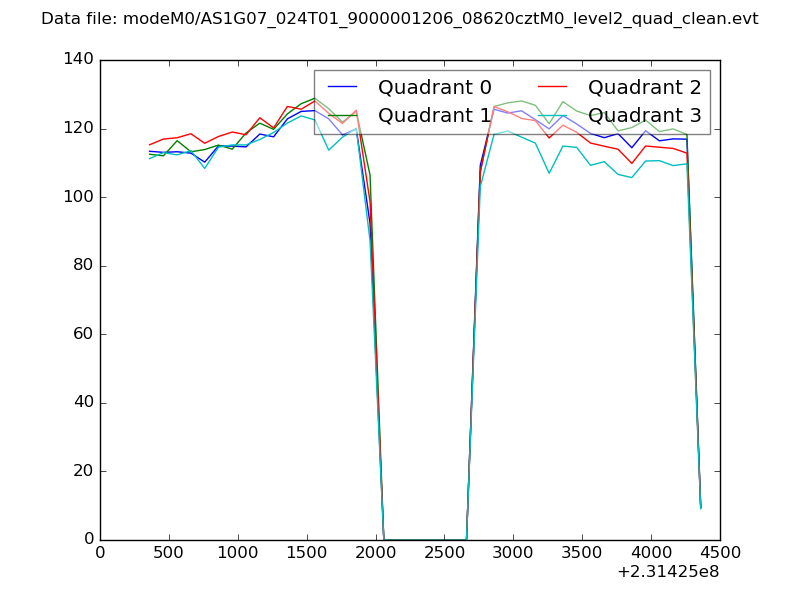 |
|
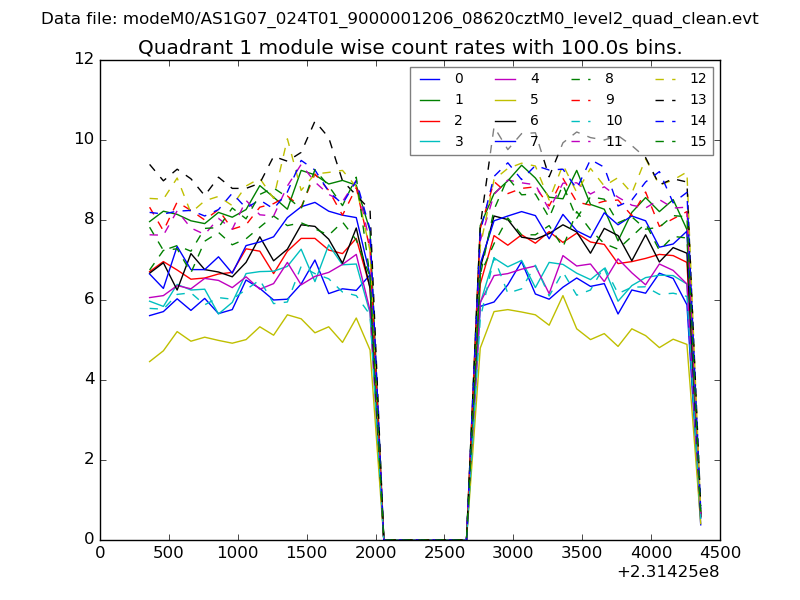
| Module-wise count rates for Quadrant A Data is divided into 100 sec bins |
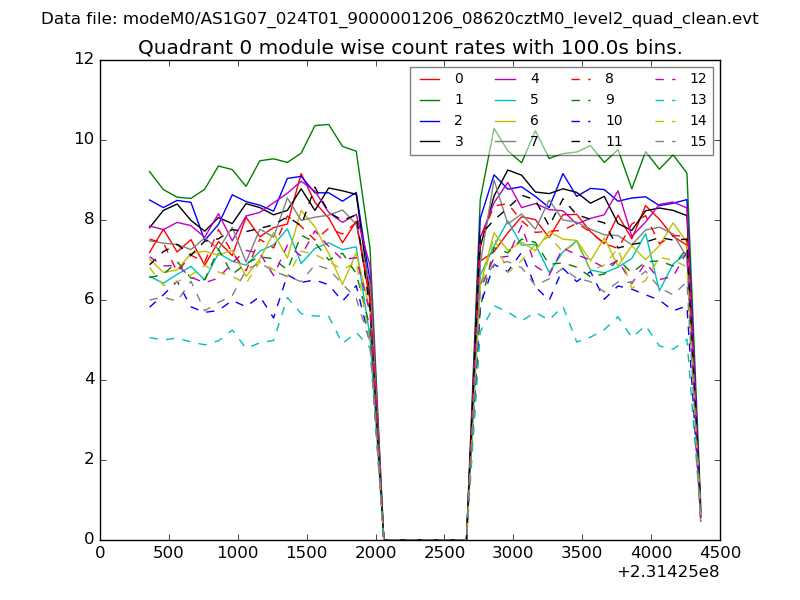 |
 |
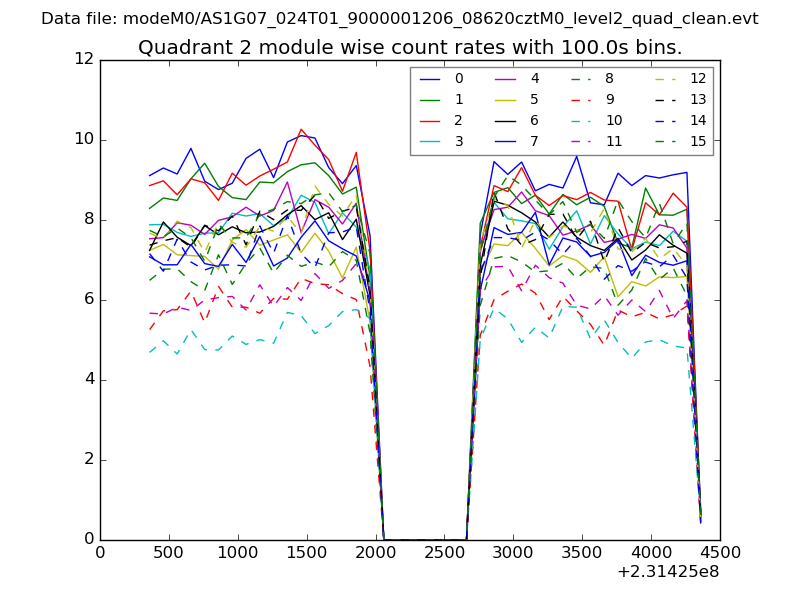
| Module-wise count rates for Quadrant B Data is divided into 100 sec bins |
 |
 |
| Module-wise count rates for Quadrant C Data is divided into 100 sec bins |
 |
 |
| Module-wise count rates for Quadrant D Data is divided into 100 sec bins |
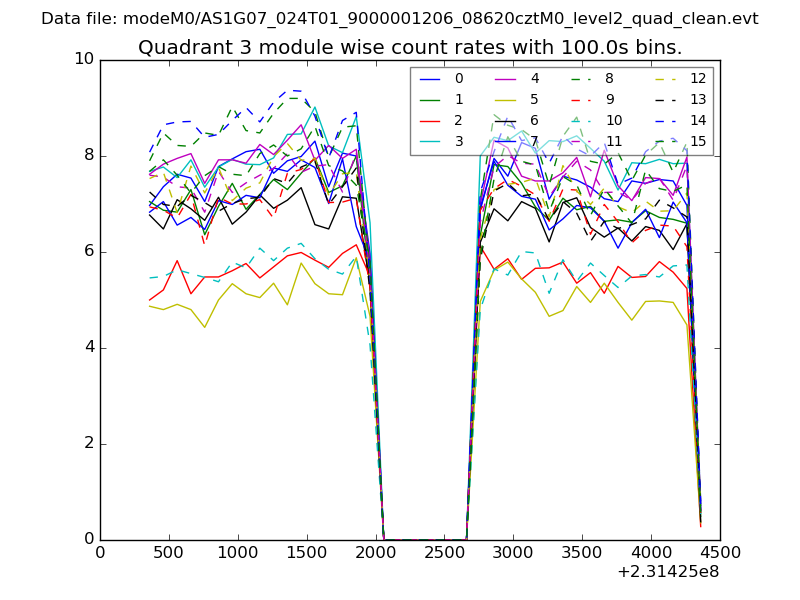 |
 |
| Parameter | Plot |
|---|---|
| CZT HV Monitor | 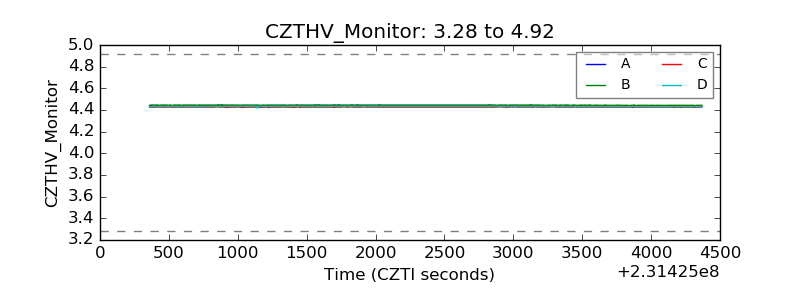 |
| D_VDD | 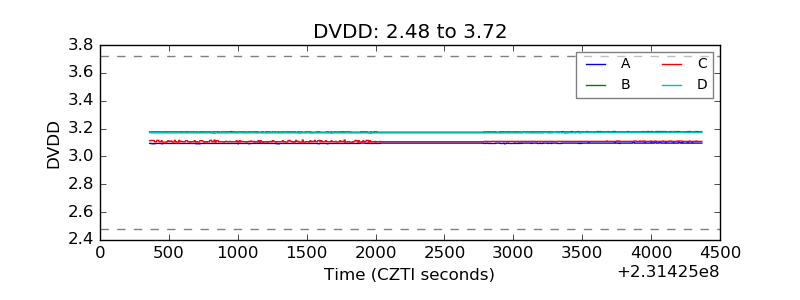 |
| Temperature 1 | 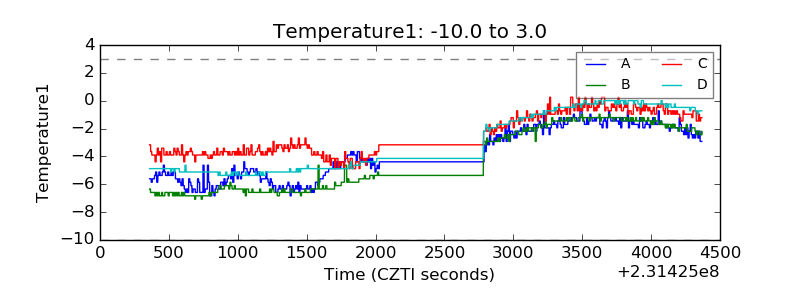 |
| Veto HV Monitor |  |
| Veto LLD | 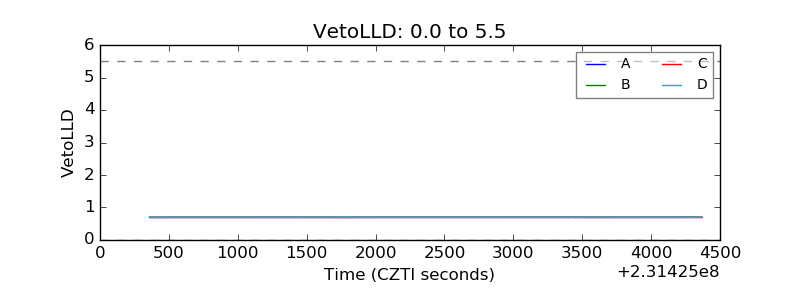 |
| Alpha Counter | 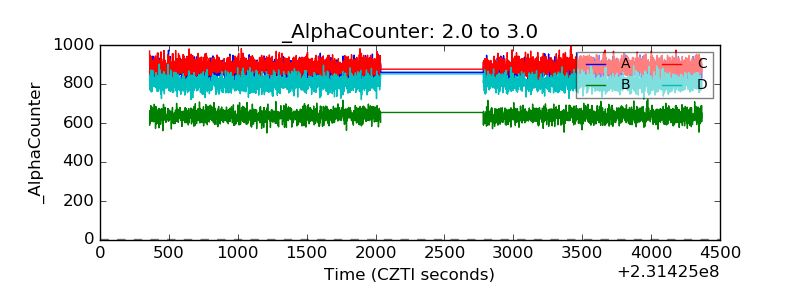 |
| _CPM_Rate | 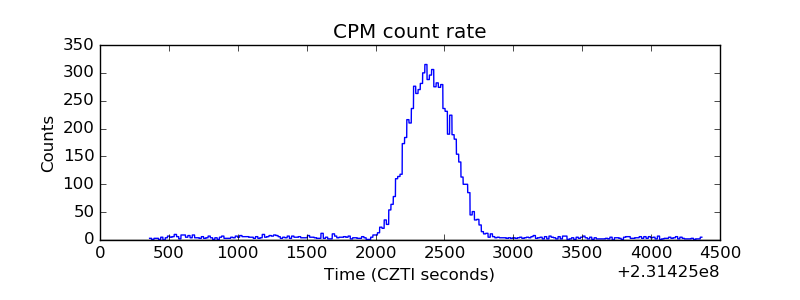 |
| CZT Counter | 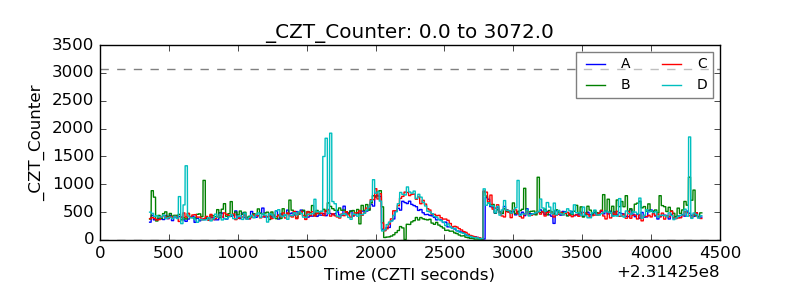 |
| +2.5 Volts monitor |  |
| +5 Volts monitor |  |
| _ROLL_ROT | 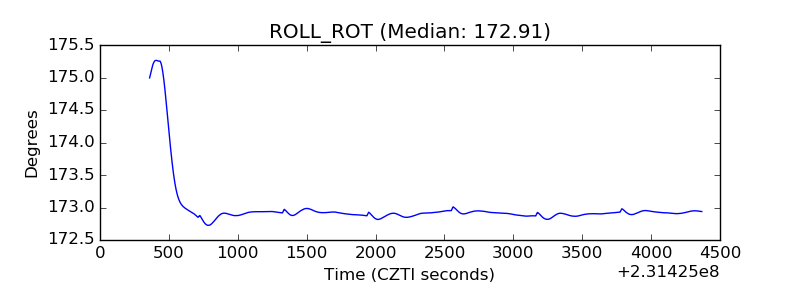 |
| _Roll_DEC | 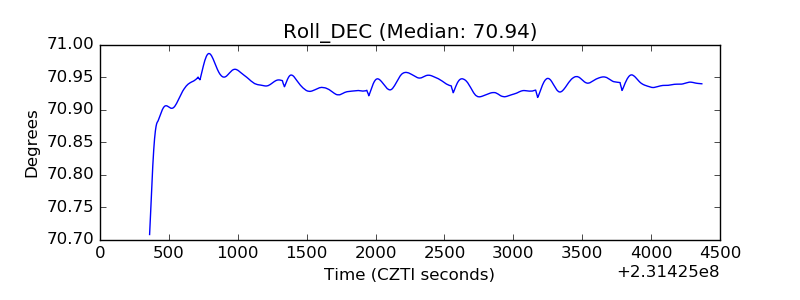 |
| _Roll_RA | 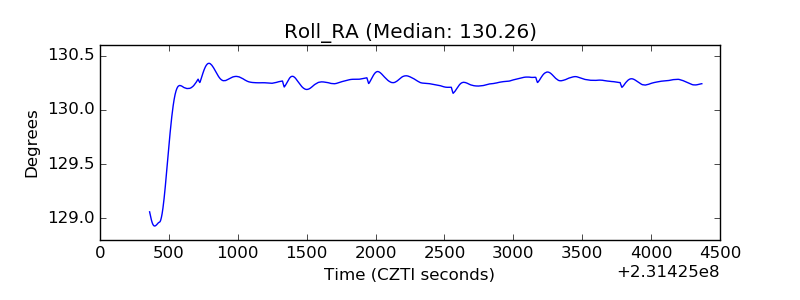 |
| Veto Counter | 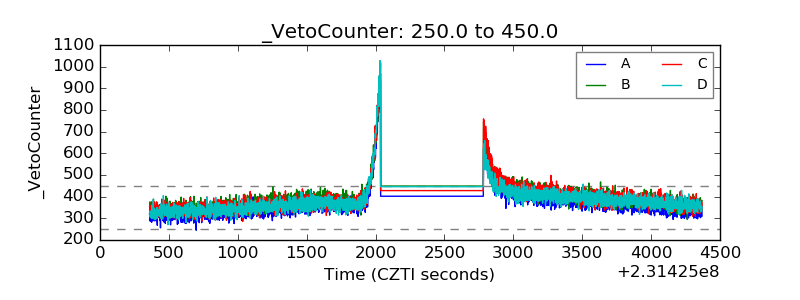 |