| Param | Original file | Final file |
|---|---|---|
| Filename | modeM0/AS1G07_024T01_9000001206_08627cztM0_level2.evt | modeM0/AS1G07_024T01_9000001206_08627cztM0_level2_quad_clean.evt |
| Size (bytes) | 410,843,520 | 120,193,920 |
| Size | 391.8 MB | 114.6 MB |
| Events in quadrant A | 2,802,042 | 793,868 |
| Events in quadrant B | 3,025,017 | 828,396 |
| Events in quadrant C | 2,857,964 | 816,056 |
| Events in quadrant D | 3,326,726 | 760,475 |
| Mode M0 | |||
|---|---|---|---|
| Quadrant | BADHDUFLAG | Total packets | Discarded packets |
| A | 0 | 12925 | 3 |
| B | 0 | 13224 | 2 |
| C | 0 | 13002 | 2 |
| D | 0 | 14714 | 8 |
| Mode M9 | |||
|---|---|---|---|
| Quadrant | BADHDUFLAG | Total packets | Discarded packets |
| A | 0 | 14 | 0 |
| B | 0 | 13 | 0 |
| C | 0 | 13 | 0 |
| D | 0 | 14 | 0 |
| Mode SS | |||
|---|---|---|---|
| Quadrant | BADHDUFLAG | Total packets | Discarded packets |
| A | 0 | 130 | 0 |
| B | 0 | 130 | 0 |
| C | 0 | 130 | 0 |
| D | 0 | 130 | 0 |
| Quadrant | Total seconds | Saturated seconds | Saturation percentage |
|---|---|---|---|
| A | 6323 | 42 | 0.664242% |
| B | 6323 | 59 | 0.933101% |
| C | 6323 | 31 | 0.490274% |
| D | 6322 | 175 | 2.768111% |
Noise dominated data is calculated using 1-second bins in cleaned event files. If a bin has >2000 counts, and if more than 50% of those come from <1% of pixels, then it is considered to be noise-dominated and hence unusable.
| Quadrant | # 1 sec bins | Bins with >0 counts | Bins with >2000 counts | High rate bins dominated by noise | Noise dominated (total time) | Noise dominated (detector-on time) | Marked lightcurve |
|---|---|---|---|---|---|---|---|
| A | 7573 | 6323 | 7 | 7 | 0.09% | 0.11% | 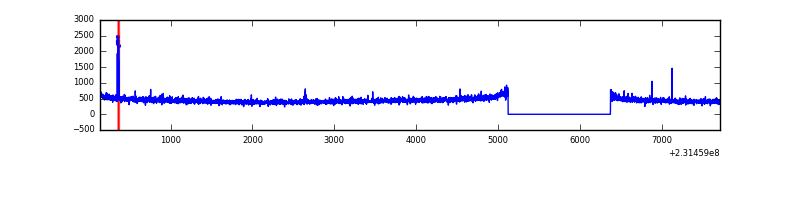 |
| B | 7573 | 6324 | 7 | 7 | 0.09% | 0.11% | 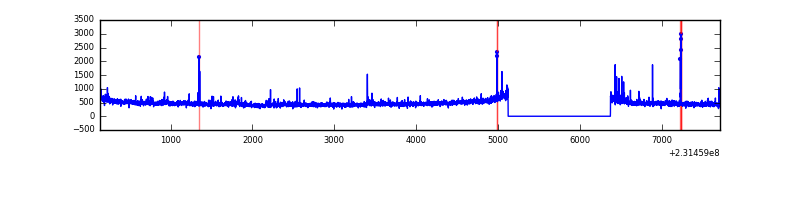 |
| C | 7573 | 6324 | 0 | 0 | 0.00% | 0.00% | 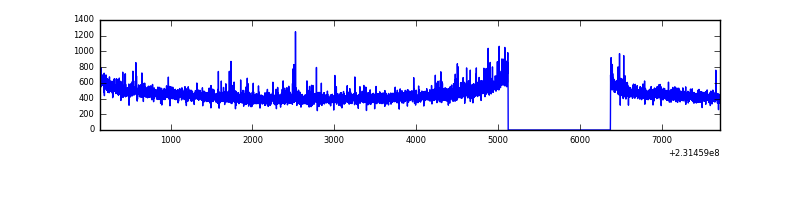 |
| D | 7573 | 6323 | 129 | 129 | 1.70% | 2.04% | 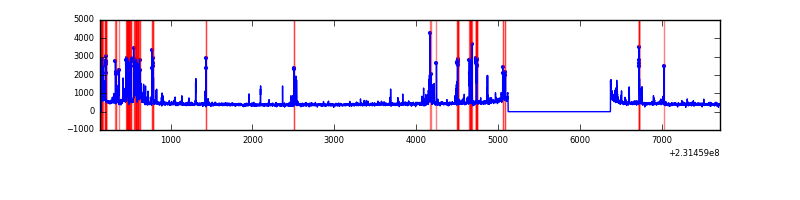 |
Top three noisy pixels from each quadrant. If the there are fewer than three noisy pixels in the level2.evt file, extra rows are filled as -1
| Pixel properties | Quadrant properties | ||||||
|---|---|---|---|---|---|---|---|
| Quadrant | DetID | PixID | Counts | Sigma | Mean | Median | Sigma |
| A | 15 | 174 | 23991 | 159.26 | 720 | 705 | 146.2 |
| A | 0 | 226 | 6733 | 41.23 | 720 | 705 | 146.2 |
| A | 12 | 194 | 6201 | 37.59 | 720 | 705 | 146.2 |
| B | 0 | 214 | 46567 | 334.15 | 740 | 722 | 137.2 |
| B | 10 | 246 | 24175 | 170.94 | 740 | 722 | 137.2 |
| B | 4 | 80 | 21371 | 150.5 | 740 | 722 | 137.2 |
| C | 8 | 208 | 36776 | 219.1 | 714 | 717 | 164.6 |
| C | 14 | 64 | 26254 | 155.17 | 714 | 717 | 164.6 |
| C | 13 | 61 | 5498 | 29.05 | 714 | 717 | 164.6 |
| D | 10 | 253 | 341058 | 2023.17 | 695 | 673 | 168.2 |
| D | 12 | 221 | 155071 | 917.71 | 695 | 673 | 168.2 |
| D | 7 | 71 | 78334 | 461.6 | 695 | 673 | 168.2 |
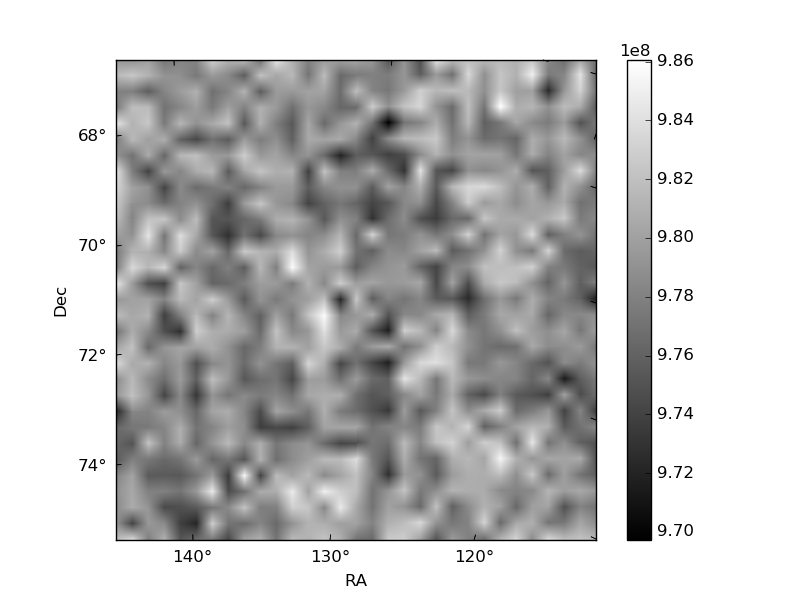
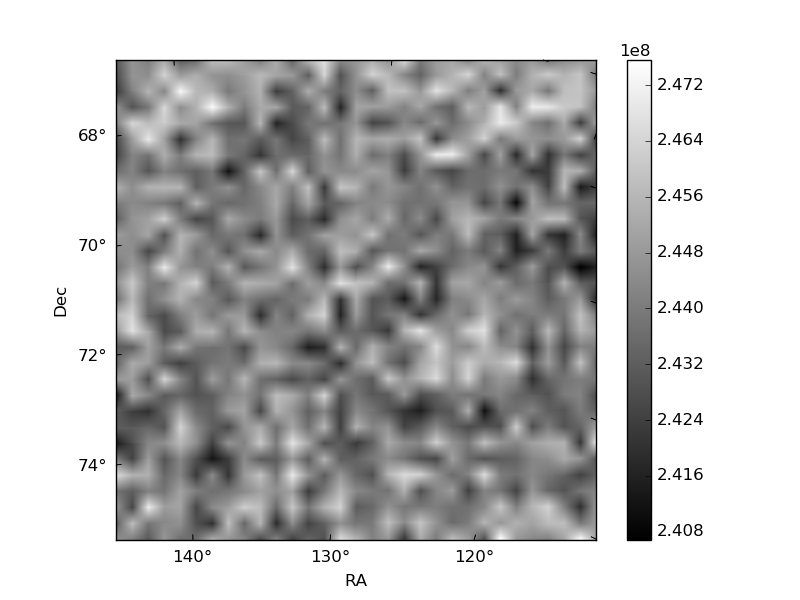
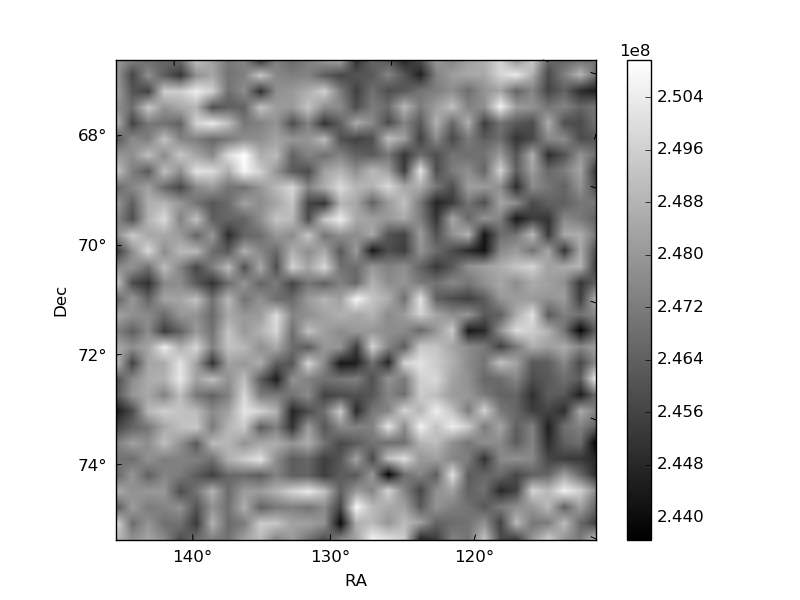
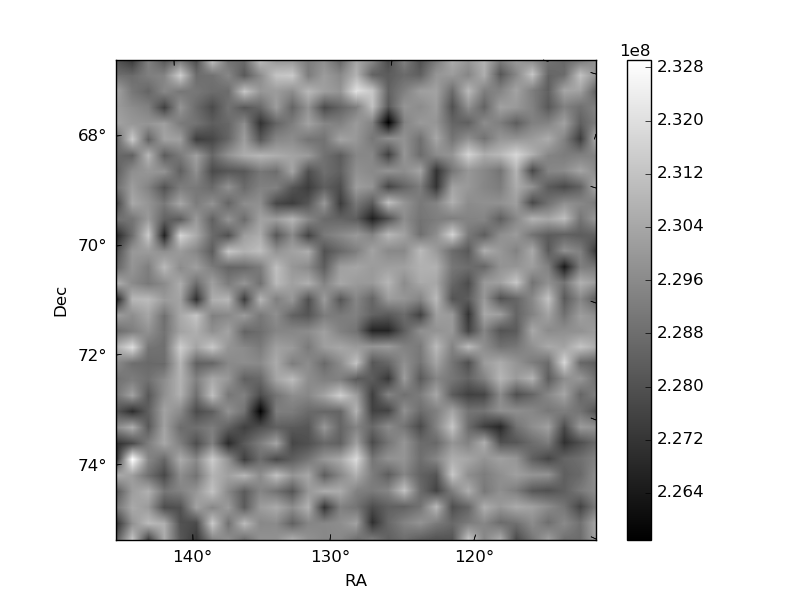
Histogram calculated using DETX and DETY for each event in the final _common_clean file
| Quadrant A | 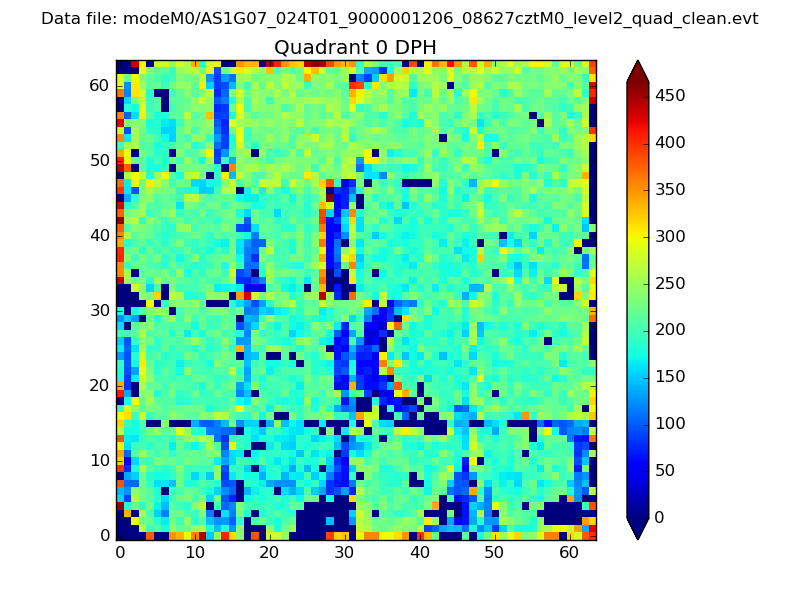 |
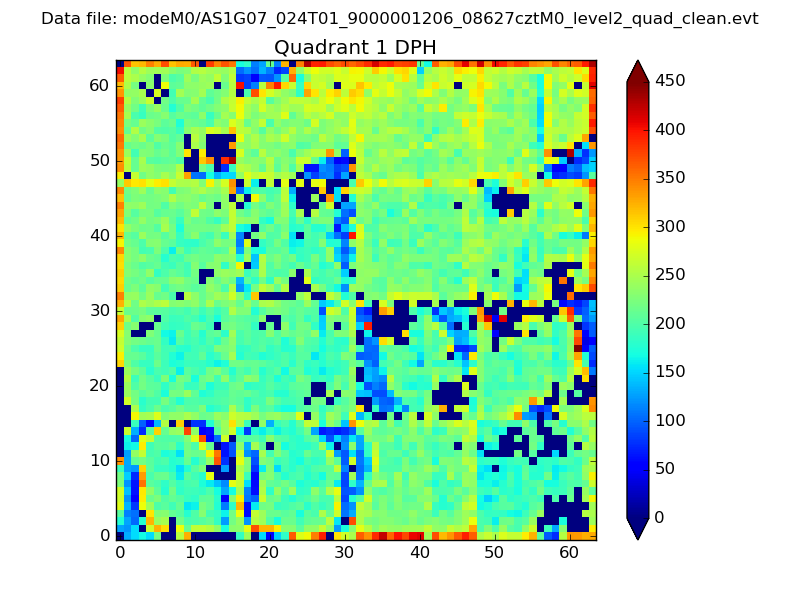 |
Quadrant B |
|---|---|---|---|
| Quadrant D |  |
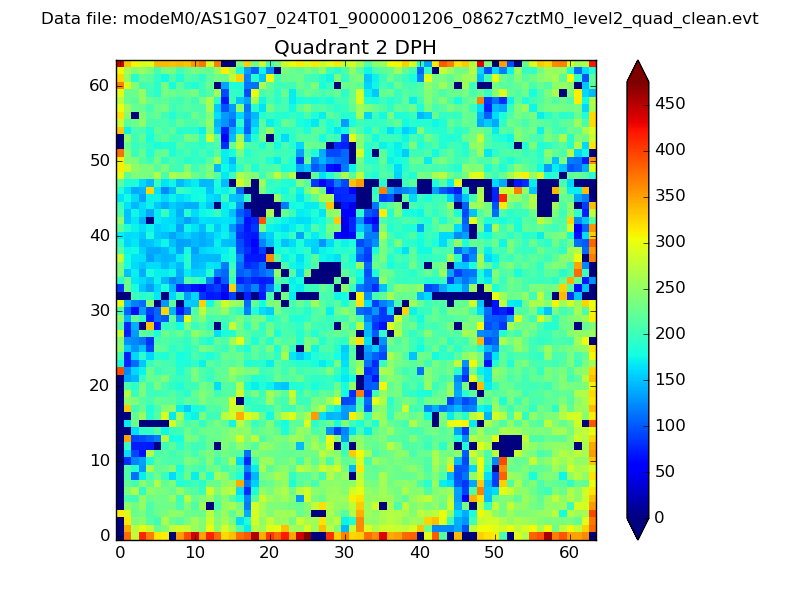 |
Quadrant C |
| Plot type | Count rate plots | Images |
|---|---|---|
| Comparison with Poisson distribution Blue bars denote a histogram of data divided into 1 sec bins. Red curve is a Poisson curve with rate = median count rate of data. |
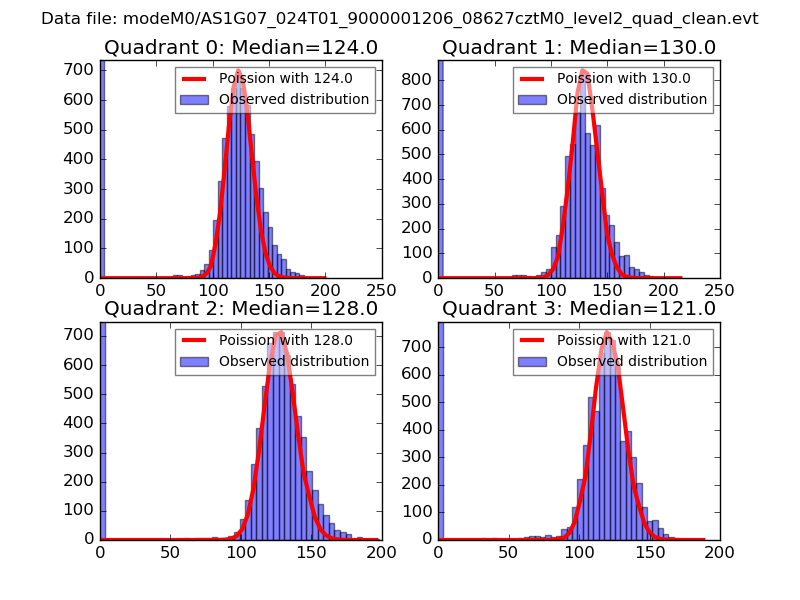 |
 |
| Quadrant-wise count rates Data is divided into 100 sec bins |
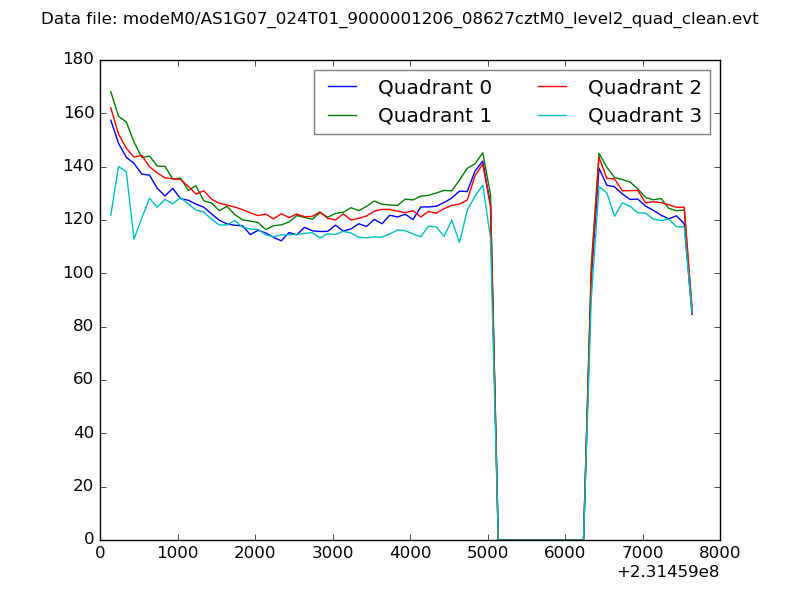 |
|
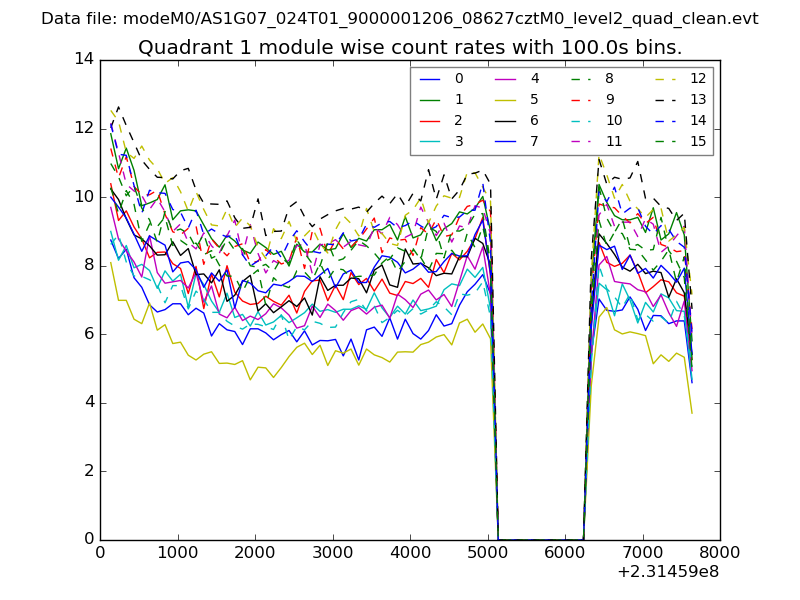
| Module-wise count rates for Quadrant A Data is divided into 100 sec bins |
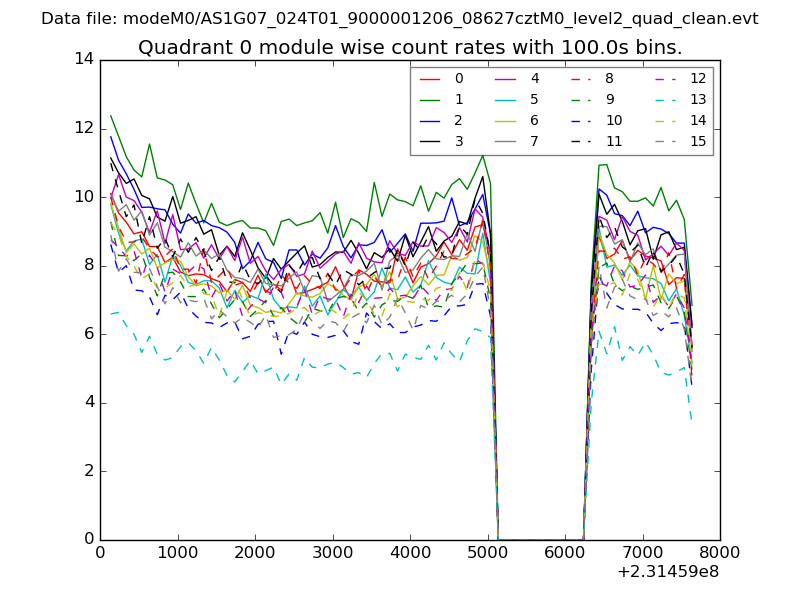 |
 |
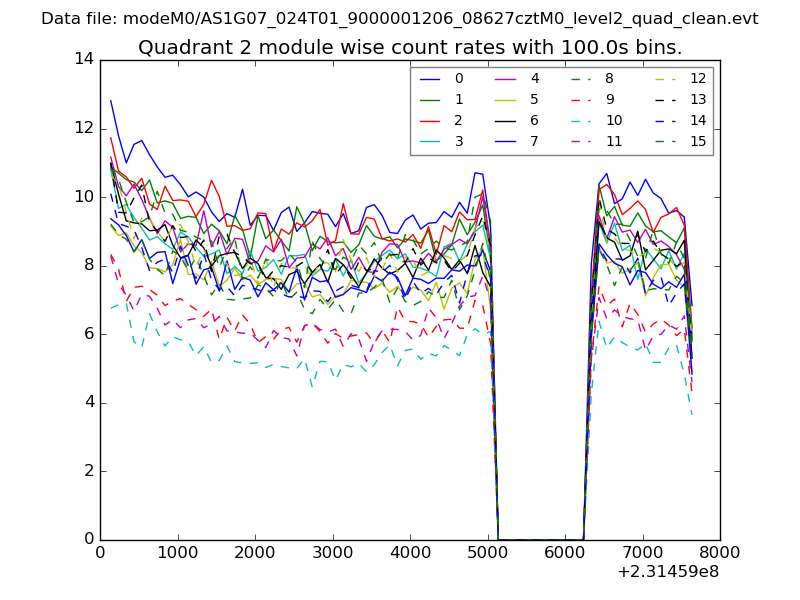
| Module-wise count rates for Quadrant B Data is divided into 100 sec bins |
 |
 |
| Module-wise count rates for Quadrant C Data is divided into 100 sec bins |
 |
 |
| Module-wise count rates for Quadrant D Data is divided into 100 sec bins |
 |
 |
| Parameter | Plot |
|---|---|
| CZT HV Monitor | 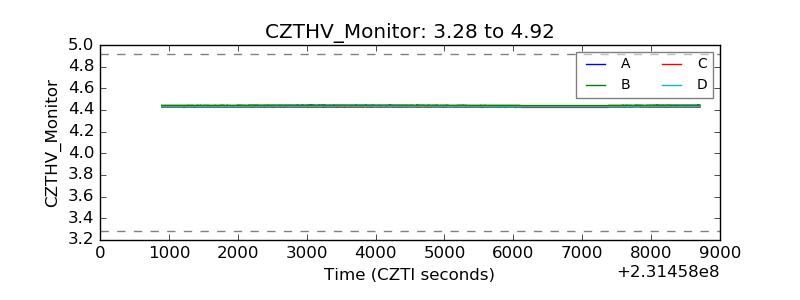 |
| D_VDD | 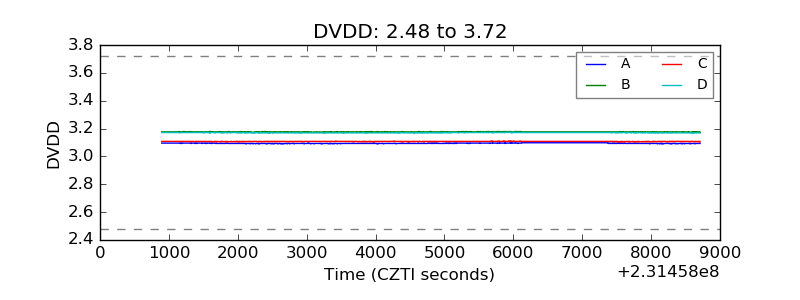 |
| Temperature 1 | 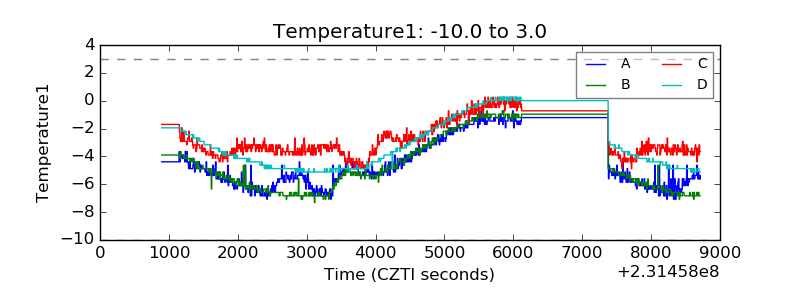 |
| Veto HV Monitor | 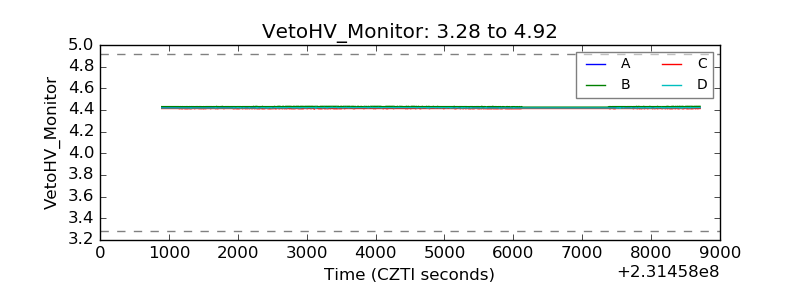 |
| Veto LLD | 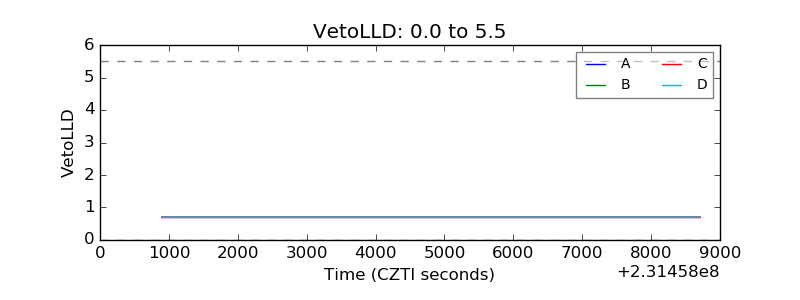 |
| Alpha Counter | 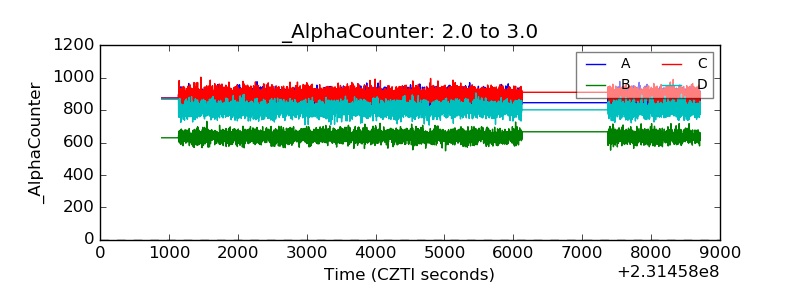 |
| _CPM_Rate | 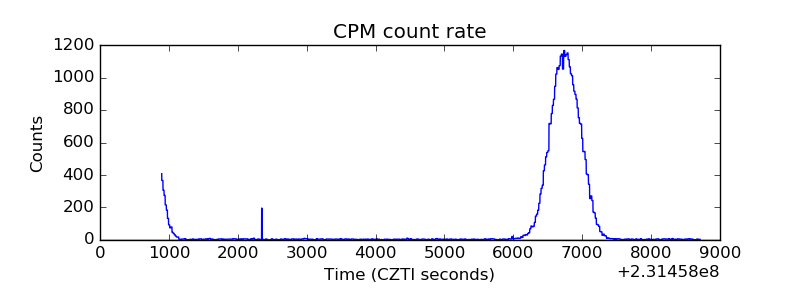 |
| CZT Counter | 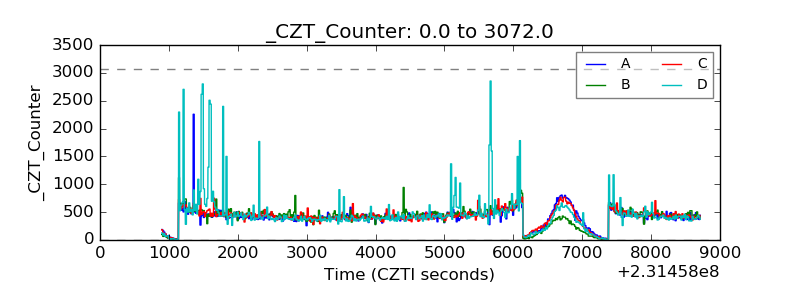 |
| +2.5 Volts monitor |  |
| +5 Volts monitor | 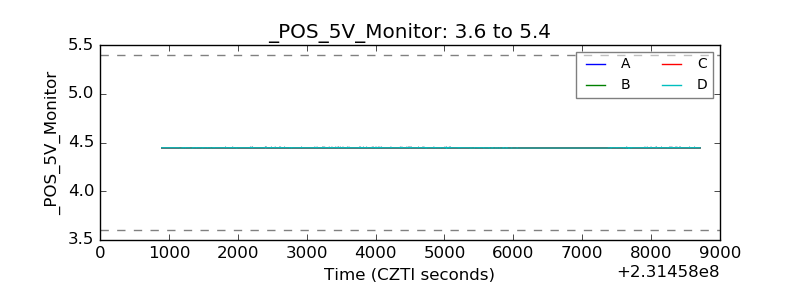 |
| _ROLL_ROT | 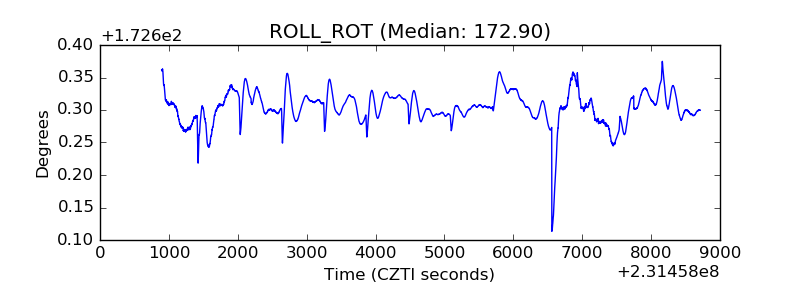 |
| _Roll_DEC | 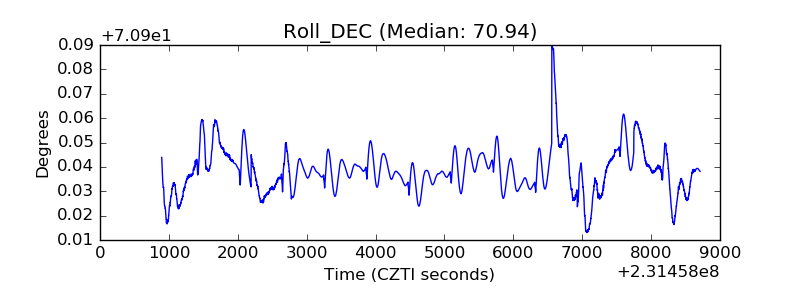 |
| _Roll_RA | 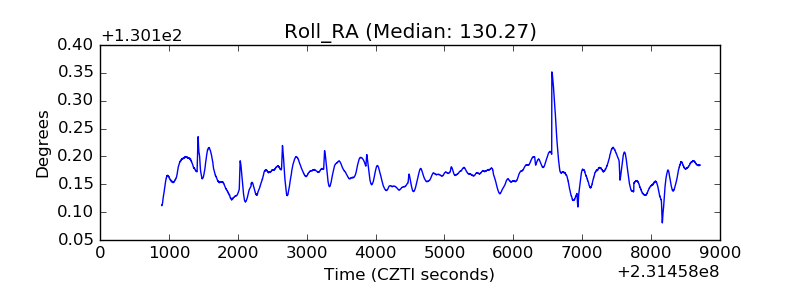 |
| Veto Counter | 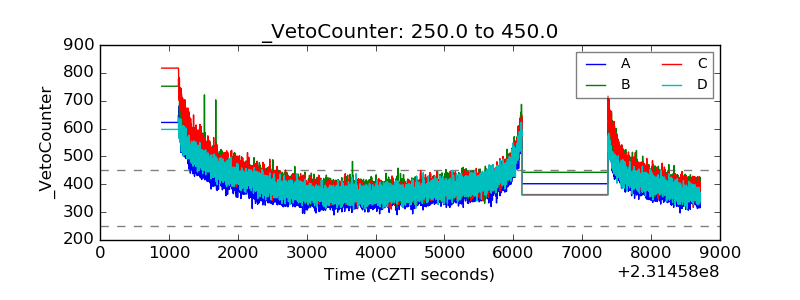 |