| Param | Original file | Final file |
|---|---|---|
| Filename | modeM0/AS1G07_024T01_9000001206_08630cztM0_level2.evt | modeM0/AS1G07_024T01_9000001206_08630cztM0_level2_quad_clean.evt |
| Size (bytes) | 476,933,760 | 134,596,800 |
| Size | 454.8 MB | 128.4 MB |
| Events in quadrant A | 3,318,532 | 879,631 |
| Events in quadrant B | 3,703,364 | 911,181 |
| Events in quadrant C | 3,456,473 | 898,696 |
| Events in quadrant D | 3,448,125 | 857,848 |
| Mode M0 | |||
|---|---|---|---|
| Quadrant | BADHDUFLAG | Total packets | Discarded packets |
| A | 0 | 15611 | 3 |
| B | 0 | 16289 | 2 |
| C | 0 | 15926 | 2 |
| D | 0 | 16186 | 2 |
| Mode M9 | |||
|---|---|---|---|
| Quadrant | BADHDUFLAG | Total packets | Discarded packets |
| A | 0 | 3 | 0 |
| B | 0 | 3 | 0 |
| C | 0 | 3 | 0 |
| D | 0 | 4 | 0 |
| Mode SS | |||
|---|---|---|---|
| Quadrant | BADHDUFLAG | Total packets | Discarded packets |
| A | 0 | 154 | 0 |
| B | 0 | 154 | 0 |
| C | 0 | 154 | 0 |
| D | 0 | 154 | 0 |
| Quadrant | Total seconds | Saturated seconds | Saturation percentage |
|---|---|---|---|
| A | 7607 | 147 | 1.932431% |
| B | 7607 | 209 | 2.747469% |
| C | 7607 | 59 | 0.775601% |
| D | 7607 | 126 | 1.656369% |
Noise dominated data is calculated using 1-second bins in cleaned event files. If a bin has >2000 counts, and if more than 50% of those come from <1% of pixels, then it is considered to be noise-dominated and hence unusable.
| Quadrant | # 1 sec bins | Bins with >0 counts | Bins with >2000 counts | High rate bins dominated by noise | Noise dominated (total time) | Noise dominated (detector-on time) | Marked lightcurve |
|---|---|---|---|---|---|---|---|
| A | 7822 | 7608 | 3 | 3 | 0.04% | 0.04% |  |
| B | 7822 | 7607 | 15 | 15 | 0.19% | 0.20% |  |
| C | 7822 | 7607 | 5 | 5 | 0.06% | 0.07% |  |
| D | 7822 | 7608 | 43 | 43 | 0.55% | 0.57% |  |
Top three noisy pixels from each quadrant. If the there are fewer than three noisy pixels in the level2.evt file, extra rows are filled as -1
| Pixel properties | Quadrant properties | ||||||
|---|---|---|---|---|---|---|---|
| Quadrant | DetID | PixID | Counts | Sigma | Mean | Median | Sigma |
| A | 15 | 174 | 29756 | 166.25 | 850 | 829 | 174.0 |
| A | 13 | 248 | 18401 | 100.99 | 850 | 829 | 174.0 |
| A | 0 | 226 | 7996 | 41.19 | 850 | 829 | 174.0 |
| B | 11 | 51 | 153104 | 932.82 | 866 | 844 | 163.2 |
| B | 0 | 214 | 59247 | 357.81 | 866 | 844 | 163.2 |
| B | 0 | 219 | 48656 | 292.92 | 866 | 844 | 163.2 |
| C | 8 | 208 | 159784 | 826.26 | 836 | 839 | 192.4 |
| C | 12 | 4 | 10417 | 49.79 | 836 | 839 | 192.4 |
| C | 14 | 64 | 8193 | 38.23 | 836 | 839 | 192.4 |
| D | 10 | 253 | 146327 | 713.62 | 827 | 798 | 203.9 |
| D | 9 | 64 | 58832 | 284.58 | 827 | 798 | 203.9 |
| D | 2 | 234 | 30204 | 144.2 | 827 | 798 | 203.9 |
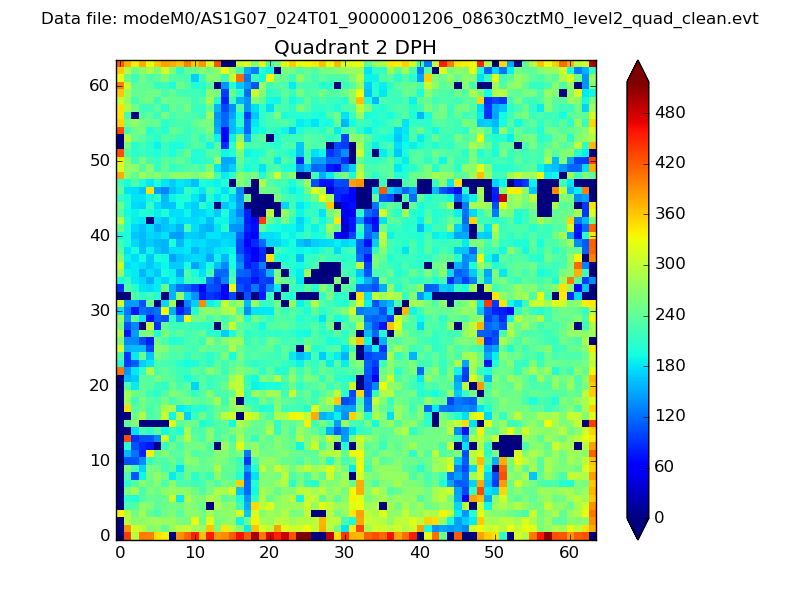
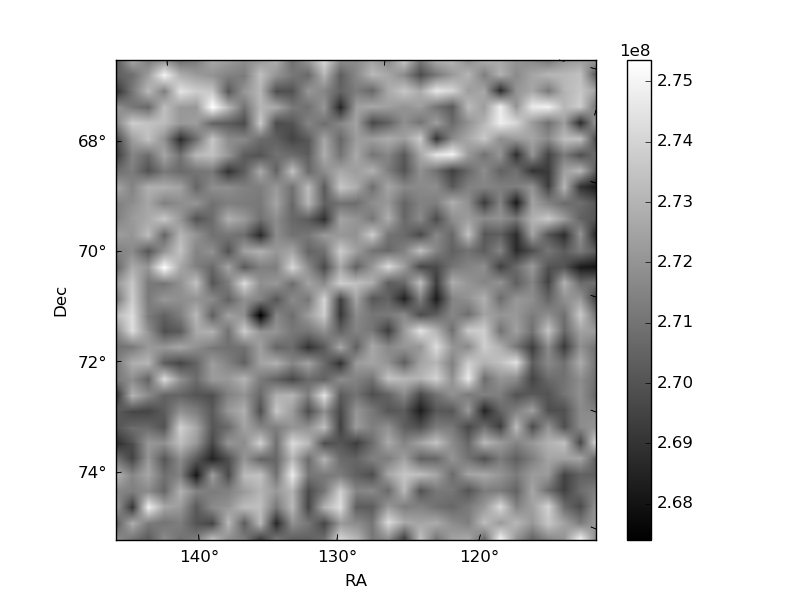
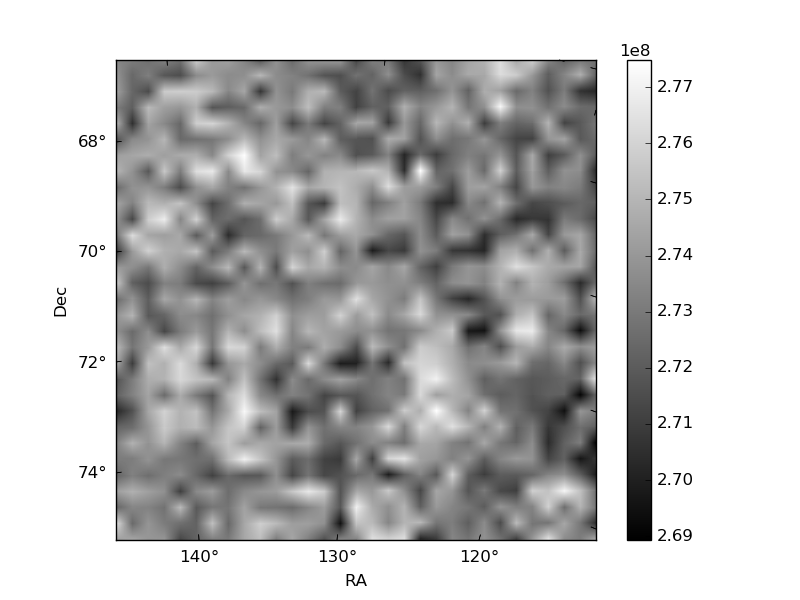
Histogram calculated using DETX and DETY for each event in the final _common_clean file
| Quadrant A | 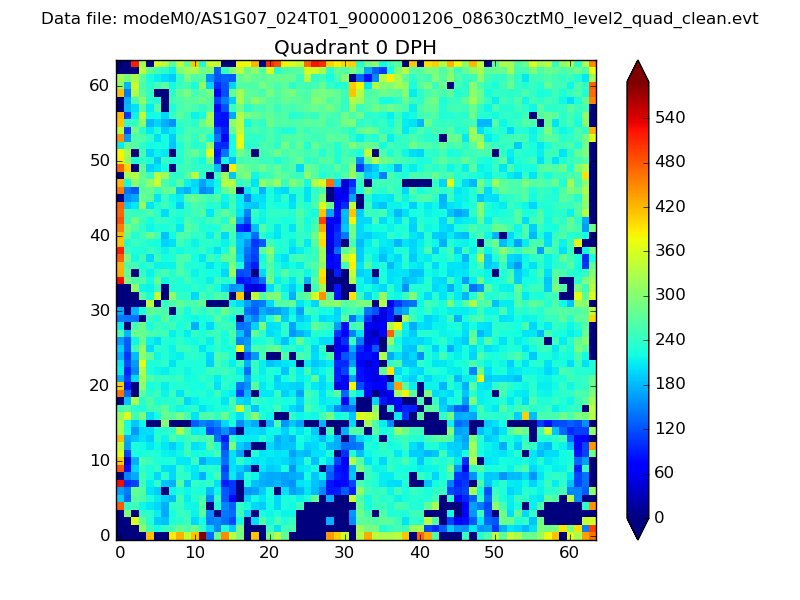 |
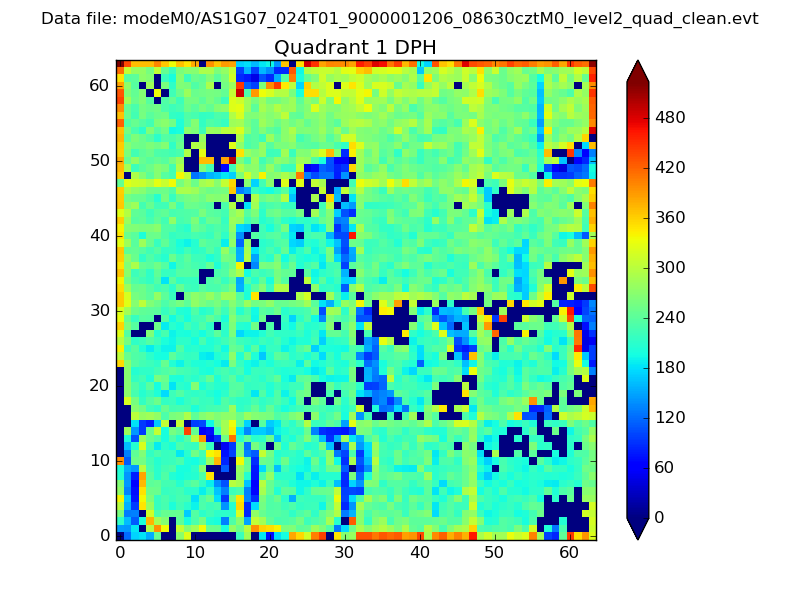 |
Quadrant B |
|---|---|---|---|
| Quadrant D | 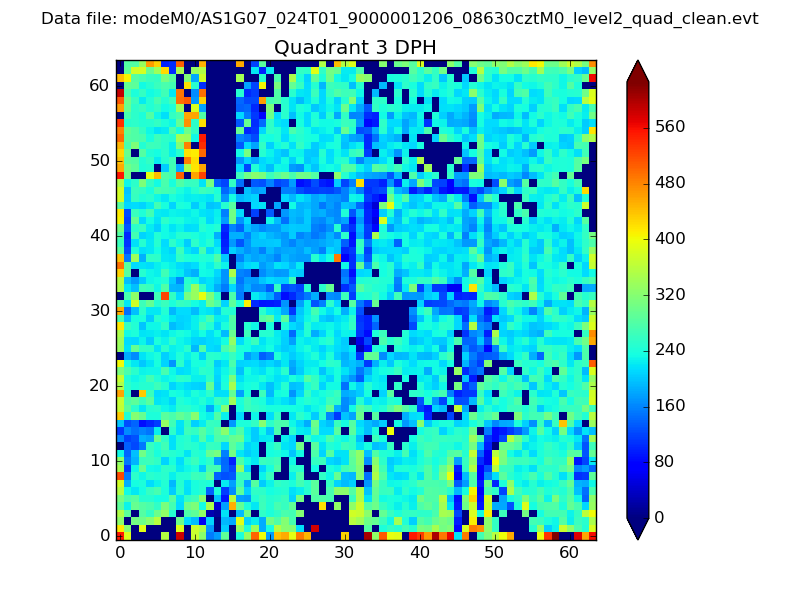 |
 |
Quadrant C |
| Plot type | Count rate plots | Images |
|---|---|---|
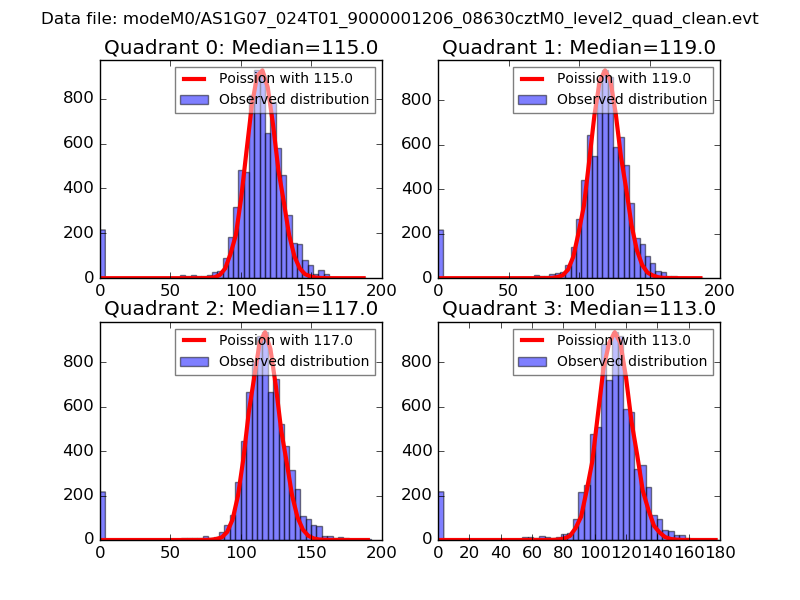
| Comparison with Poisson distribution Blue bars denote a histogram of data divided into 1 sec bins. Red curve is a Poisson curve with rate = median count rate of data. |
 |
 |
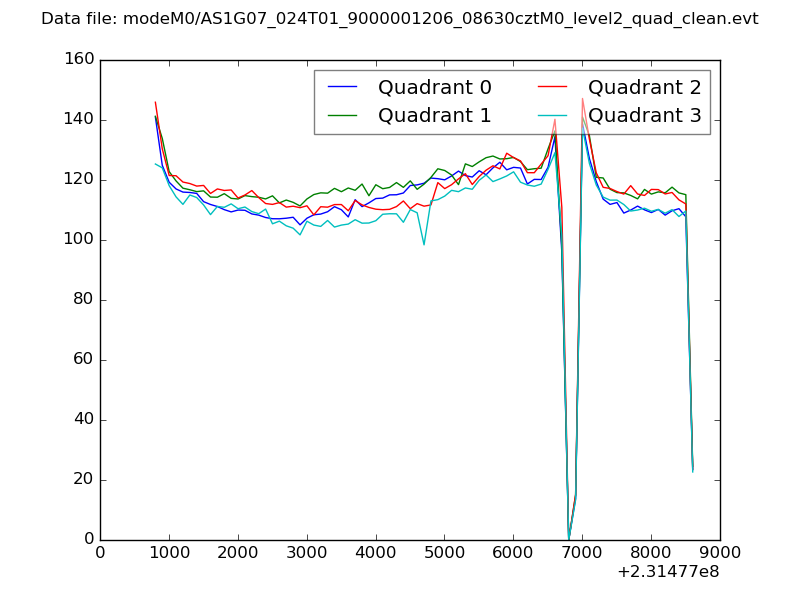
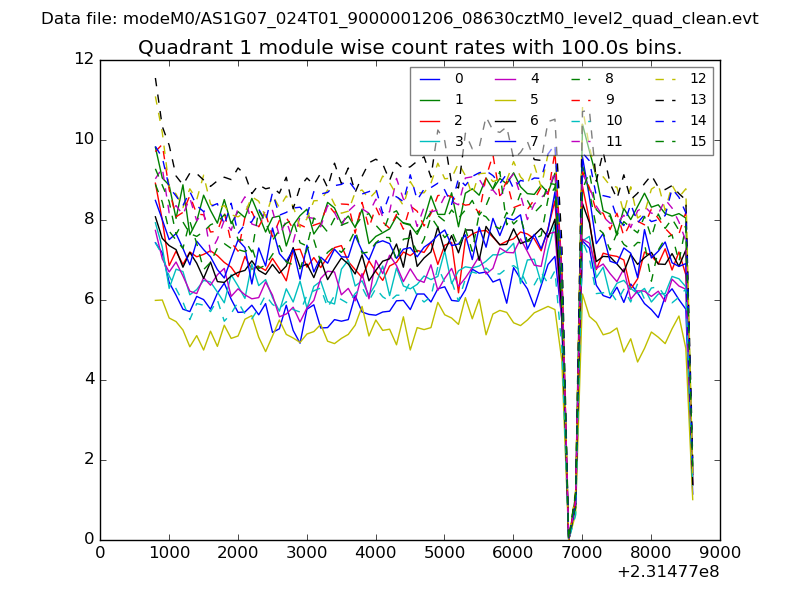
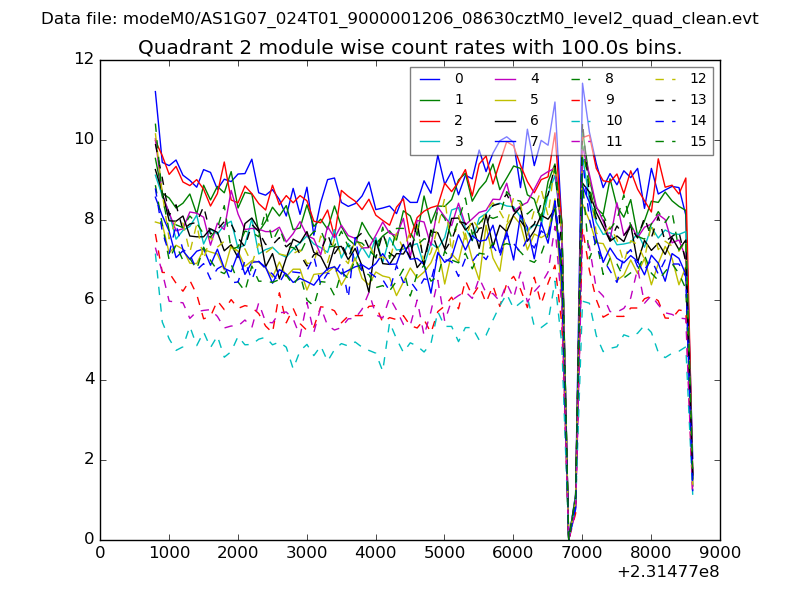
| Quadrant-wise count rates Data is divided into 100 sec bins |
 |
|
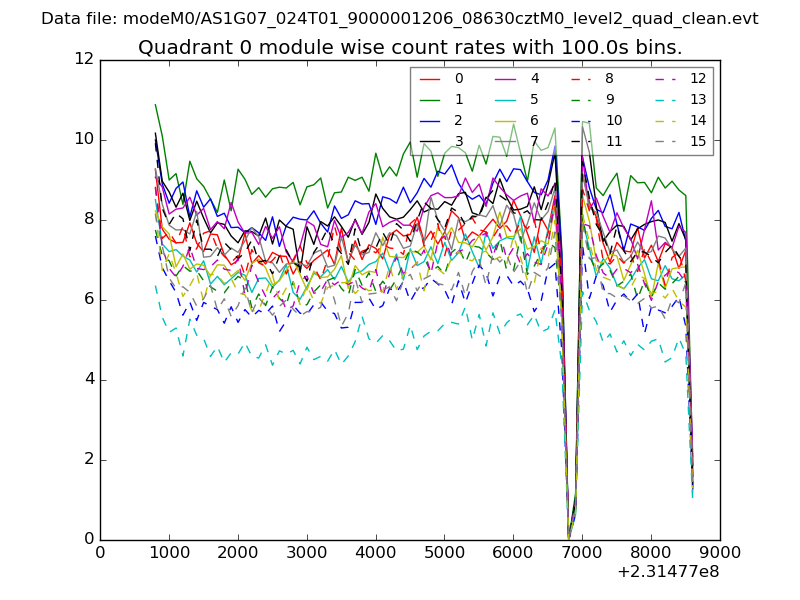
| Module-wise count rates for Quadrant A Data is divided into 100 sec bins |
 |
 |
| Module-wise count rates for Quadrant B Data is divided into 100 sec bins |
 |
 |
| Module-wise count rates for Quadrant C Data is divided into 100 sec bins |
 |
 |
| Module-wise count rates for Quadrant D Data is divided into 100 sec bins |
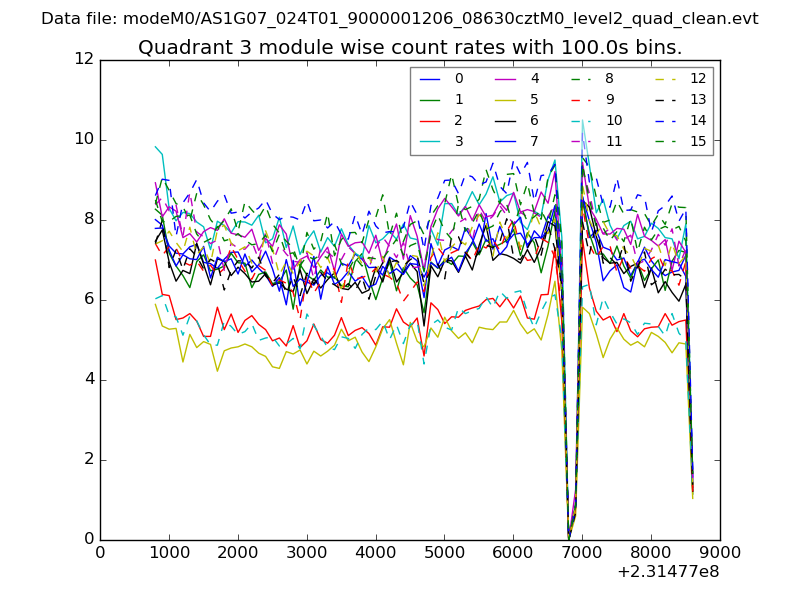 |
 |
| Parameter | Plot |
|---|---|
| CZT HV Monitor | 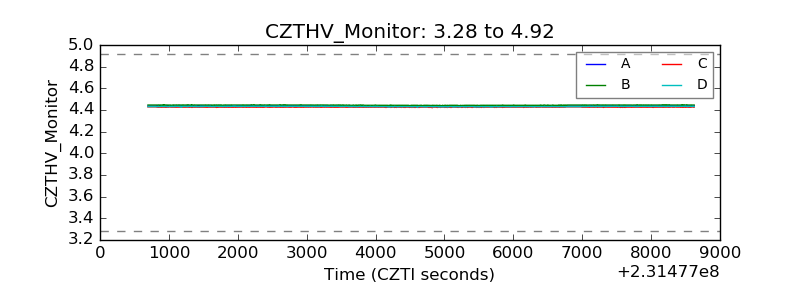 |
| D_VDD | 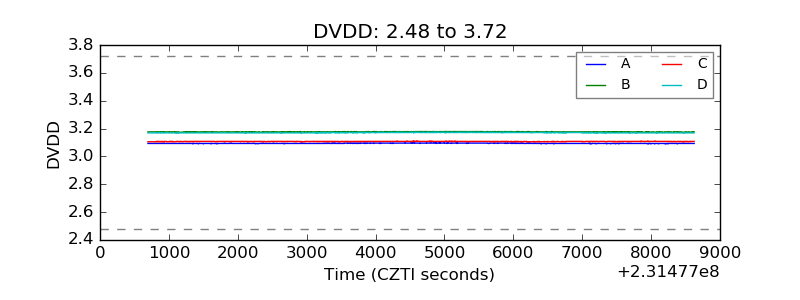 |
| Temperature 1 | 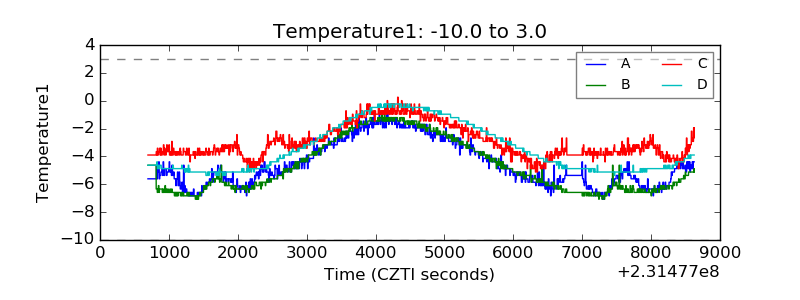 |
| Veto HV Monitor | 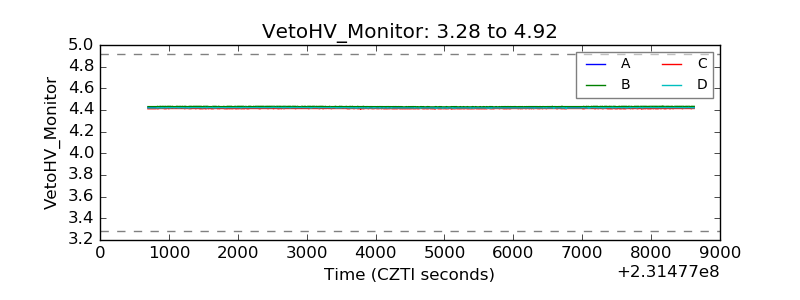 |
| Veto LLD | 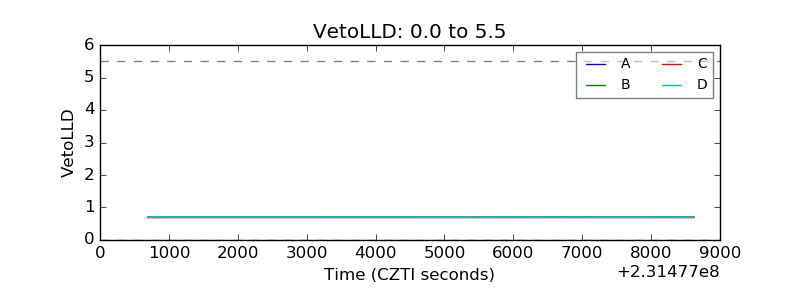 |
| Alpha Counter | 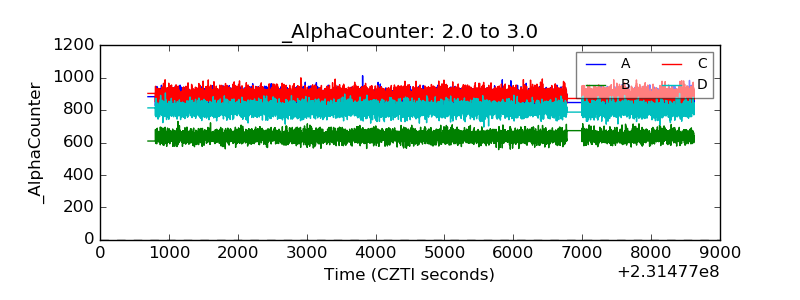 |
| _CPM_Rate | 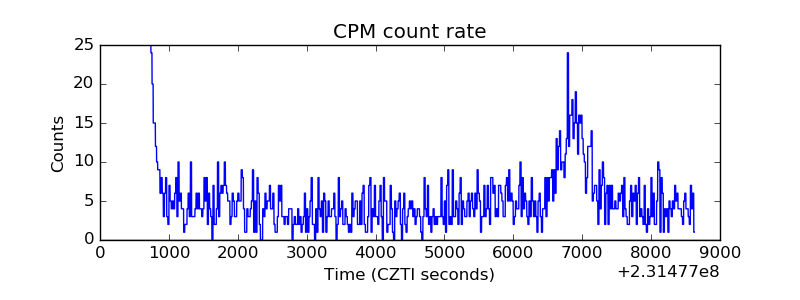 |
| CZT Counter | 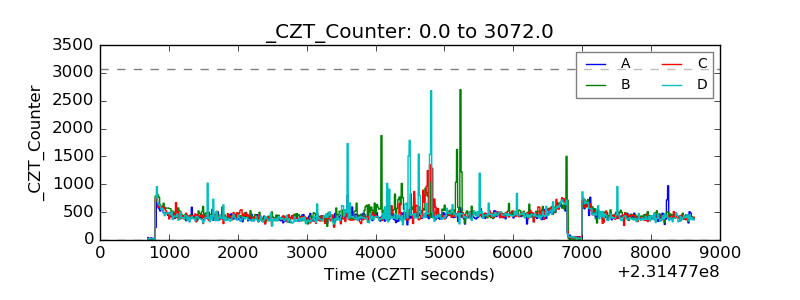 |
| +2.5 Volts monitor | 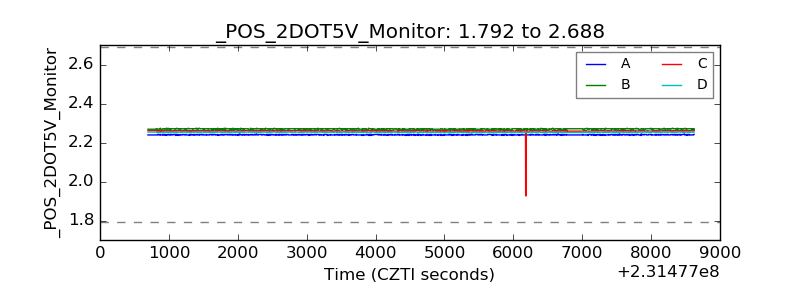 |
| +5 Volts monitor | 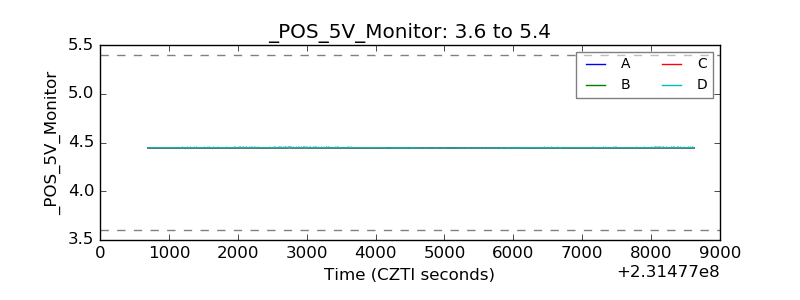 |
| _ROLL_ROT | 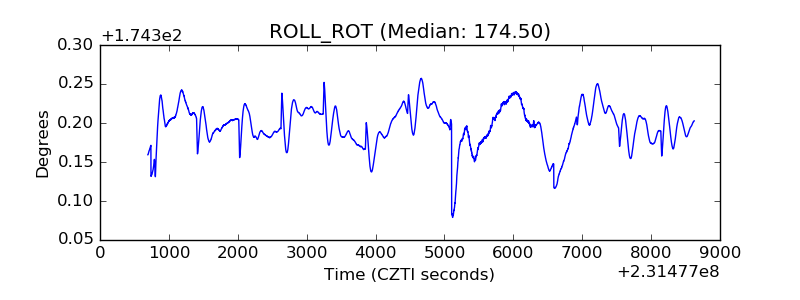 |
| _Roll_DEC | 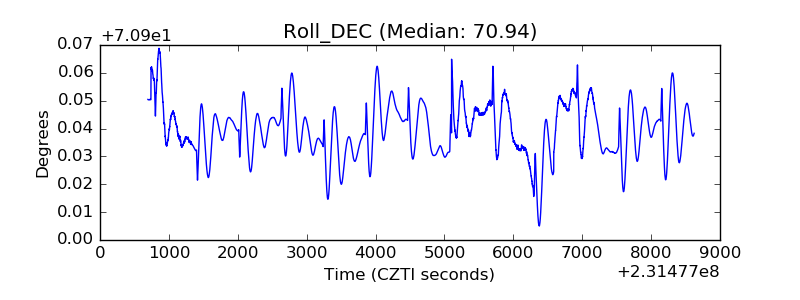 |
| _Roll_RA | 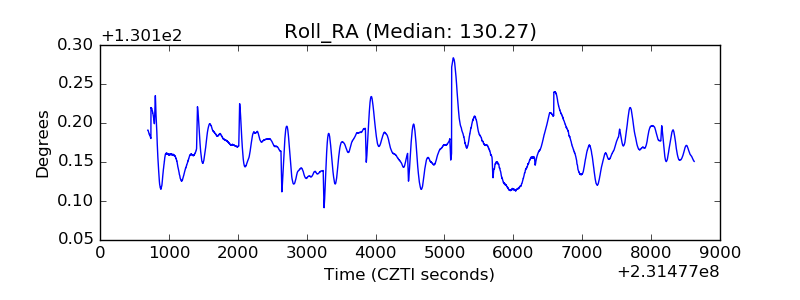 |
| Veto Counter | 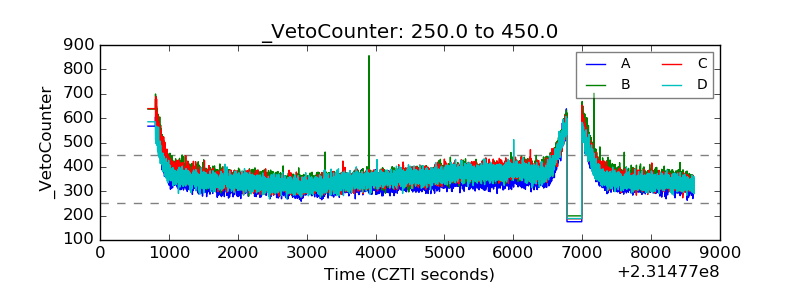 |