| Param | Original file | Final file |
|---|---|---|
| Filename | modeM0/AS1G07_024T01_9000001206_08631cztM0_level2.evt | modeM0/AS1G07_024T01_9000001206_08631cztM0_level2_quad_clean.evt |
| Size (bytes) | 435,758,400 | 123,347,520 |
| Size | 415.6 MB | 117.6 MB |
| Events in quadrant A | 3,076,824 | 805,867 |
| Events in quadrant B | 3,340,686 | 837,200 |
| Events in quadrant C | 3,039,149 | 820,737 |
| Events in quadrant D | 3,262,302 | 782,981 |
| Mode M0 | |||
|---|---|---|---|
| Quadrant | BADHDUFLAG | Total packets | Discarded packets |
| A | 0 | 14472 | 24 |
| B | 0 | 14822 | 20 |
| C | 0 | 14384 | 25 |
| D | 0 | 15100 | 27 |
| Mode M9 | |||
|---|---|---|---|
| Quadrant | BADHDUFLAG | Total packets | Discarded packets |
| A | 0 | 1 | 0 |
| B | 0 | 1 | 0 |
| C | 0 | 1 | 0 |
| D | 0 | 1 | 0 |
| Mode SS | |||
|---|---|---|---|
| Quadrant | BADHDUFLAG | Total packets | Discarded packets |
| A | 0 | 142 | 0 |
| B | 0 | 142 | 0 |
| C | 0 | 142 | 0 |
| D | 0 | 142 | 0 |
| Quadrant | Total seconds | Saturated seconds | Saturation percentage |
|---|---|---|---|
| A | 7022 | 177 | 2.520649% |
| B | 7024 | 148 | 2.107062% |
| C | 7021 | 65 | 0.925794% |
| D | 7021 | 108 | 1.538242% |
Noise dominated data is calculated using 1-second bins in cleaned event files. If a bin has >2000 counts, and if more than 50% of those come from <1% of pixels, then it is considered to be noise-dominated and hence unusable.
| Quadrant | # 1 sec bins | Bins with >0 counts | Bins with >2000 counts | High rate bins dominated by noise | Noise dominated (total time) | Noise dominated (detector-on time) | Marked lightcurve |
|---|---|---|---|---|---|---|---|
| A | 7108 | 7034 | 5 | 5 | 0.07% | 0.07% | 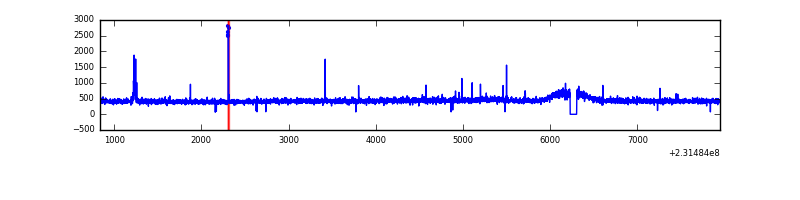 |
| B | 7108 | 7034 | 3 | 3 | 0.04% | 0.04% | 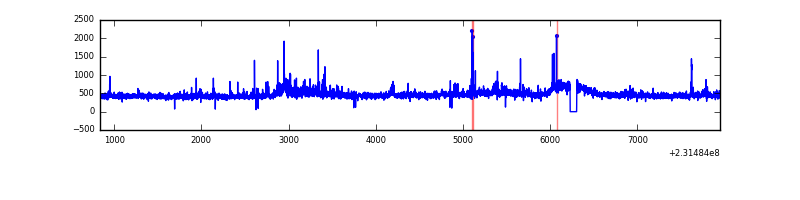 |
| C | 7108 | 7034 | 1 | 1 | 0.01% | 0.01% | 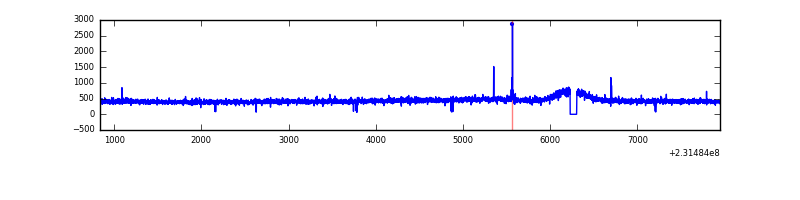 |
| D | 7108 | 7032 | 22 | 22 | 0.31% | 0.31% | 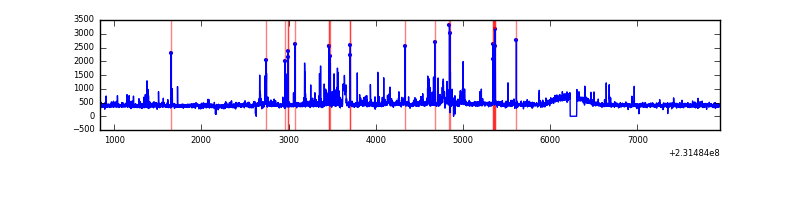 |
Top three noisy pixels from each quadrant. If the there are fewer than three noisy pixels in the level2.evt file, extra rows are filled as -1
| Pixel properties | Quadrant properties | ||||||
|---|---|---|---|---|---|---|---|
| Quadrant | DetID | PixID | Counts | Sigma | Mean | Median | Sigma |
| A | 15 | 174 | 45251 | 274.74 | 786 | 767 | 161.9 |
| A | 5 | 16 | 7312 | 40.42 | 786 | 767 | 161.9 |
| A | 0 | 226 | 7295 | 40.32 | 786 | 767 | 161.9 |
| B | 0 | 214 | 89870 | 582.83 | 798 | 777 | 152.9 |
| B | 11 | 51 | 89207 | 578.5 | 798 | 777 | 152.9 |
| B | 4 | 48 | 18444 | 115.58 | 798 | 777 | 152.9 |
| C | 14 | 234 | 12772 | 67.67 | 768 | 769 | 177.4 |
| C | 8 | 208 | 11245 | 59.06 | 768 | 769 | 177.4 |
| C | 8 | 222 | 6347 | 31.45 | 768 | 769 | 177.4 |
| D | 12 | 221 | 100463 | 530.92 | 766 | 741 | 187.8 |
| D | 10 | 253 | 98371 | 519.79 | 766 | 741 | 187.8 |
| D | 12 | 233 | 44749 | 234.3 | 766 | 741 | 187.8 |
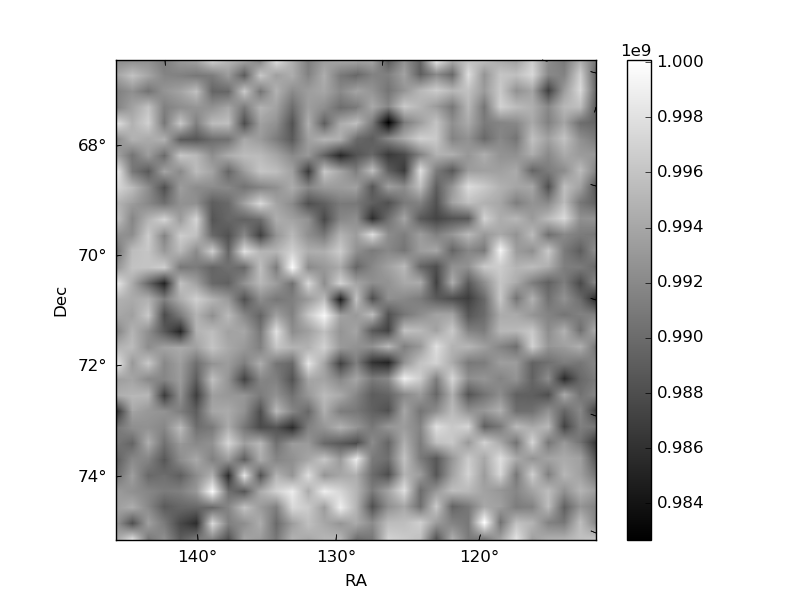
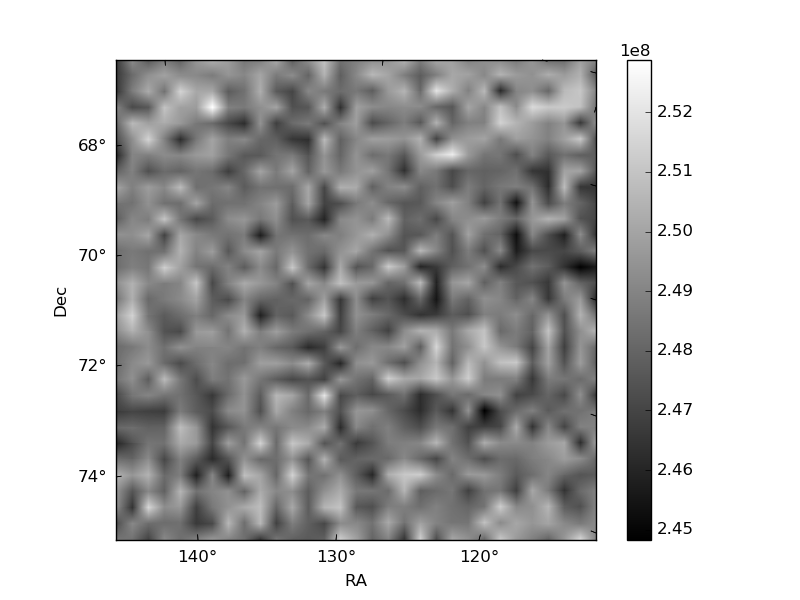
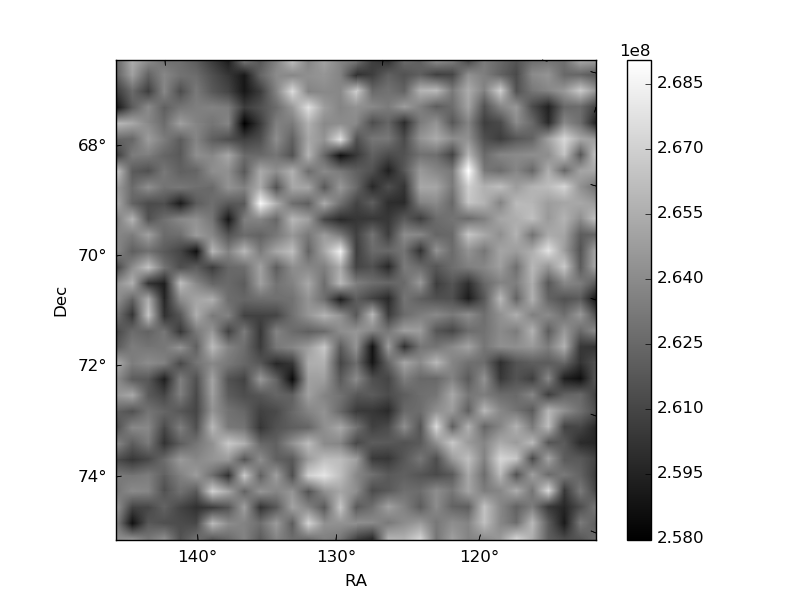
Histogram calculated using DETX and DETY for each event in the final _common_clean file
| Quadrant A | 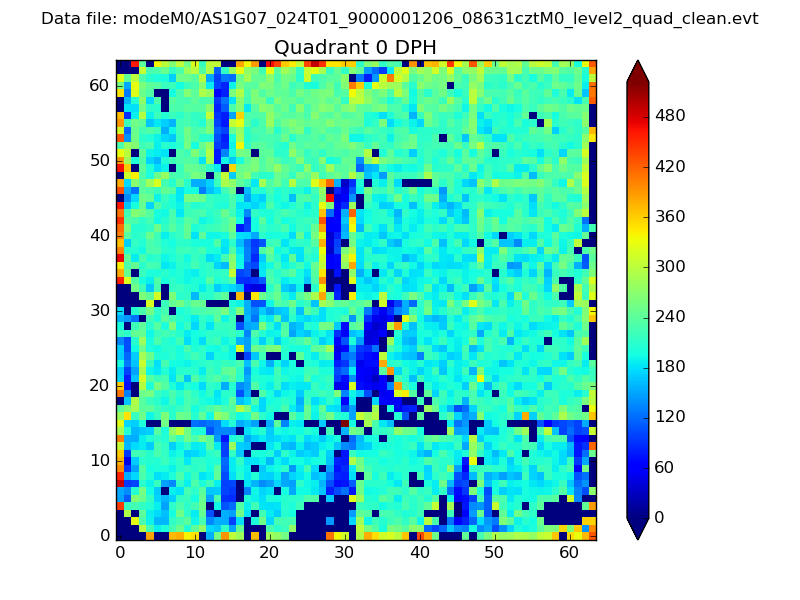 |
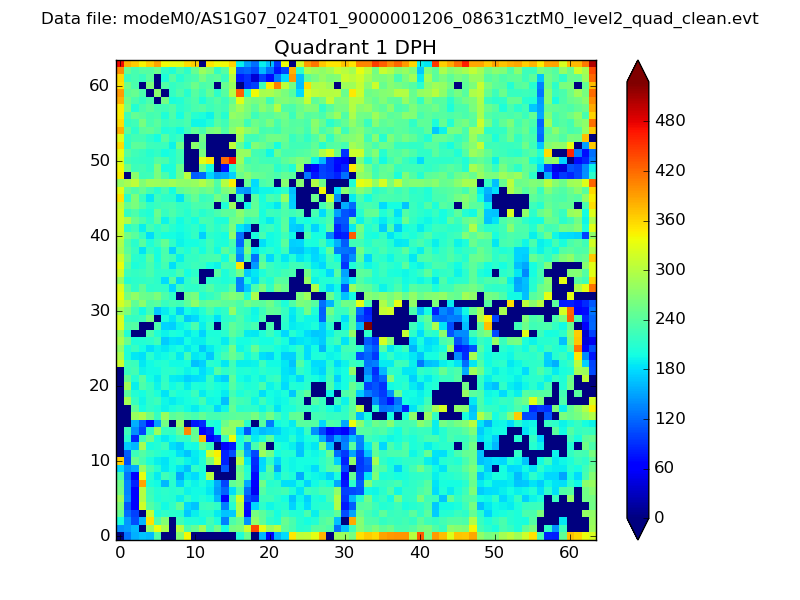 |
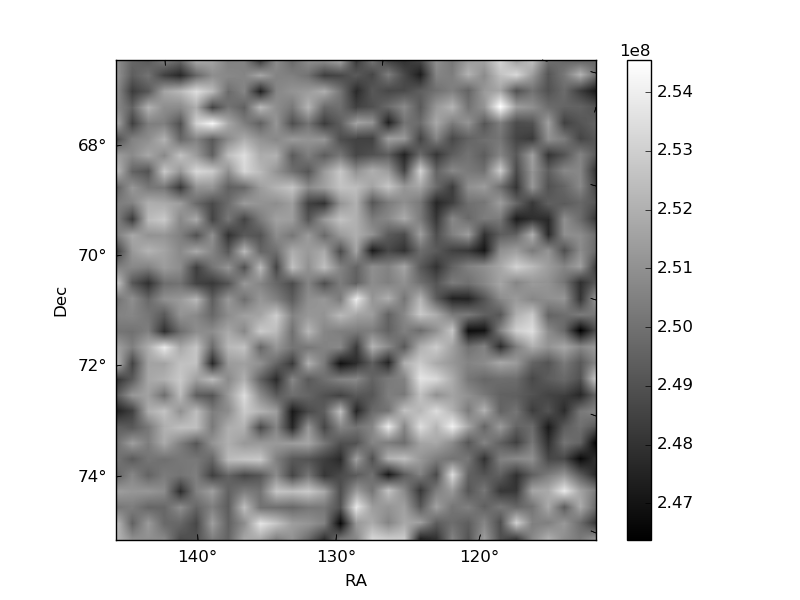
Quadrant B |
|---|---|---|---|
| Quadrant D | 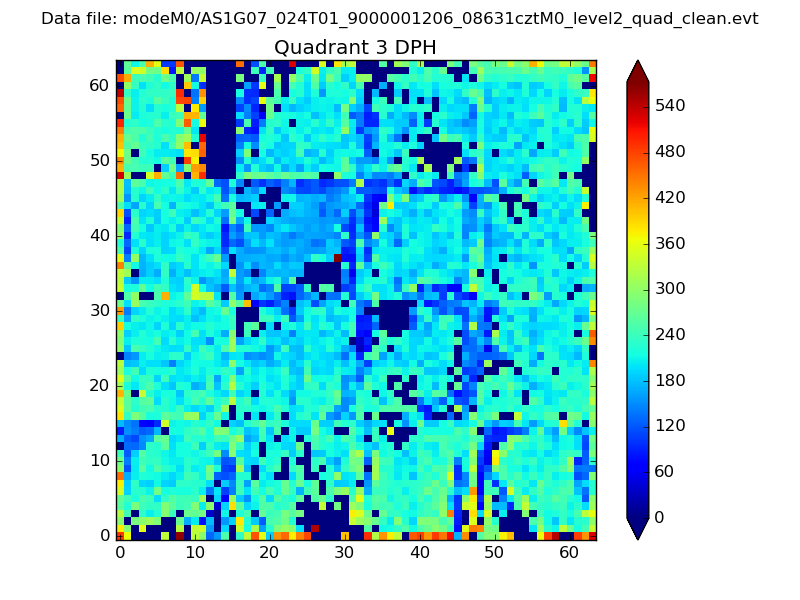 |
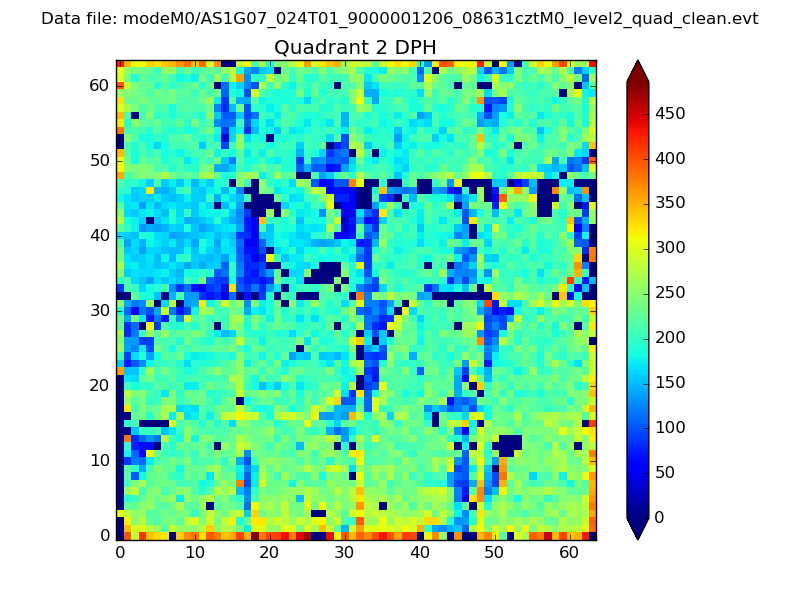 |
Quadrant C |
| Plot type | Count rate plots | Images |
|---|---|---|
| Comparison with Poisson distribution Blue bars denote a histogram of data divided into 1 sec bins. Red curve is a Poisson curve with rate = median count rate of data. |
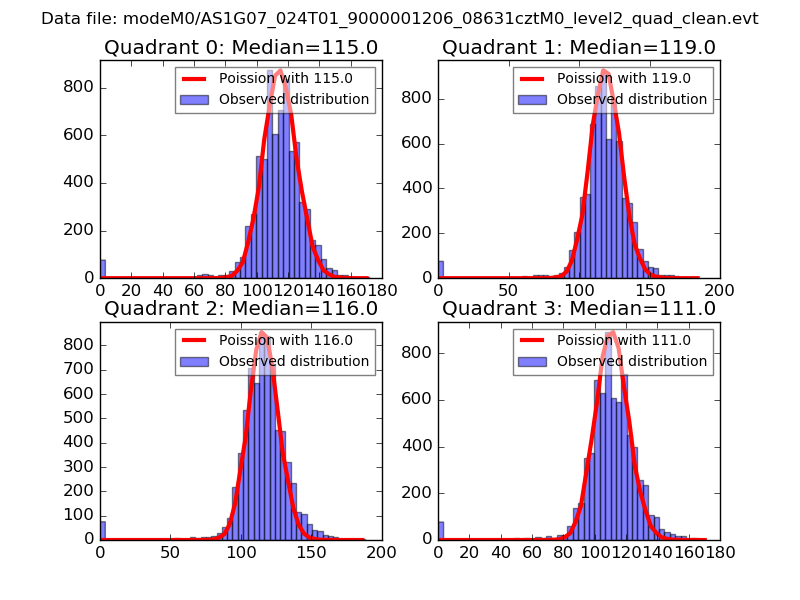 |
 |
| Quadrant-wise count rates Data is divided into 100 sec bins |
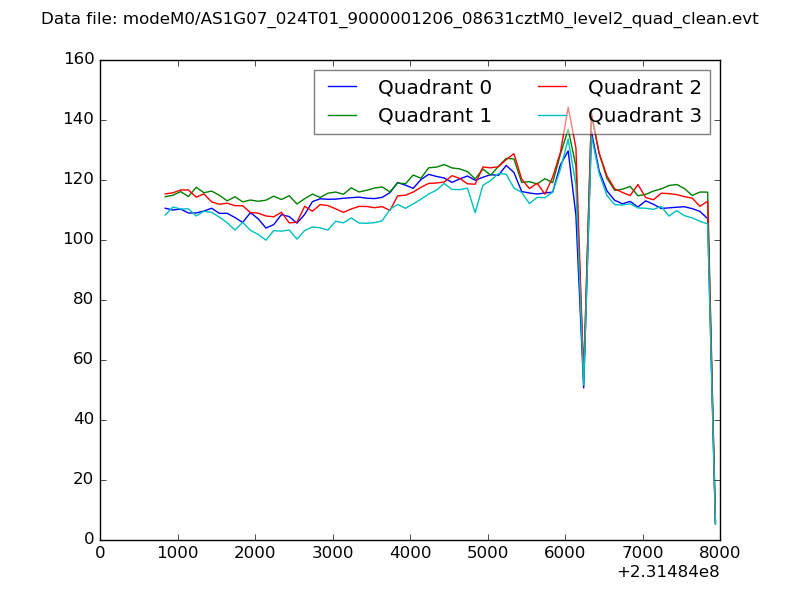 |
|
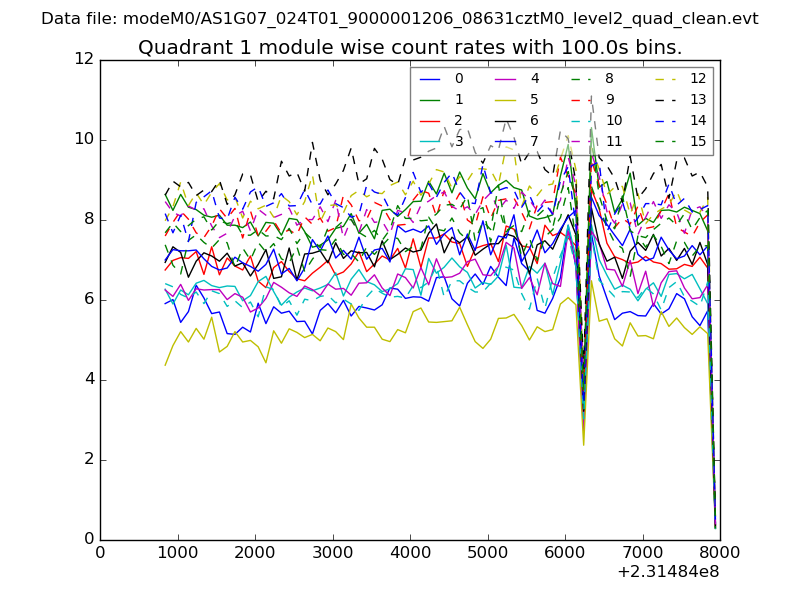
| Module-wise count rates for Quadrant A Data is divided into 100 sec bins |
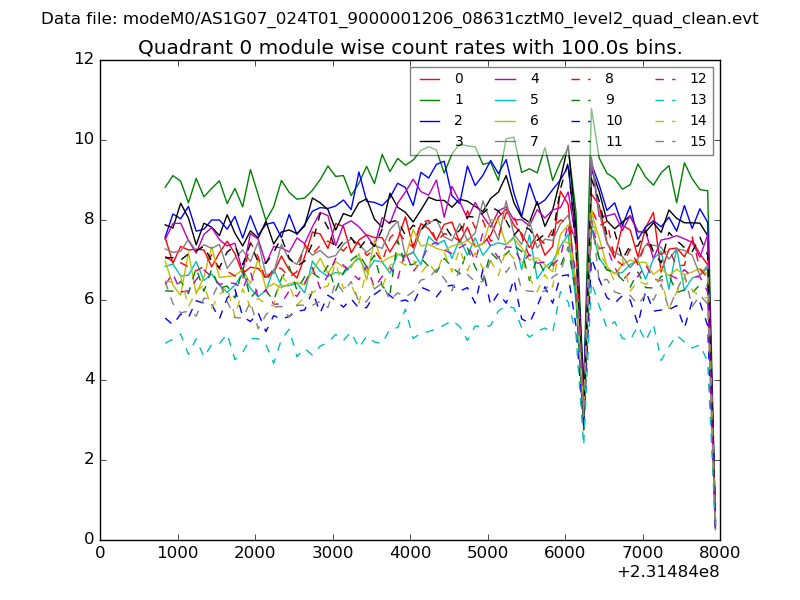 |
 |
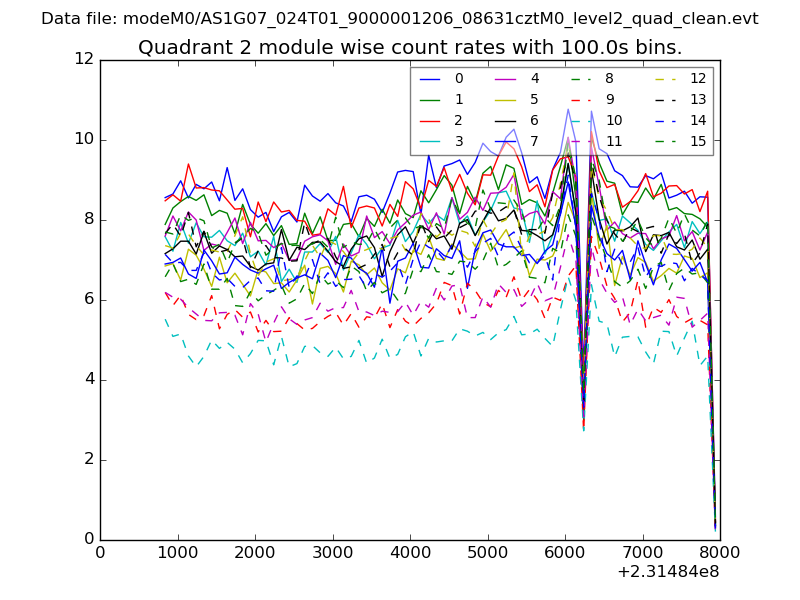
| Module-wise count rates for Quadrant B Data is divided into 100 sec bins |
 |
 |
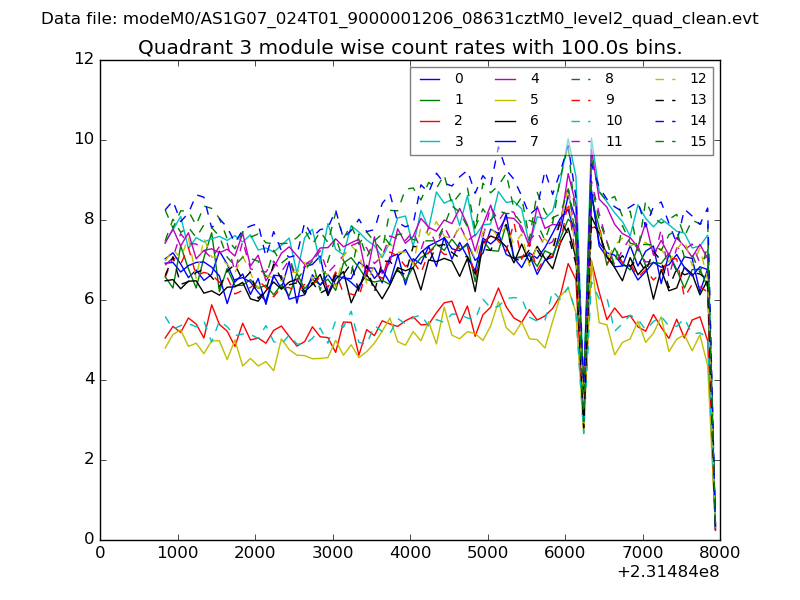
| Module-wise count rates for Quadrant C Data is divided into 100 sec bins |
 |
 |
| Module-wise count rates for Quadrant D Data is divided into 100 sec bins |
 |
 |
| Parameter | Plot |
|---|---|
| CZT HV Monitor | 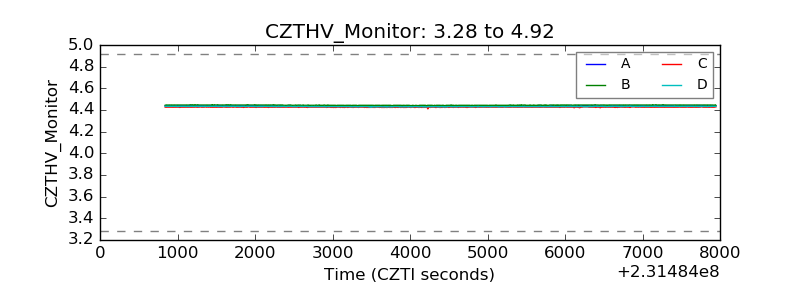 |
| D_VDD | 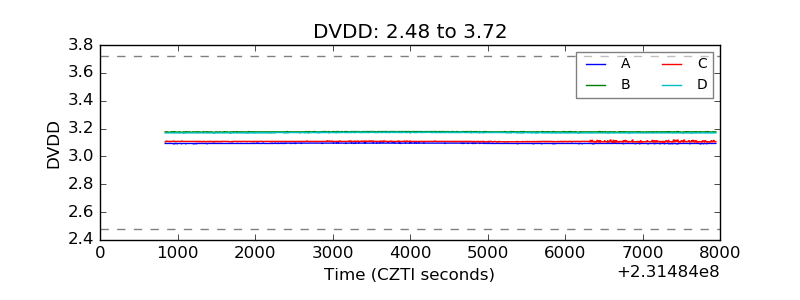 |
| Temperature 1 | 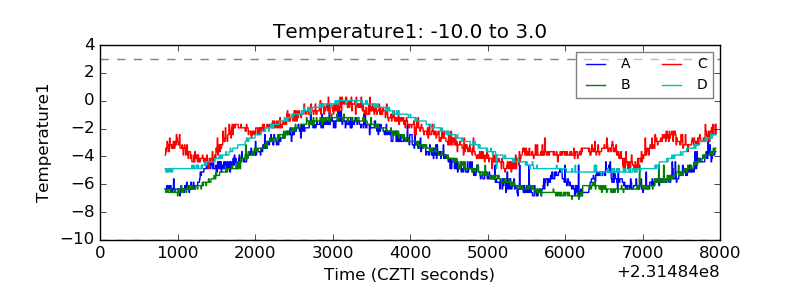 |
| Veto HV Monitor |  |
| Veto LLD | 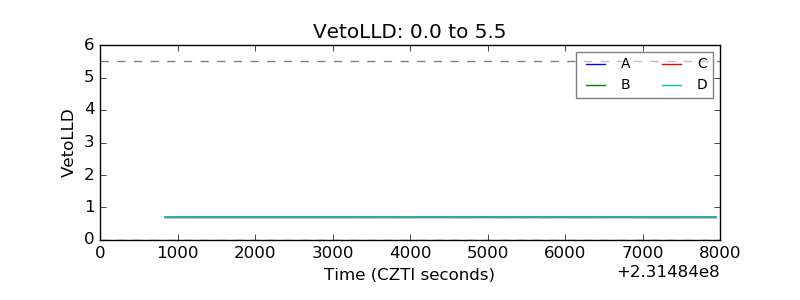 |
| Alpha Counter | 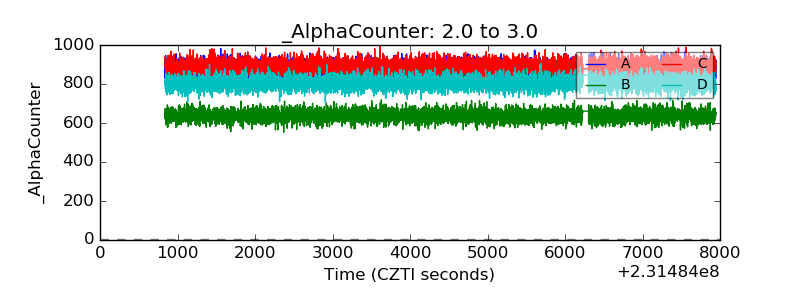 |
| _CPM_Rate | 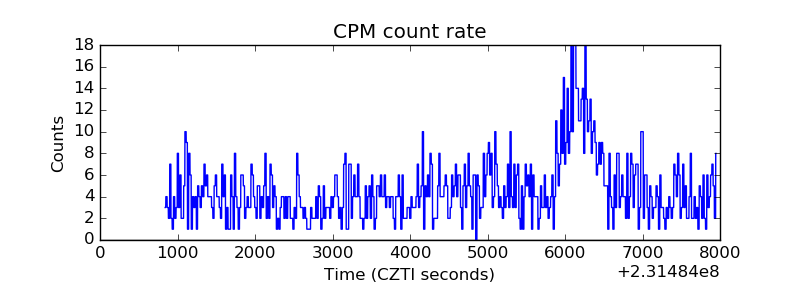 |
| CZT Counter | 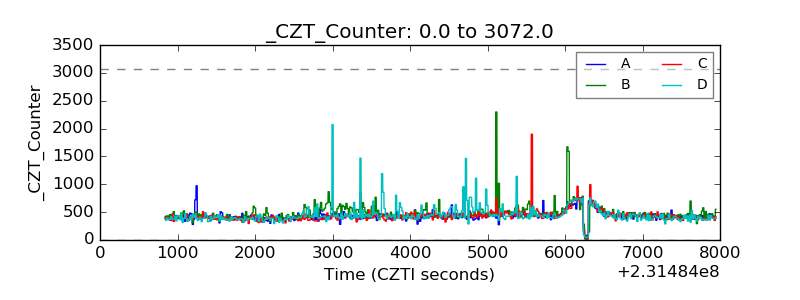 |
| +2.5 Volts monitor |  |
| +5 Volts monitor |  |
| _ROLL_ROT | 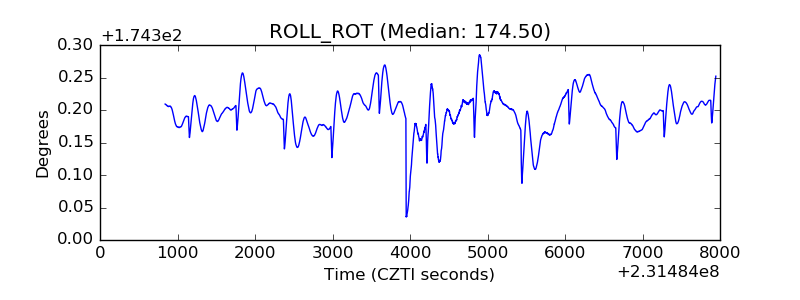 |
| _Roll_DEC | 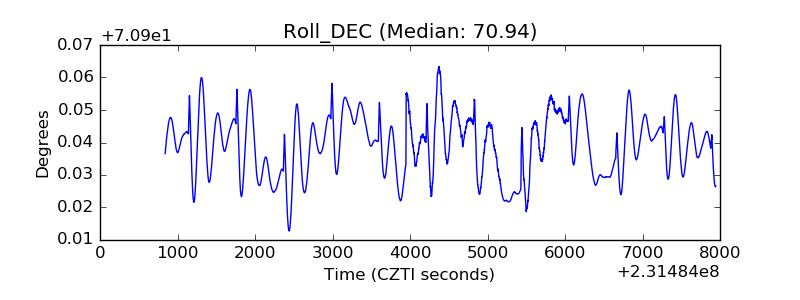 |
| _Roll_RA | 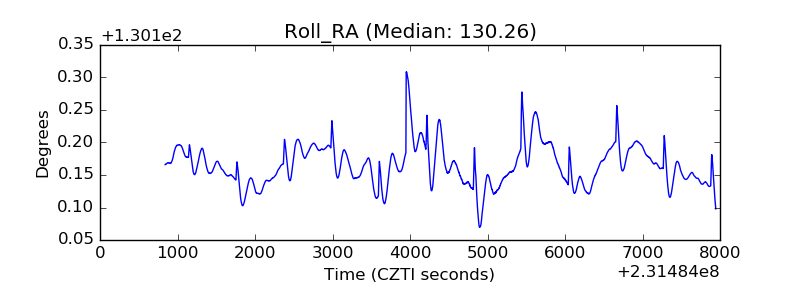 |
| Veto Counter | 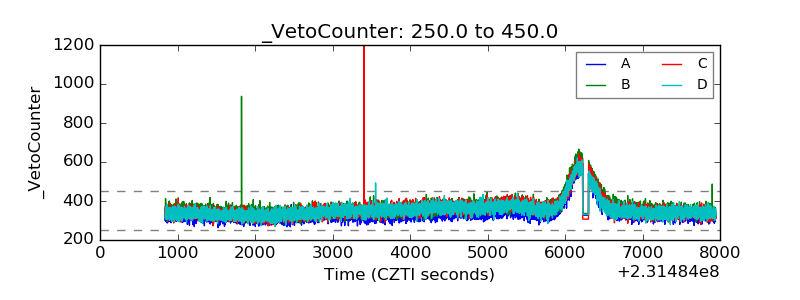 |