| Param | Original file | Final file |
|---|---|---|
| Filename | modeM0/AS1G07_024T01_9000001206_08635cztM0_level2.evt | modeM0/AS1G07_024T01_9000001206_08635cztM0_level2_quad_clean.evt |
| Size (bytes) | 1,103,146,560 | 309,090,240 |
| Size | 1.0 GB | 294.8 MB |
| Events in quadrant A | 7,705,913 | 2,045,980 |
| Events in quadrant B | 8,384,879 | 2,096,670 |
| Events in quadrant C | 7,732,088 | 2,043,102 |
| Events in quadrant D | 8,394,756 | 1,964,235 |
| Mode M0 | |||
|---|---|---|---|
| Quadrant | BADHDUFLAG | Total packets | Discarded packets |
| A | 0 | 35852 | 6 |
| B | 0 | 36798 | 8 |
| C | 0 | 35707 | 9 |
| D | 0 | 37749 | 8 |
| Mode M9 | |||
|---|---|---|---|
| Quadrant | BADHDUFLAG | Total packets | Discarded packets |
| A | 0 | 21 | 0 |
| B | 0 | 21 | 0 |
| C | 0 | 21 | 0 |
| D | 0 | 21 | 0 |
| Mode SS | |||
|---|---|---|---|
| Quadrant | BADHDUFLAG | Total packets | Discarded packets |
| A | 0 | 356 | 0 |
| B | 0 | 356 | 0 |
| C | 0 | 356 | 0 |
| D | 0 | 356 | 0 |
| Quadrant | Total seconds | Saturated seconds | Saturation percentage |
|---|---|---|---|
| A | 17601 | 171 | 0.971536% |
| B | 17600 | 141 | 0.801136% |
| C | 17599 | 84 | 0.477300% |
| D | 17600 | 228 | 1.295455% |
Noise dominated data is calculated using 1-second bins in cleaned event files. If a bin has >2000 counts, and if more than 50% of those come from <1% of pixels, then it is considered to be noise-dominated and hence unusable.
| Quadrant | # 1 sec bins | Bins with >0 counts | Bins with >2000 counts | High rate bins dominated by noise | Noise dominated (total time) | Noise dominated (detector-on time) | Marked lightcurve |
|---|---|---|---|---|---|---|---|
| A | 19657 | 17603 | 8 | 8 | 0.04% | 0.05% | 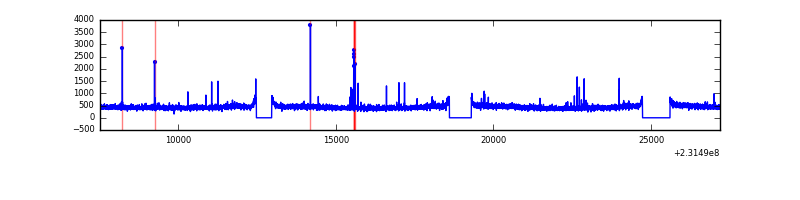 |
| B | 19657 | 17604 | 14 | 14 | 0.07% | 0.08% | 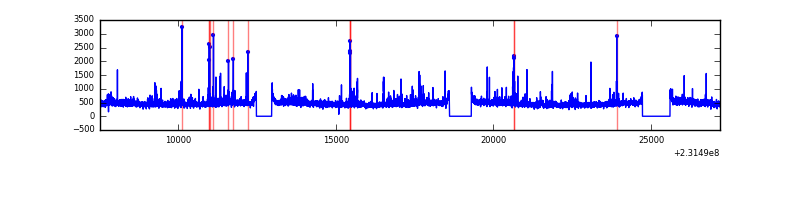 |
| C | 19657 | 17603 | 0 | 0 | 0.00% | 0.00% | 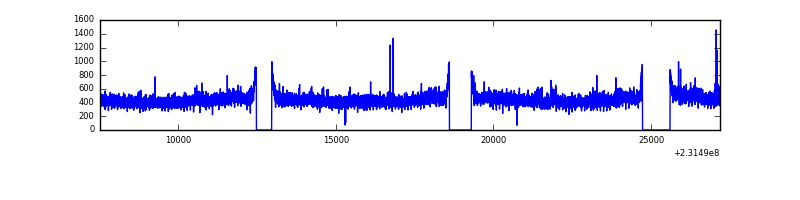 |
| D | 19657 | 17603 | 80 | 80 | 0.41% | 0.45% |  |
Top three noisy pixels from each quadrant. If the there are fewer than three noisy pixels in the level2.evt file, extra rows are filled as -1
| Pixel properties | Quadrant properties | ||||||
|---|---|---|---|---|---|---|---|
| Quadrant | DetID | PixID | Counts | Sigma | Mean | Median | Sigma |
| A | 15 | 174 | 61936 | 148.71 | 1981 | 1935 | 403.5 |
| A | 5 | 16 | 19300 | 43.04 | 1981 | 1935 | 403.5 |
| A | 0 | 226 | 18633 | 41.38 | 1981 | 1935 | 403.5 |
| B | 0 | 214 | 184787 | 480.66 | 2000 | 1953 | 380.4 |
| B | 4 | 173 | 91782 | 236.16 | 2000 | 1953 | 380.4 |
| B | 0 | 168 | 65389 | 166.77 | 2000 | 1953 | 380.4 |
| C | 14 | 67 | 98996 | 217.78 | 1933 | 1937 | 445.7 |
| C | 8 | 208 | 55375 | 119.91 | 1933 | 1937 | 445.7 |
| C | 8 | 222 | 16692 | 33.11 | 1933 | 1937 | 445.7 |
| D | 12 | 221 | 271447 | 568.99 | 1932 | 1870 | 473.8 |
| D | 13 | 29 | 147576 | 307.54 | 1932 | 1870 | 473.8 |
| D | 13 | 105 | 147141 | 306.62 | 1932 | 1870 | 473.8 |
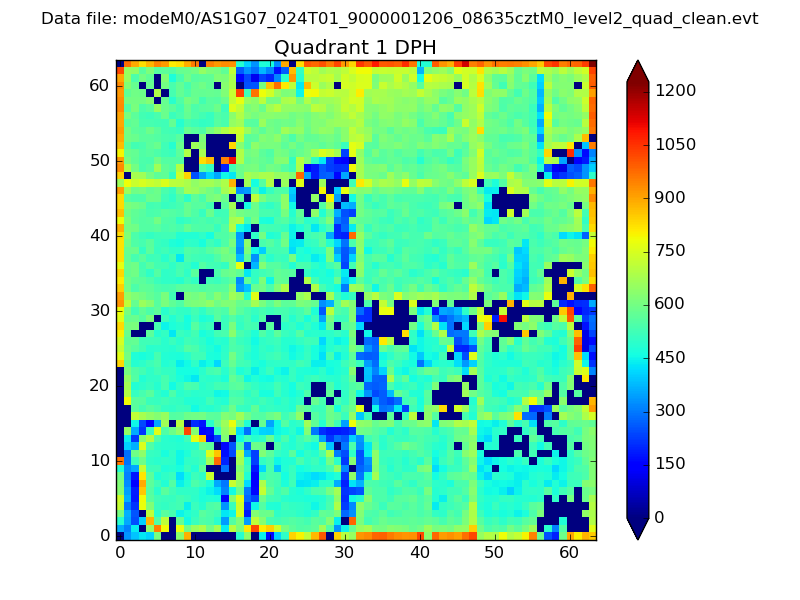
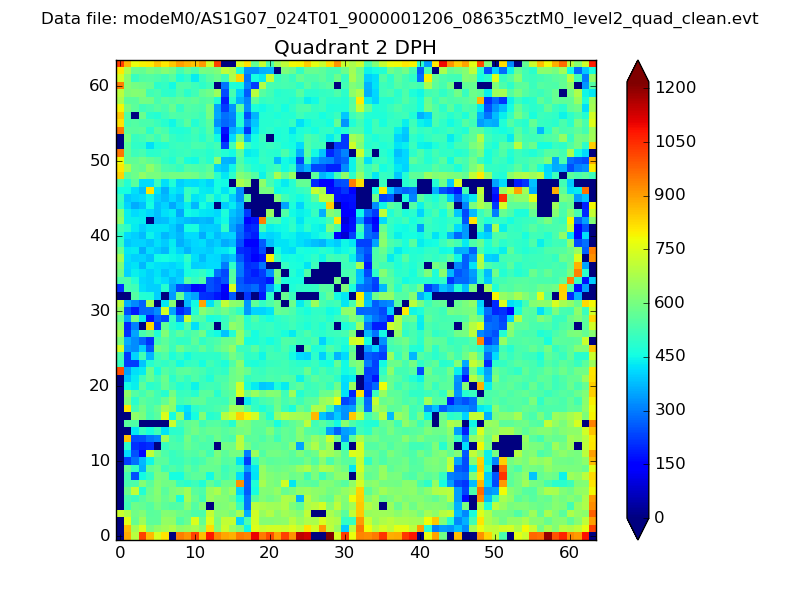
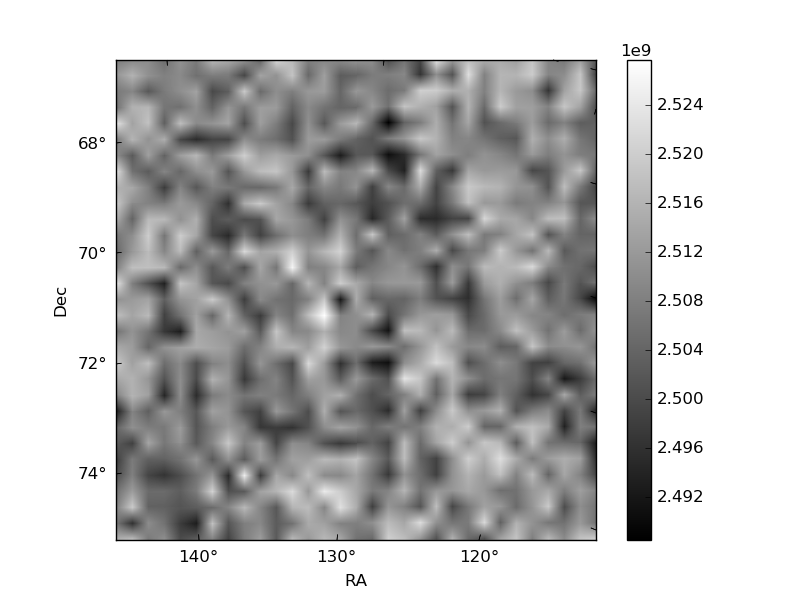
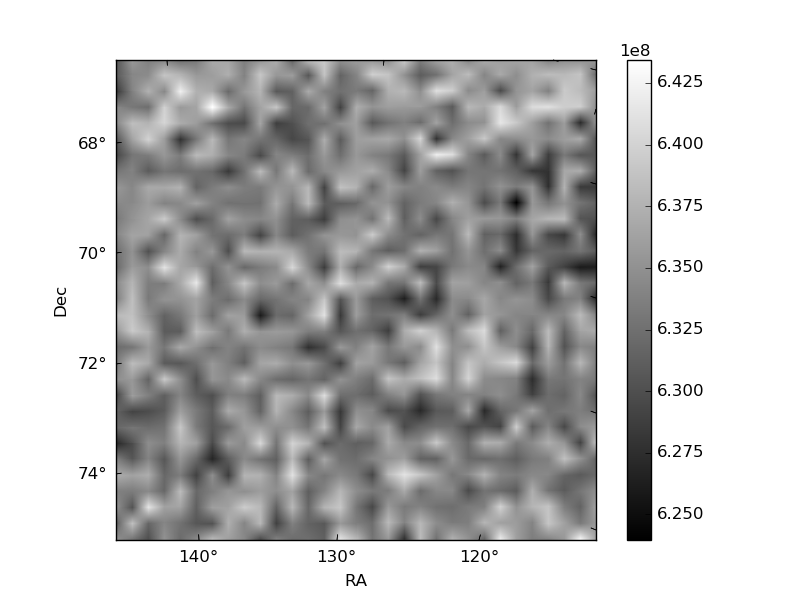
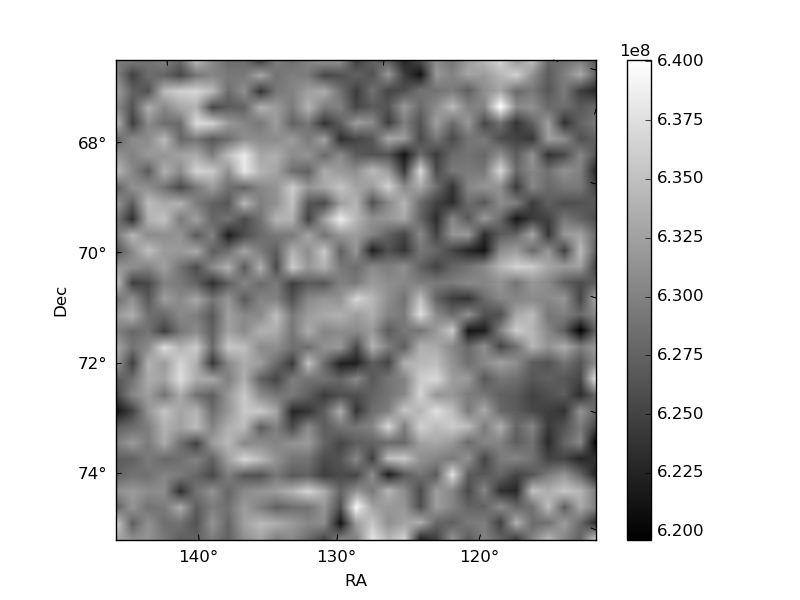
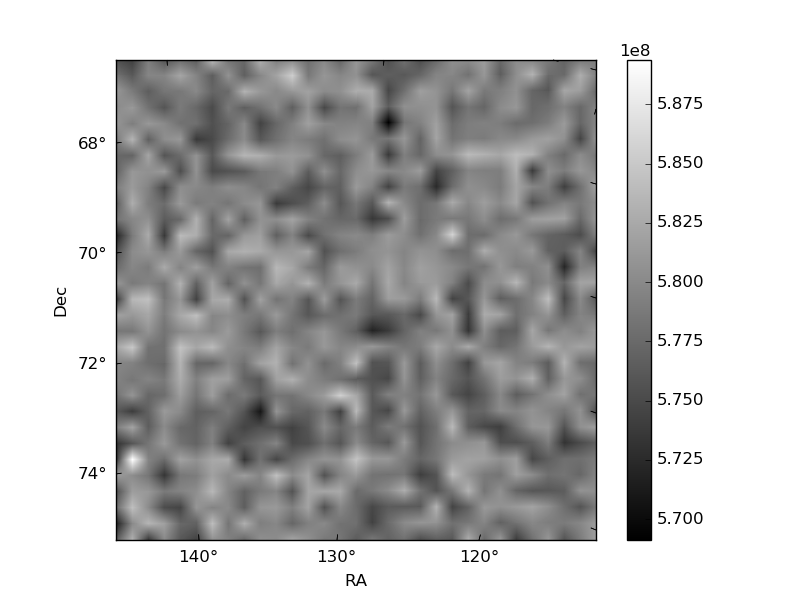
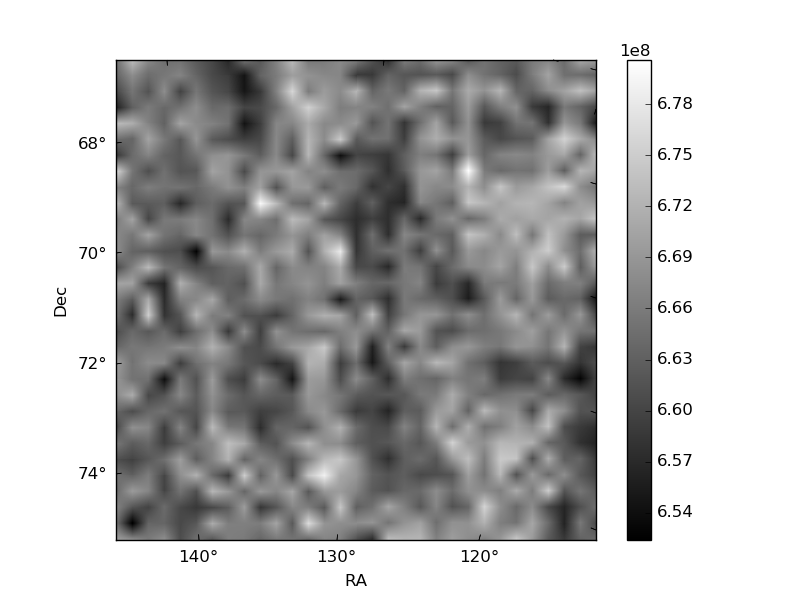
Histogram calculated using DETX and DETY for each event in the final _common_clean file
| Quadrant A | 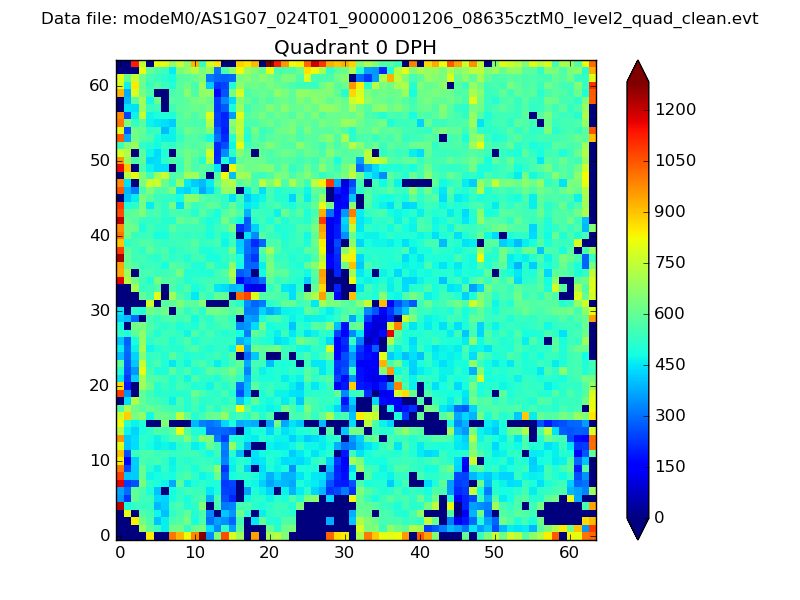 |
 |
Quadrant B |
|---|---|---|---|
| Quadrant D | 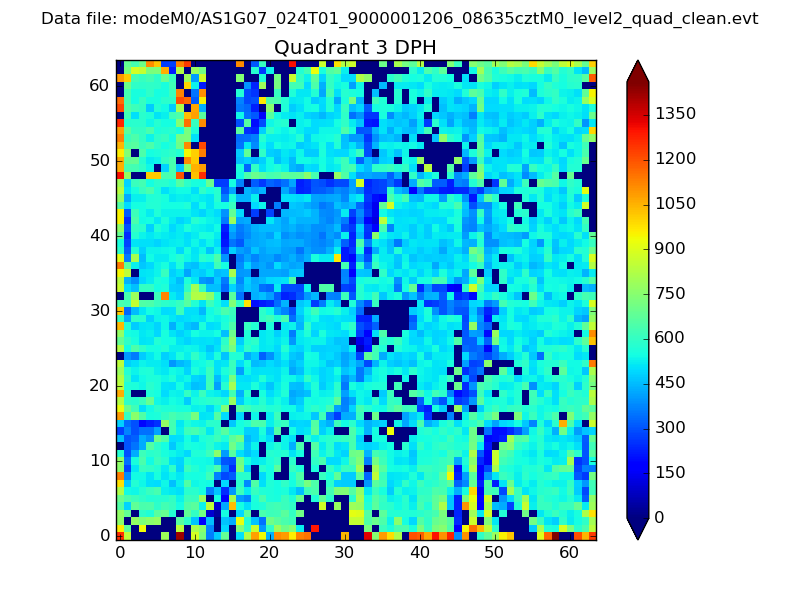 |
 |
Quadrant C |
| Plot type | Count rate plots | Images |
|---|---|---|
| Comparison with Poisson distribution Blue bars denote a histogram of data divided into 1 sec bins. Red curve is a Poisson curve with rate = median count rate of data. |
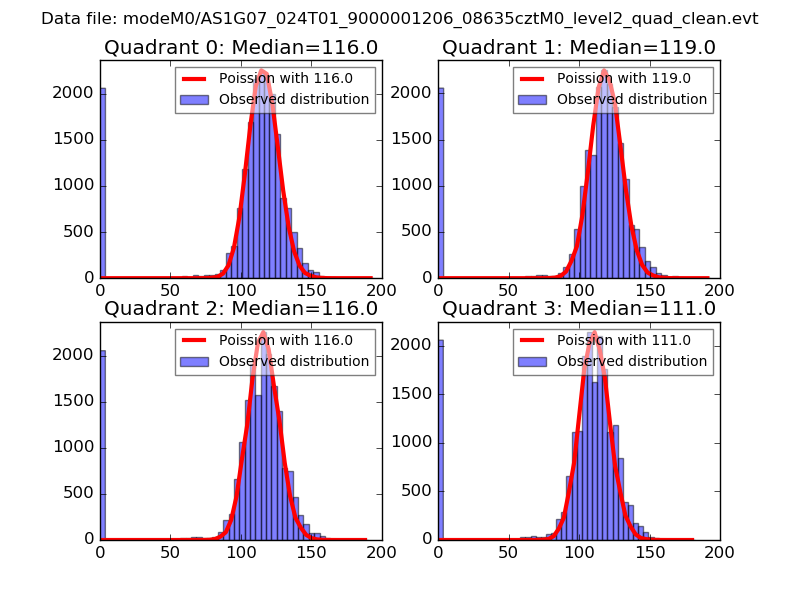 |
 |
| Quadrant-wise count rates Data is divided into 100 sec bins |
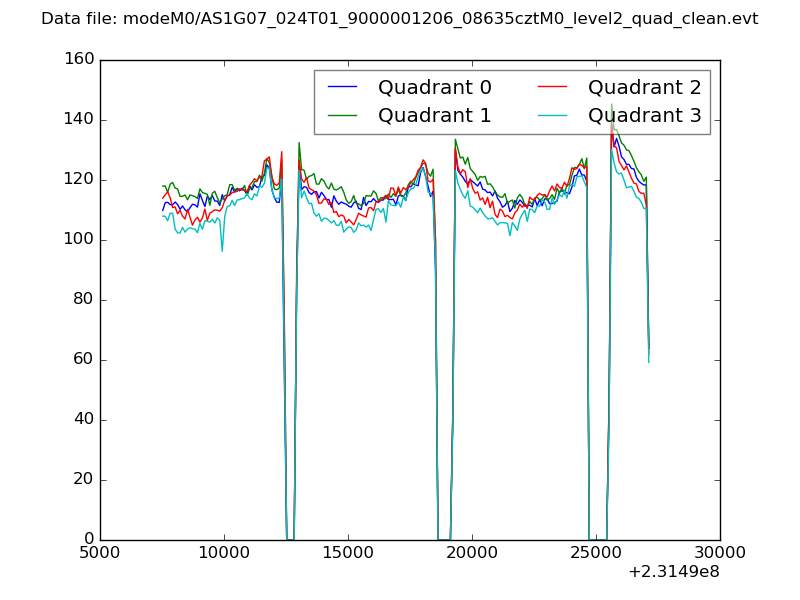 |
|
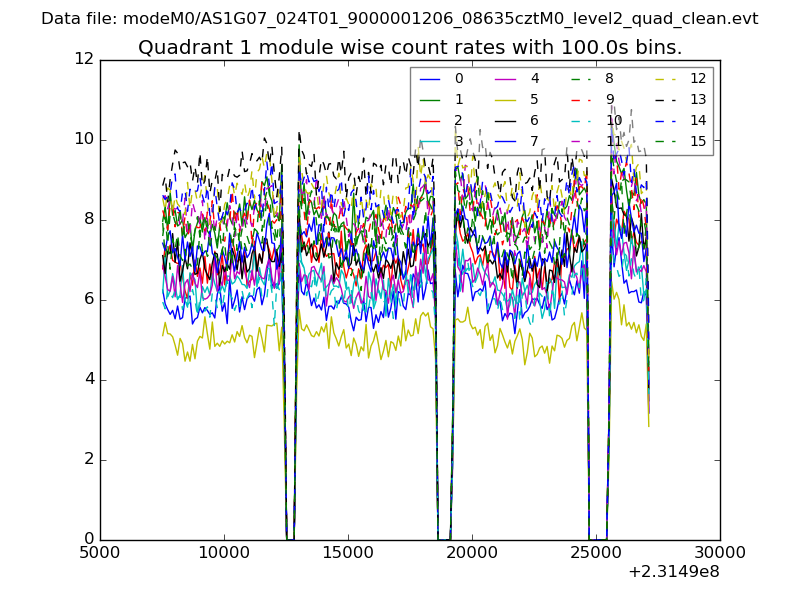
| Module-wise count rates for Quadrant A Data is divided into 100 sec bins |
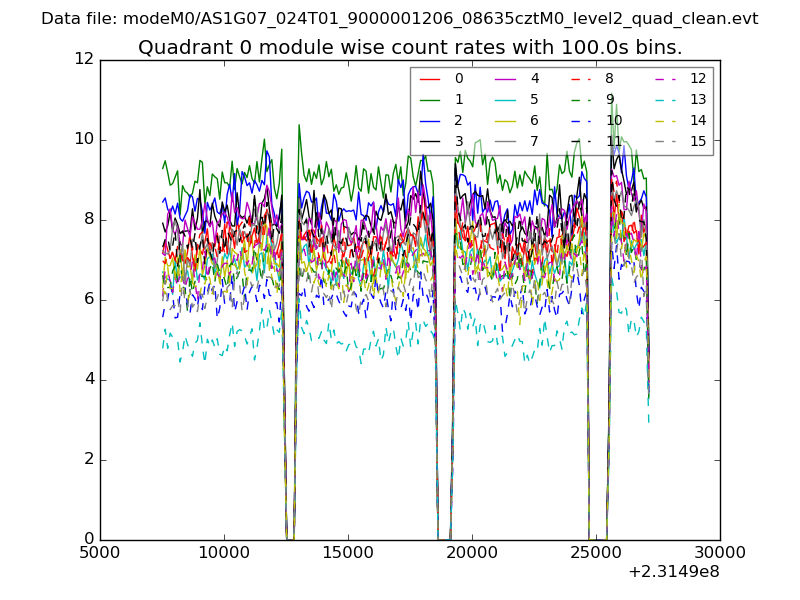 |
 |
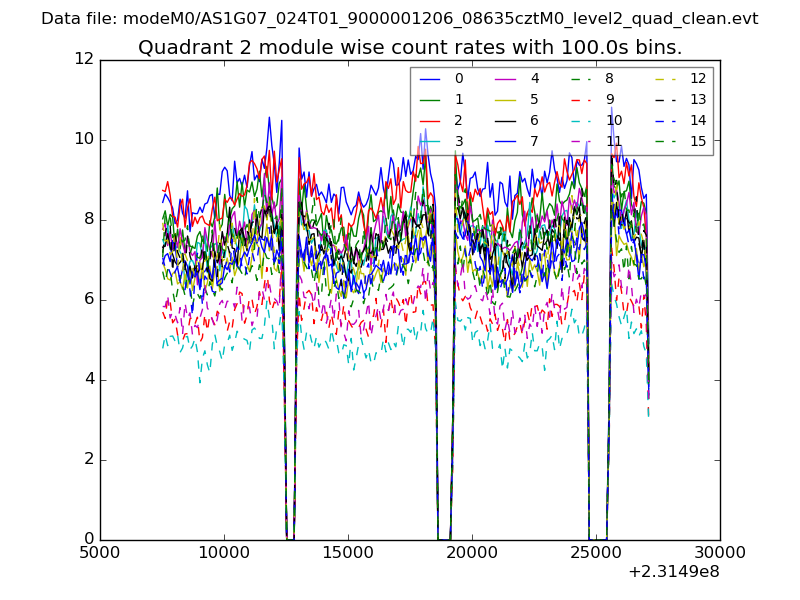
| Module-wise count rates for Quadrant B Data is divided into 100 sec bins |
 |
 |
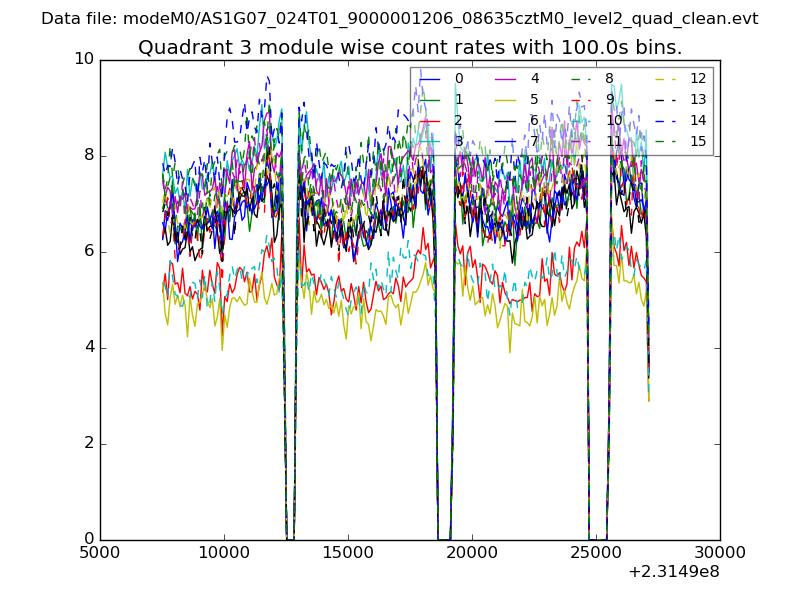
| Module-wise count rates for Quadrant C Data is divided into 100 sec bins |
 |
 |
| Module-wise count rates for Quadrant D Data is divided into 100 sec bins |
 |
 |
| Parameter | Plot |
|---|---|
| CZT HV Monitor | 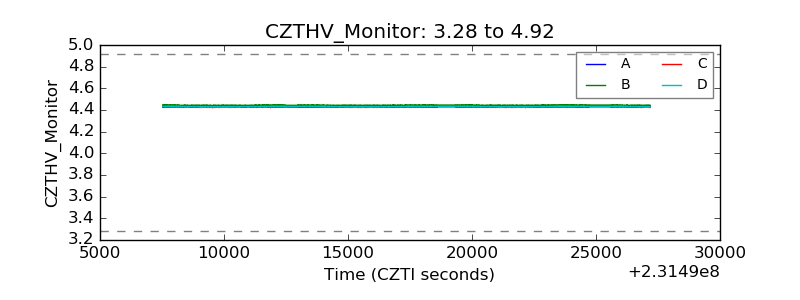 |
| D_VDD |  |
| Temperature 1 | 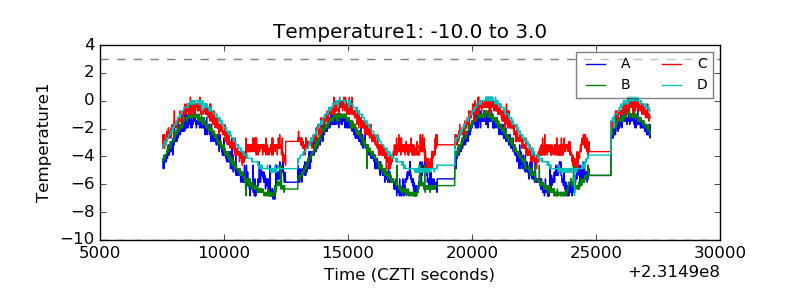 |
| Veto HV Monitor |  |
| Veto LLD | 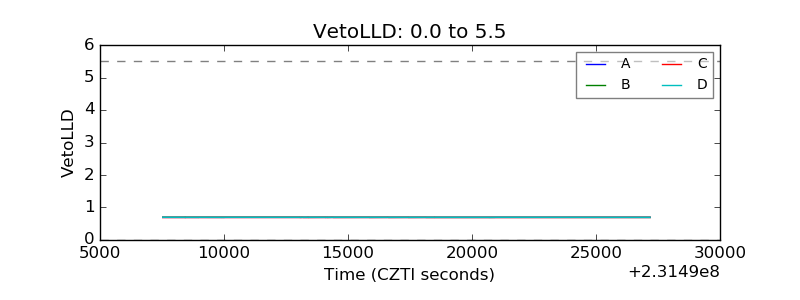 |
| Alpha Counter | 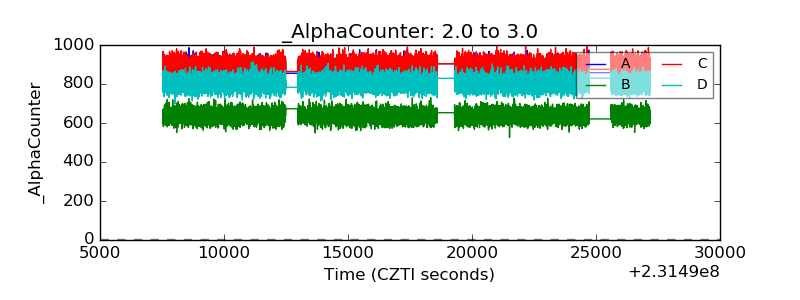 |
| _CPM_Rate | 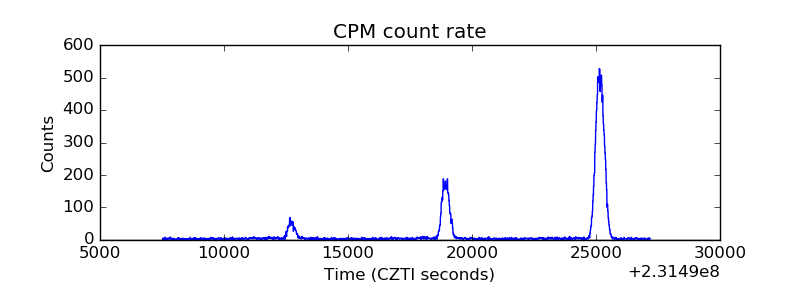 |
| CZT Counter | 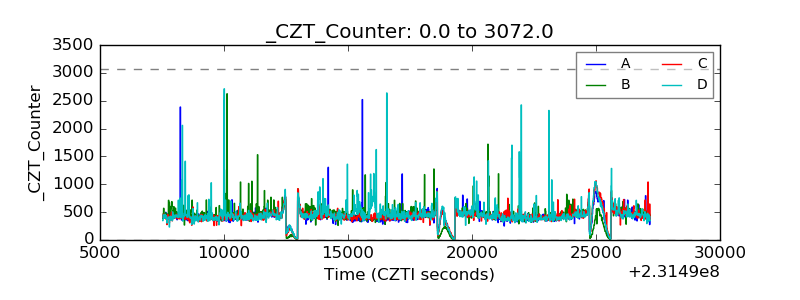 |
| +2.5 Volts monitor |  |
| +5 Volts monitor |  |
| _ROLL_ROT | 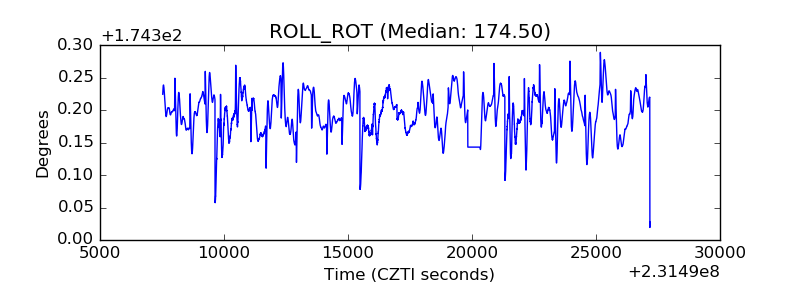 |
| _Roll_DEC | 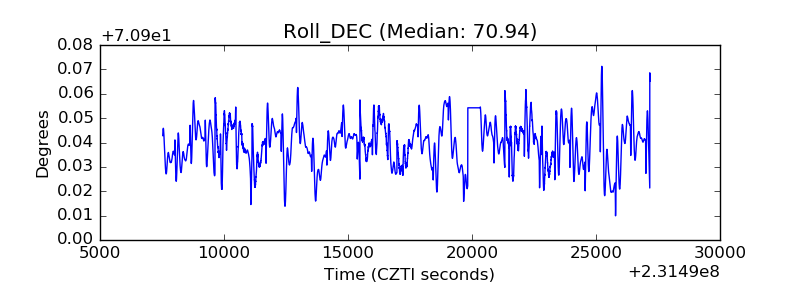 |
| _Roll_RA |  |
| Veto Counter | 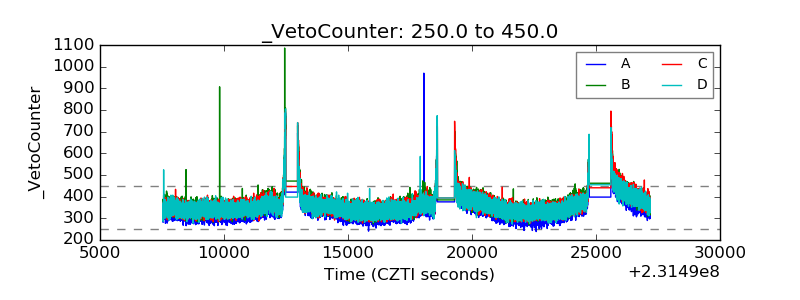 |